. 2023 Apr;37(4):765-775.
doi: 10.1038/s41375-023-01835-x. Epub 2023 Feb 4.

Mitochondrial fusion is a therapeutic vulnerability of acute myeloid leukemia

Affiliations

Mitochondrial fusion is a therapeutic vulnerability of acute myeloid leukemia

Clement Larrue et al. Leukemia. 2023 Apr.

Abstract

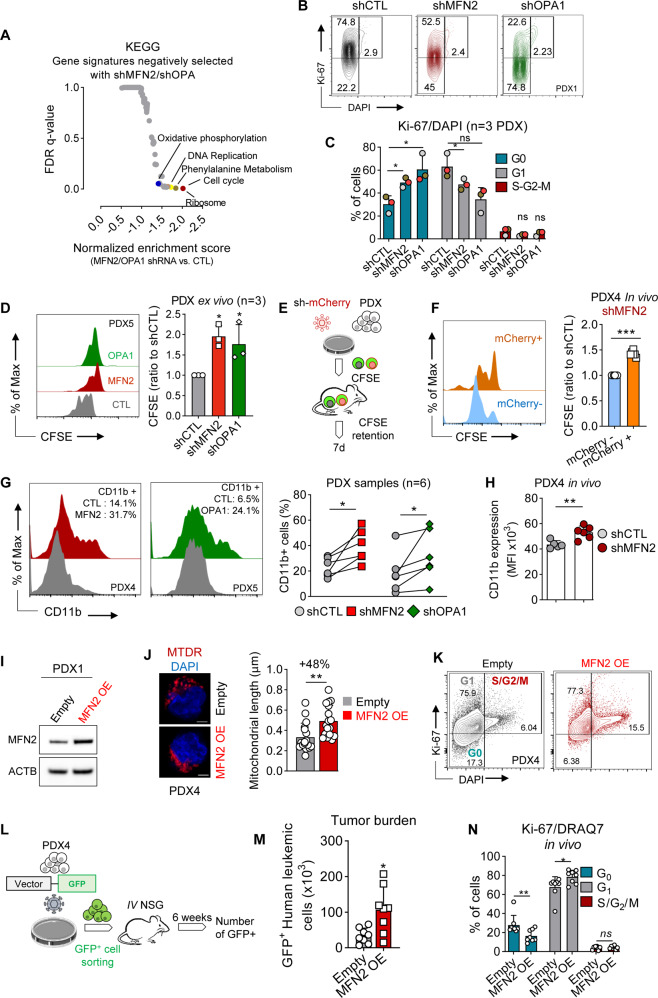
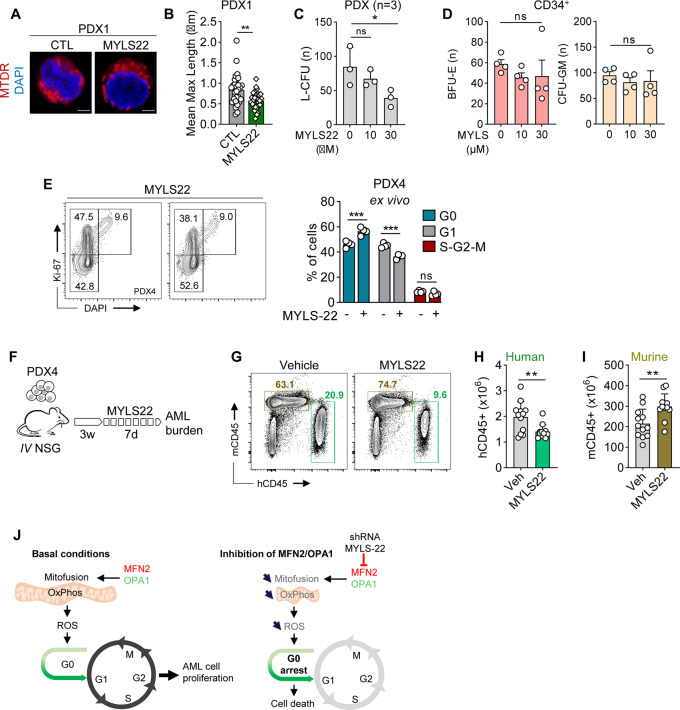
Mitochondrial metabolism recently emerged as a critical dependency in acute myeloid leukemia (AML). The shape of mitochondria is tightly regulated by dynamin GTPase proteins, which drive opposing fusion and fission forces to consistently adapt bioenergetics to the cellular context. Here, we showed that targeting mitochondrial fusion was a new vulnerability of AML cells, when assayed in patient-derived xenograft (PDX) models. Genetic depletion of mitofusin 2 (MFN2) or optic atrophy 1 (OPA1) or pharmacological inhibition of OPA1 (MYLS22) blocked mitochondrial fusion and had significant anti-leukemic activity, while having limited impact on normal hematopoietic cells ex vivo and in vivo. Mechanistically, inhibition of mitochondrial fusion disrupted mitochondrial respiration and reactive oxygen species production, leading to cell cycle arrest at the G0/G1 transition. These results nominate the inhibition of mitochondrial fusion as a promising therapeutic approach for AML.


Conflict of interest statement

The authors declare no competing interests.

Figures

Fig. 1
Fig. 1. Mitochondrial fusion is an AML dependency.
AE MOLM-14 and OCI-AML2 cells were transduced with doxycycline (dox) inducible shRNA against MFN1, MFN2, OPA1, MFF or DRP1, or control (CTL) shRNA (n = 3). A Western blots performed 72 h after dox using anti-MFN1, -MFN2, -OPA1, -MFF, -DRP1 and -β-actin (ACTB) antibodies. B Cell death measured by DAPI staining 72 h after dox. C Cell proliferation measured by daily counting using trypan blue exclusion assay for the indicated time after dox. D Electron microscopy imaging at a 7100x magnification five days after dox. Scale bars = 5 μm. E Quantification of mitochondria (Mt) length (left panel) and area (right panel) in control, or MFN2- or OPA1-depleted MOLM-14 cells. Each dot represents Mt length in μm or area in μ2 (n = 30 cells, 5–50 Mt were measured in each cell). FK PDX AML cells or normal immature CD34+ hematopoietic cells were transduced with mCherry-tagged shRNA targeting MFN2 or OPA1, or CTL shRNAs. In these mCherry+ transduced cells (input), we measured mitochondrial length (readout), performed ex vivo methylcellulose cultures to measure leukemia colony-forming units (L-CFUs), and evaluated the proportion of mCherry+ compared to mCherry- cells (output). G Quantification of MFN2 or OPA1 transcripts relative to cells transduced with CTL shRNA in PDX AML cells (n = 6 different PDXs). H L-CFU assays with PDX AML samples scored after 7–10 days (shMFN2, n = 8 different PDXs; shOPA1, n = 6 different PDXs). I, J mCherry staining in human AML cells transduced by mCherry+ lentiviral vectors before or after methylcellulose culture. I Representative contour plots in CTL or MFN2 shRNA conditions. J Ratio of mCherry+ cells between the input (before methylcellulose) and the output (after methylcellulose) (n = 6). K Quantification of erythroid (BFU-E, left panel) and myeloid (CFU-GM, right panel) colonies from CD34+ cells after MFN2 or OPA1 depletion under an inverted microscope after 10 days of methylcellulose culture (n = 4). Vertical bars indicate standard deviations. ns not significant, *p < 0.05, **p < 0.01, ***p < 0.001.
Fig. 2
Fig. 2. Inhibition of mitochondrial fusion targets leukemia-initiating cells in vivo.
A PDX AML cells were transduced with mCherry-tagged shRNA targeting MFN2 or OPA1, or CTL shRNAs, then transplanted to recipient NSG mice. After 10–16 weeks, the engraftment of mCherry+ human AML cells was analyzed quantitatively by flow cytometry and qualitatively by confocal imaging on bone marrow tissue samples. B Representative contour plots for mCherry versus side-scatter-A (SSC-A) across the experimental conditions. C Representative confocal microscopy images at 20x magnification assessing the proportion of mCherry+ AML cells in CTL compared to MFN2- or OPA1-depleted conditions. Scale bars = 50 μm. D Relative engraftment defined as a ratio between the output (proportion of mCherry+ cells after 10–16 weeks) and the input (mCherry+ before transplantation). Results are plotted to compare MFN2 or OPA1 to the CTL conditions. Each dot indicates the relative engraftment in single mice. Two different PDX samples were transduced with CTL or anti-MFN2, or CTL or anti-OPA1 shRNAs and each of these four conditions was transplanted to five mice. E, F PDX AML cells were transduced with mCherry-tagged CTL or anti-MFN2 shRNAs, then transplanted to primary recipient NSG mice (n = 4 for each condition). Next, human AML cells were sorted after 7 days and transplanted to secondary recipient mice (n = 7 for each condition). Relative engraftment of mCherry+ cells was measured 12 weeks after transplant. E Schematic representation of the assay. F Relative engraftment after 12 weeks in shCTL and shMFN2 conditions. Fold-changes (FC) between the CTL and MFN2-depleted conditions are provided. Vertical bars indicate standard deviations. ns not significant, *p < 0.05, **p < 0.01, ***p < 0.001.
Fig. 3
Fig. 3. Mitochondrial fusion inhibition regulates cell cycle at the G0/G1 transition.
A DGE analysis between CTL and MFN2- or OPA1-depleted PDX cells. Results are plotted as normalized enrichment score for KEGG signatures versus false discovery rate (FDR) q-value. BD PDX AML cells were transduced with mCherry-tagged shRNA targeting MFN2 or OPA1, or CTL shRNAs and cultured in methylcellulose for 7–10 days before Ki67/DAPI staining (n = 3). B Representative contour plots of Ki67 versus DAPI. C Quantification of G0, G1 and S/G2/M cell cycle phases. D Cells were incubated in vitro in methylcellulose with 1 µL CFSE. Left panel: histograms of CFSE intensity versus cell number. Right panel: CFSE mean fluorescence intensity (MFI) quantification relative to the CTL condition (n = 3). E PDX AML cells transduced with mCherry+ anti-MFN2 shRNA were labeled ex vivo with CFSE, and propagated to NSG mice for 7 days (n = 7). F CSFE retention was quantified in mCherry+ (efficiently transduced) versus mCherry- (non-transduced controls) cells. G PDX AML samples were transduced with mCherry-expressing control, anti-MFN2 or anti-OPA1 shRNAs (n = 6). Left panel: representative univariate flow cytometry histograms of CD11b expression among mCherry+ cells. The proportion of CD11b-positive cells is provided for each experimental condition. Right panel: proportion of CD11b+ cells. Results are plotted to compare CTL to MFN2 or OPA1 shRNA conditions. H PDX samples were transduced ex vivo with CTL or anti-MFN2 shRNA and transplanted to NSG mice. CD11b staining was quantified among efficiently-transduced mCherry+ cells 10–16 weeks after transplant (PDX4, n = 6 mice per group). IK PDX AML samples were transduced with a pSMAL GFP-tagged vector for MFN2 overexpression (OE), or with the empty vector. I Western blots for MFN2 and ACTB expression. J Confocal imaging using MitoTracker Deep Red (MTDR) and DAPI staining. Scale bar = 2 μm. Quantifications are provided on the right panel (n = 30 cells per condition). K Flow cytometry contour plots of Ki67 versus DAPI in control or MFN2 OE PDX cells. LN PDX4 AML cells were transduced with GFP+ empty or MFN2-OE vectors. Next, GFP+ cells were sorted and transplanted to NSG mice. AML tumor burden and cell cycle were evaluated after 6 weeks (n = 8 mice per group). L Experiment overview. M Quantification of AML tumor burden using GFP. N Cycle analysis among GFP+ cells using Ki67 and DRAQ7 staining. Vertical bars indicate standard deviations. ns not significant, *p < 0.05, **p < 0.01, ***p < 0.001.
Fig. 4
Fig. 4. Mitochondrial fusion regulates cell cycle through ROS production in AML.
AF PDX AML cells were transduced with mCherry-tagged shRNAs against MFN2 or OPA1, or CTL shRNA, or with a GFP-tagged vector for MFN2 overexpression (OE), or with the empty vector. A, B Bioenergetic assays measuring oxygen consumption rate (OCR) dependent on time (in pmol/min). O: oligomycin; F: FCCP; R: rotenone/antimycin A. Left panels: OCR dependent on time. Right panels: quantification of maximal OCR after the addition of the uncoupling agent fccp. Experiments reported in panels A and B were done in PDX5 and PDX1 samples, respectively (n = 5 technical replicates for each assay). Quantification of total or mitochondrial ROS production using CellROX or MitoSOX staining, respectively, in shRNA (C) or OE (D) experiments. Results are presented relative to the control condition (n = 4). E, F Leukemic cells were incubated for 48 h with 50 nM mitotempo (MTTP) (n = 3). E Quantification of intracellular (CellROX dye, left panel) or mitochondrial (MitoSOX dye, right panel) ROS. Results are presented relative to the CTL condition. F Representative contour plots and quantification of cell-cycle phases using Ki67/DAPI staining. Vertical bars indicate standard deviations. ns not significant, *p < 0.05, **p < 0.01, ***p < 0.001.
Fig. 5
Fig. 5. The small compound OPA1 inhibitor MYLS22 has anti-leukemic activity in vitro and in vivo.
A–E PDX AML cells or normal CD34+ hematopoietic cells were incubated with vehicle or 10–30 μM of the small compound OPA1 inhibitor MYLS22 in methylcellulose. A, B Quantification of mitochondrial length using MTDR/DAPI staining and confocal imaging (63x objective. Scale bars = 2 μm) in PDX cells. C L-CFU assays on PDX AML cells after 7–10 days (n = 3). D Colony formation from normal human CD34+ hematopoietic progenitor cells after 10 days (n = 4). Left panel: BFU-E, right panel: CFU-GM. E Representative contour plots (left panel) and cell-cycle phase quantification (right panel) using Ki67/DAPI staining (n = 4). FI Mice were treated with vehicle or 30 mg/kg MYLS22 by daily intraperitoneal injection during 7 days (n = 12 mice per arm). G Representative contour plots of hCD45 versus mCD45. H Quantification of hCD45+ human AML cells. I Quantification of mCD45+ murine hematopoietic cells. J MFN2 and OPA1 promote mitochondrial fusion, driving mitochondrial oxidative phosphorylation (OxPhos) and ROS production, which favor leukemic cells proliferation (left panel). After depletion of MFN2 or OPA1, or inhibition of OPA1 by the small compound MYLS22, inhibition of mitochondrial fusion results in ROS depletion and transition from G1 to G0 phase of cell cycle (right panel). Vertical bars indicate standard deviations. ns not significant, *p < 0.05, **p < 0.01, ***p < 0.001.

References

    1. Döhner H, Weisdorf DJ, Bloomfield CD. Acute myeloid leukemia. N Engl J Med. 2015;373:1136–52. - PubMed
    1. Döhner H, Wei AH, Löwenberg B. Towards precision medicine for AML. Nat Rev Clin Oncol. 2021. 10.1038/s41571-021-00509-w. - PubMed
    1. DiNardo CD, Pratz KW, Letai A, Jonas BA, Wei AH, Thirman M, et al. Safety and preliminary efficacy of venetoclax with decitabine or azacitidine in elderly patients with previously untreated acute myeloid leukaemia: a non-randomised, open-label, phase 1b study. Lancet Oncol. 2018;19:216–28. - PubMed
    1. DiNardo CD, Jonas BA, Pullarkat V, Thirman MJ, Garcia JS, Wei AH, et al. Azacitidine and venetoclax in previously untreated acute myeloid leukemia. N Engl J Med. 2020;383:617–29. - PubMed
    1. DiNardo CD, Maiti A, Rausch CR, Pemmaraju N, Naqvi K, Daver NG, et al. 10-day decitabine with venetoclax for newly diagnosed intensive chemotherapy ineligible, and relapsed or refractory acute myeloid leukaemia: a single-centre, phase 2 trial. Lancet Haematol. 2020;7:e724–36. - PMC - PubMed

Publication types

MeSH terms

Substances