. 2023 Feb 4;14(1):621.
doi: 10.1038/s41467-023-36232-6.

Pivotal role for S-nitrosylation of DNA methyltransferase 3B in epigenetic regulation of tumorigenesis

Affiliations

Pivotal role for S-nitrosylation of DNA methyltransferase 3B in epigenetic regulation of tumorigenesis

Kosaku Okuda et al. Nat Commun. .

Abstract

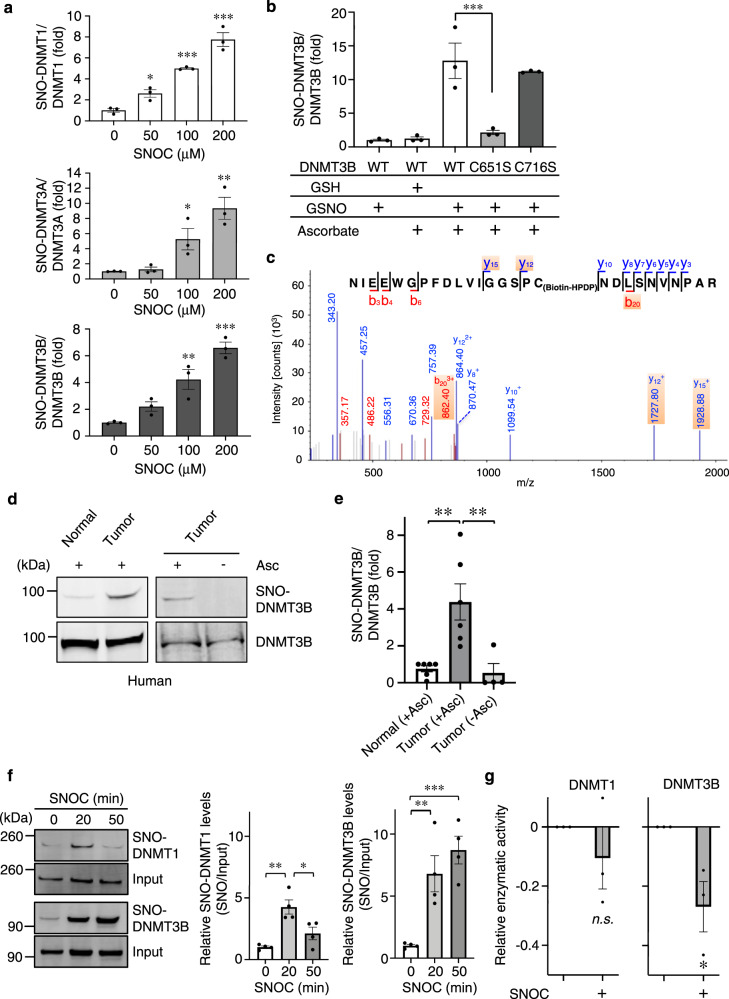
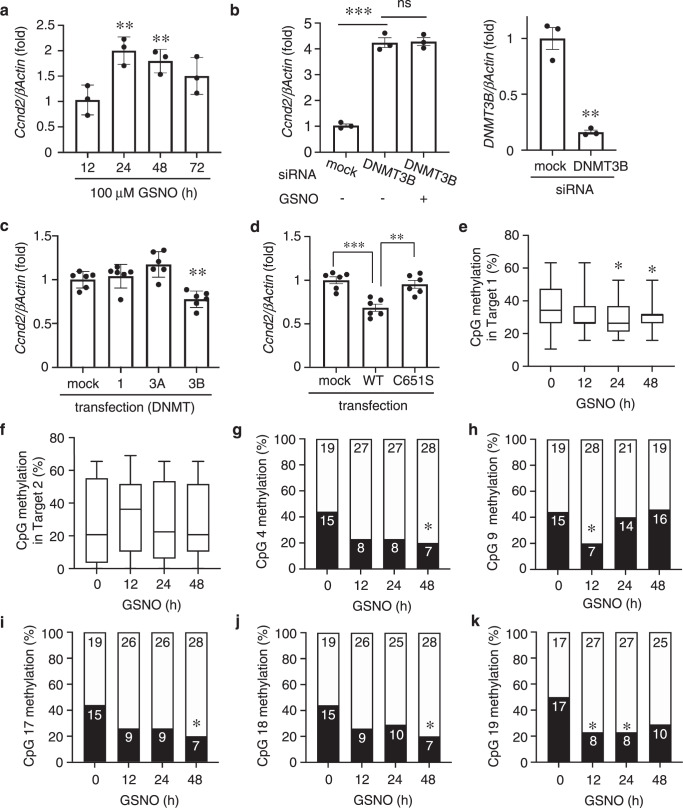
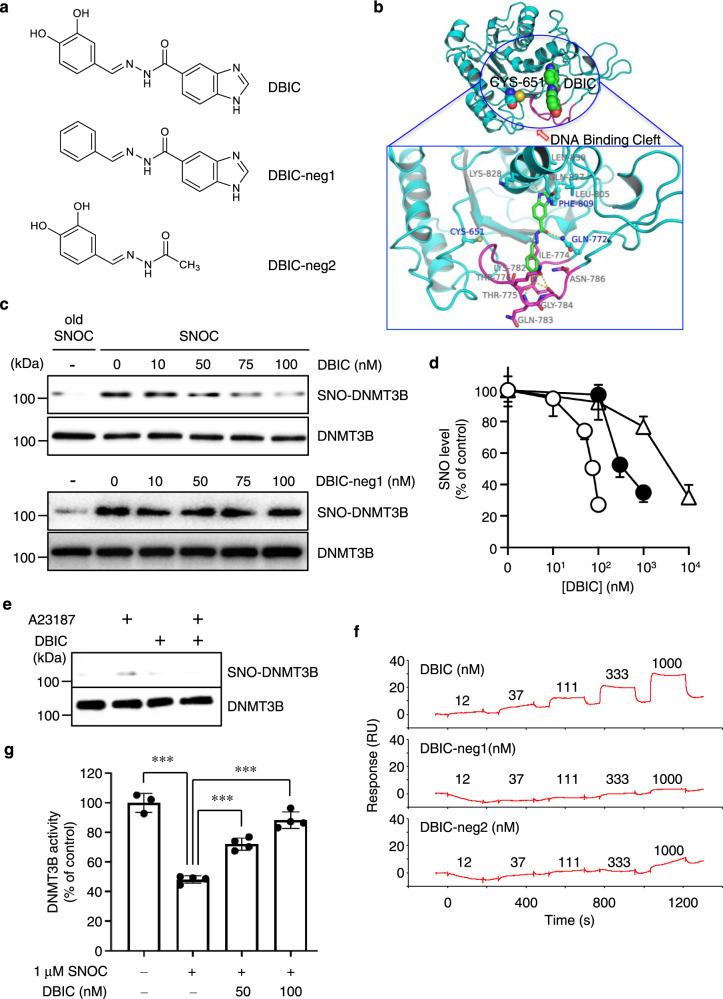
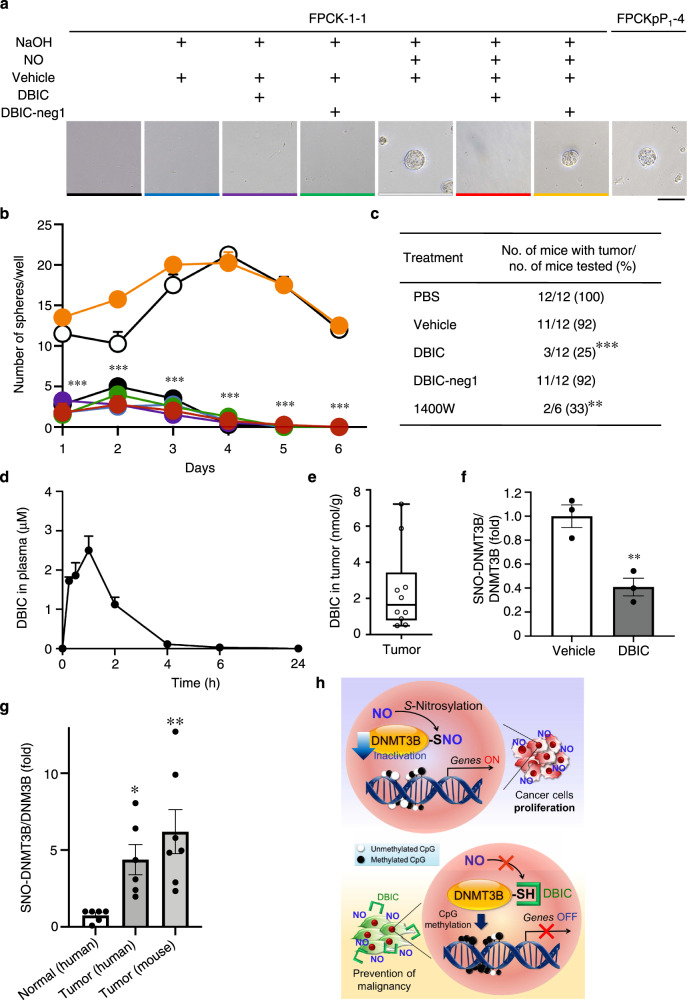
DNA methyltransferases (DNMTs) catalyze methylation at the C5 position of cytosine with S-adenosyl-L-methionine. Methylation regulates gene expression, serving a variety of physiological and pathophysiological roles. The chemical mechanisms regulating DNMT enzymatic activity, however, are not fully elucidated. Here, we show that protein S-nitrosylation of a cysteine residue in DNMT3B attenuates DNMT3B enzymatic activity and consequent aberrant upregulation of gene expression. These genes include Cyclin D2 (Ccnd2), which is required for neoplastic cell proliferation in some tumor types. In cell-based and in vivo cancer models, only DNMT3B enzymatic activity, and not DNMT1 or DNMT3A, affects Ccnd2 expression. Using structure-based virtual screening, we discovered chemical compounds that specifically inhibit S-nitrosylation without directly affecting DNMT3B enzymatic activity. The lead compound, designated DBIC, inhibits S-nitrosylation of DNMT3B at low concentrations (IC50 ≤ 100 nM). Treatment with DBIC prevents nitric oxide (NO)-induced conversion of human colonic adenoma to adenocarcinoma in vitro. Additionally, in vivo treatment with DBIC strongly attenuates tumor development in a mouse model of carcinogenesis triggered by inflammation-induced generation of NO. Our results demonstrate that de novo DNA methylation mediated by DNMT3B is regulated by NO, and DBIC protects against tumor formation by preventing aberrant S-nitrosylation of DNMT3B.


Conflict of interest statement

T. Uehara, A.I., A.K., K.Y.J.Z., and F.O. are inventors on a patent (JP6887640) related to the effects of specific inhibitors of S-nitrosylation of DNMT3. The remaining authors declare no competing interests.

Figures

Fig. 1
Fig. 1. NO regulates DNMT3B activity via S-nitrosylation.
a SNO-DNMT formation after exposure to an NO donor. HEK293 cells were exposed to the indicated concentration of SNOC. After 1 h, SNO-DNMTs were detected by biotin-switch assay. Values are expressed as mean ± s.e.m. (n = 3; *P < 0.05, **P < 0.01, ***P < 0.001 vs. SNOC 0 µM by one-way ANOVA with Dunnett’s post hoc test). b HEK293 cells, transduced with WT or C-to-S FLAG-tagged DNMT3B mutants, were exposed to 100 μM GSNO or GSH. After 1 h, SNO-DNMT3B was detected using biotin-switch assay with anti-FLAG antibody. Densitometric quantification of SNO-DNMT3B/total DNMT3B formation from biotin-switch and immunoblot data, as illustrated in Supplementary Fig. 1e. Values are mean ± s.e.m. (n = 3; ***P < 0.001 by one-way ANOVA with Bonferroni’s post hoc test). c Mass spectrometry identification of S-nitrosylated Cys-containing peptide in full-length DNMT3B. Representative annotated LC-MS/MS spectrum of biotin-labeled Cys651-containing peptide after trypsin digestion. d, e Representative human colon cancer or control tissue subjected to biotin-switch assay to detect SNO-DNMT3B that occurred in vivo (d). Ratio of human SNO-DNMT3B/total DNMT3B from biotin-switch assay and immunoblot analysis, respectively, quantified by densitometry (e). Values are mean ± s.e.m. (n = 4–6; **P < 0.01 by one-way ANOVA with Tukey’s post hoc test). f Differential temporal levels of S-nitrosylation of DNMT1 and DNMT3B in cell-based assays. For cell-based assays, HEK293T cells expressing myc-tagged DNMT1 or DNMT3B were exposed to 200 μM SNOC. After 20 and 50 min, nuclear extracts were isolated, and SNO-DNMTs were detected by biotin-switch assay. Ratio of SNO-DNMT/total DNMT quantified by densitometry. Values are expressed as mean ± s.e.m. (n = 4; *P < 0.05, **P < 0.01 by one-way ANOVA with Tukey’s post hoc test). g Effect of SNOC on DNMT activity in HEK293T cells. HEK293T cells expressing DNMT1 or DNMT3B were exposed to SNOC. Thirty minutes later, nuclear extracts were isolated, and DNMT enzymatic activity was determined after approximately 1 h. Values are mean ± s.e.m. relative to basal activity (n = 3; *P < 0.05, by two-tailed Student’s t-test). Source data are provided as a Source data file.
Fig. 2
Fig. 2. Regulation of Cyclin D2 expression via S-nitrosylation of DNMT3B.
a NO-stimulated Cyclin D2 (Ccnd2) mRNA expression. RT-qPCR was performed using specific primers for each mRNA. Values are expressed as mean ± s.e.m. (n = 3; **P < 0.01 by two-way ANOVA with Bonferroni’s post hoc test). b Left: Level of Ccnd2 24 h after exposure to GSNO in cells previously transfected with DNMT3B siRNA or mock control. Values are mean ± s.e.m. (n = 3; ***P < 0.001 by one-way ANOVA with Tukey’s post hoc test, ns: not significant). Right: Degree of knockdown of DNMT3B by siRNA vs. mock control (n = 3; **P < 0.01 by two-tailed Student’s t-test). c Cells were transduced with WT DNMT1, DNMT3A or DNMT3B, and then assayed for Ccnd2 mRNA levels. Values are mean ± s.e.m. (n = 6; **P < 0.01 vs. mock by one-way ANOVA with Bonferroni’s post hoc test). d HEK cells were transduced with WT or C-to-S mutant DNMT3B and then assayed for Ccnd2 mRNA levels. Values are mean ± s.e.m. (n = 6; **P < 0.01, ***P < 0.001, by one-way ANOVA with Bonferroni’s post hoc test). e, f HeLa cells were exposed to GSNO and incubated for varying periods. Methylation levels at CpG sites (Targets 1 and 2) within the promoter region of Ccnd2 were detected by bisulfite sequencing. Experiments were performed using 34–35 samples from triplicate cultures run in parallel. Representative results for the CpG sites of the Ccnd2 promoter in cells 12–48 h after exposure to GSNO. For box plots, the center lines represent the median, and the box limits are the 25th and 75th percentiles. Whiskers outline minimum to maximum values (n = 34–35; *P < 0.05 vs. GSNO 0 h by two-tailed Wilcoxson’s rank-sum test). gk Each cytosine in the Target 1 CpG sites (−3621, −3485, −3430, −3426, −3424) was sensitive to NO and significantly less methylated as determined by two-tailed Fisher’s exact (*P < 0.05 vs. GSNO 0 h). Closed bars. methylated CpG sites. Open bars, demethylated CpG sites. Source data are provided as a Source data file.
Fig. 3
Fig. 3. DBIC, a potent inhibitor of SNO-DNMT3 formation.
a Chemical structures of DBIC and its negative control compounds (DBIC-neg1 and DBIC-neg2). b Molecular docking predicted binding mode of DBIC (green) in DNMT3B (cyan). Loop in the region of Thr773 to Asn786 is colored in magenta. c, d HEK293 cells were preincubated with varying concentrations of DBIC or DBIC-neg1 for 1 h prior to SNOC exposure. SNO-DNMT3B formation was detected by biotin-switch assay. The data shown represent one of three separate experiments as shown in (d). Biotin-switch assay and immunoblot analysis were quantified by densitometry; the relative ratio of SNO-DNMT to total DNMT was calculated for each sample (d). Values are expressed as mean ± s.e.m. (n = 3). Open circles, DNMT3B. Closed circles, DNMT3A. Open triangles, DNMT1. e DBIC inhibited SNO-DNMT3B formation generated by endogenous NO in HEK-293 cells stably expressing NOS1. NOS1 was activated by calcium ionophore A23187. f Direct binding of DBIC to full-length DNMT3B protein determined by surface plasmon resonance analysis. g Effect of DBIC on DNMT3B enzymatic activity attenuated by NO. Values are expressed as mean ± s.e.m. (n = 3–4, ***P < 0.001 by one-way ANOVA with Bonferroni’s post hoc test). Source data are provided as a Source data file.
Fig. 4
Fig. 4. DBIC suppresses NO-induced tumor formation.
a FPCK-1-1 cells were treated with 100 nM DBIC, DBIC-neg1, or 126 μM NOC18 every 3 days for a month before transfer to 3D culture. Spheroidal aggregate formation of FPCK-1-1 (or FPCKpP1-4 control) cells was assessed 3 d after plating. Scale bar, 50 μm. The data represent one of four separate experiments. b DBIC inhibited NO-induced sphere formation assessed 7 days post plating. Values are mean ± s.e.m. (n = 4; ***P < 0.001 by two-way ANOVA with Bonferroni’s post hoc test). Treatments: None (black); vehicle (blue); DBIC (purple); DBIC-neg1 (green); NO (white); NO + DBIC (red); NO + DBIC-neg1 (orange). Colors correspond to code in representative micrographs in (a). c DBIC inhibits inflammation-related carcinogenesis in vivo. DBIC, DBIC-neg1 (25 mg/kg/day), or 1400 W (6 mg/kg/day) administered by i.p. injection from pre-implantation day 2 through day 35 post cell implantation. Regressive QR-32 cells (1 × 10⁵) were implanted into mice on day 0 in a subcutaneously pre-inserted foreign body (gelatin sponge, 10 × 5 × 3 mm). **P < 0.01, ***P < 0.001 vs. vehicle by χ2-test. d Time course of DBIC concentration in plasma after single i.p. administration (25 mg/kg) measured by LC-MS/MS. Values are mean ± s.e.m. (n = 3). e Concentration of DBIC in tumor tissue after 25 d of daily administration. Samples were analyzed 1 h after the final dose. For box plots, center line represents median; box limits are 25th and 75th percentiles. Whiskers represent minimum-maximum values (n = 10). f SNO-DNMT3B in tumor tissue. Values are mean ± s.e.m. (n = 3; **P < 0.01 by two-tailed Student’s t-test). g Relative ratio of SNO-DNMT3B in human and mouse tumors. Biotin-switch and immunoblot assays were quantified by densitometry to calculate relative ratio of SNO-DNMT3B to total DNMT3B. Values are mean ± s.e.m. (n = 6–7; *P < 0.05, **P < 0.01 vs Normal by one-way ANOVA with uncorrected Fisher’s LSD post hoc test). h Schematic of SNO-DNMT mechanism of action on expression of specific genes associated with neoplasia via decreased methylation of CpG sites. Source data are provided as a Source data file.

References

    1. Lipton SA, et al. A redox-based mechanism for the neuroprotective and neurodestructive effects of nitric oxide and related nitroso-compounds. Nature. 1993;364:626–632. - PubMed
    1. Stamler JS. Redox signaling: nitrosylation and related target interactions of nitric oxide. Cell. 1994;78:931–936. - PubMed
    1. Foster MW, Hess DT, Stamler JS. Protein S-nitrosylation in health and disease: a current perspective. Trends Mol. Med. 2009;15:391–404. - PMC - PubMed
    1. Wolhuter K, Eaton P. How widespread is stable protein S-nitrosylation as an end-effector of protein regulation? Free Radic. Biol. Med. 2017;109:156–166. - PubMed
    1. Nakamura T, Lipton SA. Protein S-nitrosylation as a therapeutic target for neurodegenerative diseases. Trends Pharmacol. Sci. 2016;37:73–84. - PMC - PubMed

Publication types

MeSH terms

Substances