. 2023 Feb 4;10(1):73.
doi: 10.1038/s41597-023-01987-6.

Database of daily Lagrangian Arctic sea ice parcel drift tracks with coincident ice and atmospheric conditions

Affiliations

Database of daily Lagrangian Arctic sea ice parcel drift tracks with coincident ice and atmospheric conditions

Sean Horvath et al. Sci Data. .

Abstract

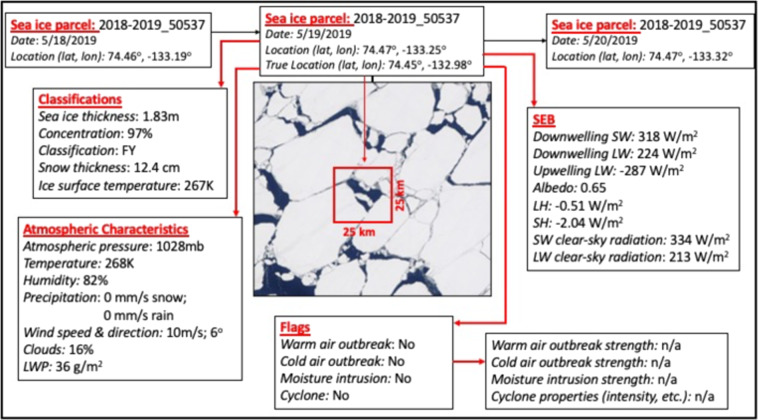
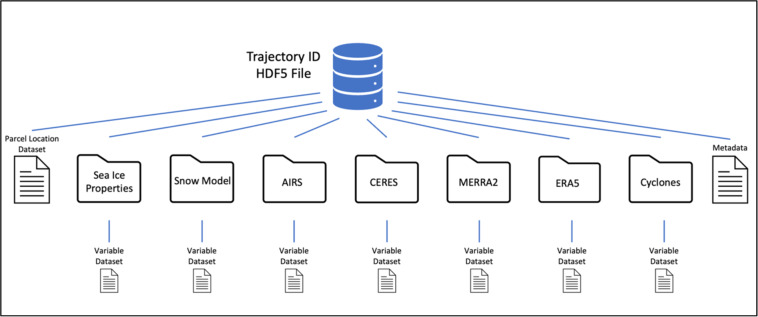
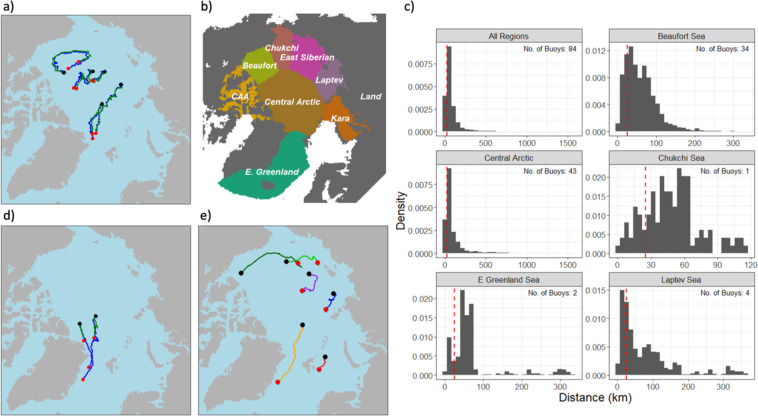
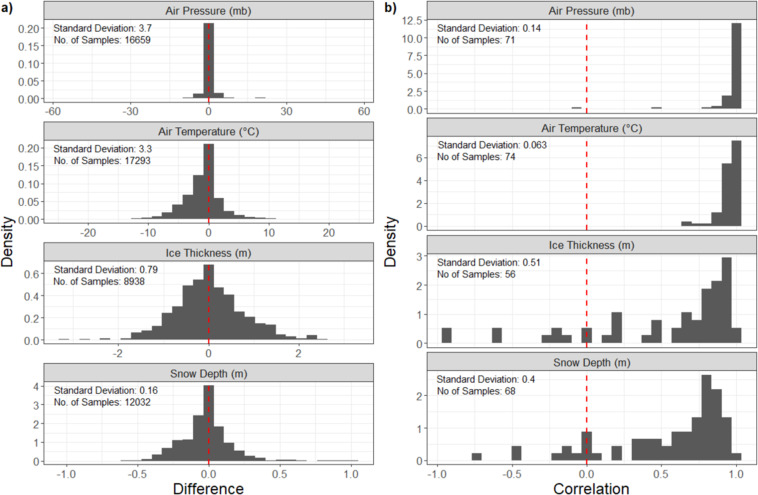
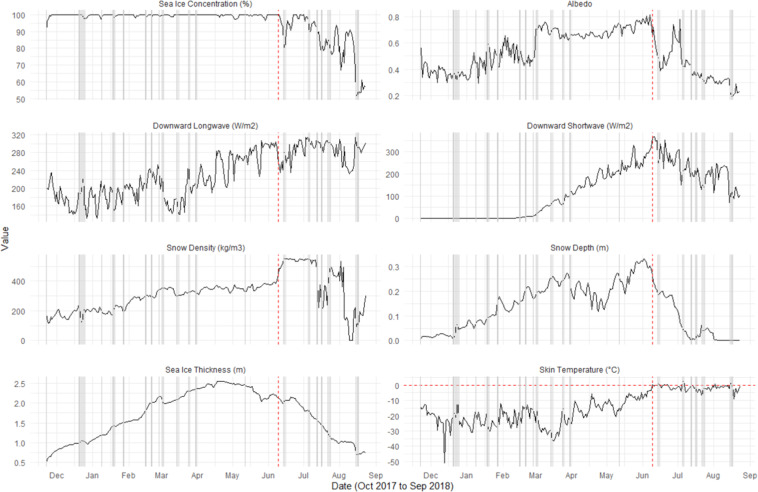
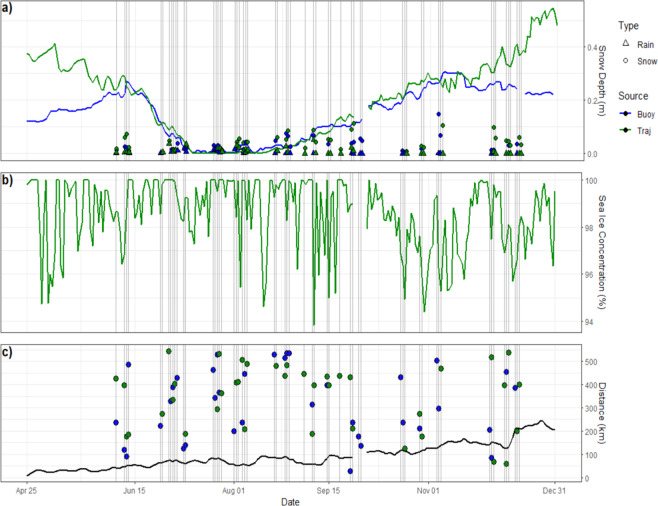
Since the early 2000s, sea ice has experienced an increased rate of decline in thickness, extent and age. This new regime, coined the 'New Arctic', is accompanied by a reshuffling of energy flows at the surface. Understanding of the magnitude and nature of this reshuffling and the feedbacks therein remains limited. A novel database is presented that combines satellite observations, model output, and reanalysis data with sea ice parcel drift tracks in a Lagrangian framework. This dataset consists of daily time series of sea ice parcel locations, sea ice and snow conditions, and atmospheric states, including remotely sensed surface energy budget terms. Additionally, flags indicate when sea ice parcels travel within cyclones, recording cyclone intensity and distance from the cyclone center. The quality of the ice parcel database was evaluated by comparison with sea ice mass balance buoys and correlations are high, which highlights the reliability of this database in capturing the seasonal changes and evolution of sea ice. This database has multiple applications for the scientific community; it can be used to study the processes that influence individual sea ice parcel time series, or to explore generalized summary statistics and trends across the Arctic.


Conflict of interest statement

The authors declare no competing interests.

Figures

Fig. 1
Fig. 1
A schematic and details of the information associated with the Lagrangian tracked sea ice parcel #2018–2019_50537. Each sea ice parcel, on each day of the year, contains sea ice characteristics, atmospheric characteristics, SEB, and episodic weather cyclone event flags at a specific date and location. In the schematic, MY is multi-year sea ice, FY is first-year sea ice, LWP is liquid water path, SW is shortwave radiation, LW is longwave radiation, and LH is latent heat flux and SH is sensible heat flux.
Fig. 2
Fig. 2
File structure for individual trajectories in the database.
Fig. 3
Fig. 3
Database domain uses the 25-km polar stereographic grid EASE from NSIDC. Each number corresponds to a different region. These are, 1: Open Ocean, 2: Sea of Okhotsk, 3: Bering Sea, 4: Hudson Bay, 5: North Atlantic, 6: Baffin Bay/Labrador Sea, 7: E. Greenland Sea, 8: Barents Sea, 9: Kara Sea, 10: Laptev Sea, 11: E. Siberian Sea, 12: Chukchi Sea, 13: Beaufort Sea, 14: Canadian Archipelago, 15: Central Arctic, 20: Land, and 21: Coasts. These numbers are included in the metadata for each parcel.
Fig. 4
Fig. 4
Comparison of ice mass balance buoy tracks and simulated sea ice parcel tracks. (a) Sample of buoy tracks (blue) and the closest ice parcel at time of deployment (green). The black/red dots represent beginning/ending locations. (b) Map of Arctic Ocean regions. (c) Histogram of the daily distance between buoys and ice parcel track by deployment region. Vertical dotted red lines indicate 25 km. (d) Buoy tracks (blue) and corresponding sea ice parcel trajectories (green) where the distance between tracks exceeds 500 km. Black/red dots indicate beginning/ending locations. (e) Selected example parcel drift tracks. Black/red dots indicate starting/ending locations.
Fig. 5
Fig. 5
Comparison between buoys and tracked ice parcels of ice thickness, snow depth (from SnowModel-LG forced with MERRA-2), and air temperature and pressure (parcel air temperature and pressure are from MERRA-2). (a) Difference between buoy and ice parcel (buoy - ice parcel value), and (b) correlation between buoys and ice parcels (vertical dotted red line at 0 for both difference and correlation).
Fig. 6
Fig. 6
Influence of location errors on parameter errors. Color bar shows the distance between the Lagrangian track and the buoy (on logarithmic scale for clarity). Gray dotted lines mark zero for each axis, red dotted line shows the 1-to-1 line.
Fig. 7
Fig. 7
Yearly summaries of sea ice parcels. (a) Yearly total number of sea ice parcels (blue) and average duration of sea ice parcels (green). Both values are normalized for ease of comparison. Dotted lines are the linear fit. (b) Yearly number of sea ice parcels that melt (red) and freeze (blue) by month.
Fig. 8
Fig. 8
Survivability of sea ice parcels. (a) Percentage of first year (FYI) and multiyear (MYI) sea ice parcels that melt/survive (red/blue) the summer melt season. (b) Daily averaged net SEB for June-August, grouped by region where ice parcels end. Sea ice parcels that melted out are in red, sea ice parcels that survived the melt season are in blue. Lines are the locally estimated scatterplot smoothing (LOESS) curve fit.
Fig. 9
Fig. 9
Variable time-series for the light green trajectory seen in Fig. 3e. Horizontal dotted red line indicates 0 °C. Vertical grey lines indicate cyclone flags. Vertical dotted red lines indicate the date skin temperature first rises above the freezing point. Sea ice concentration is from the sea ice concentration CDR, sea ice thickness is from PIOMAS, snow depth and density are from SnowModel-LG forced with MERRA-2, downward longwave and shortwave radiation and albedo are from CERES, and skin temperature is from AIRS.
Fig. 10
Fig. 10
Comparison of buoy ID 2004D with the nearest sea ice parcel ID 2003–2004_19893 (orange trajectory in Fig. 3e). Blue/green represents values from the buoy/sea ice parcel database. Vertical lines indicate the presence of cyclones. (a) Snow depth measurements (sea ice parcel values from SnowModel-LG with MERRA2 forcing). Circles show daily total snowfall, triangles show daily total rainfall, both from the cyclone database. (b) Sea ice concentration (CDR). (c) Distance between the buoy/sea ice parcel and the center of the nearest cyclone. Black line indicates the distance between the buoy and sea ice parcel. The data gap at the end of September is the restart of the tracking algorithm.

References

    1. Comiso JC. A rapidly declining perennial sea ice cover in the Arctic. Geophys. Res. Lett. 2002;29(20):17-1–17–4.
    1. Kwok R. Arctic sea ice thickness, volume, and multiyear ice coverage: Losses and coupled variability (1958–2018) Environ. Res. Lett. 2018;13(10):105005.
    1. Stroeve, J., Holland, M. M., Meier, W., Scambos, T., & Serreze, M. Arctic sea ice decline: Faster than forecast. Geophys. Res. Lett. 34(9) (2007).
    1. Stroeve J, Notz D. Changing state of Arctic sea ice across all seasons. Environ. Res. Lett. 2018;13(10):103001.
    1. Francis, J. A., & Vavrus, S. J. Evidence linking Arctic amplification to extreme weather in mid-latitudes. Geophys. Res. Lett. 39(6) (2012).

LinkOut - more resources