. 2021 Jun 28;1(1):29.
doi: 10.1038/s43705-021-00028-w.

Bacterial communities in temperate and polar coastal sands are seasonally stable

Affiliations

Bacterial communities in temperate and polar coastal sands are seasonally stable

Sebastian Miksch et al. ISME Commun. .

Abstract

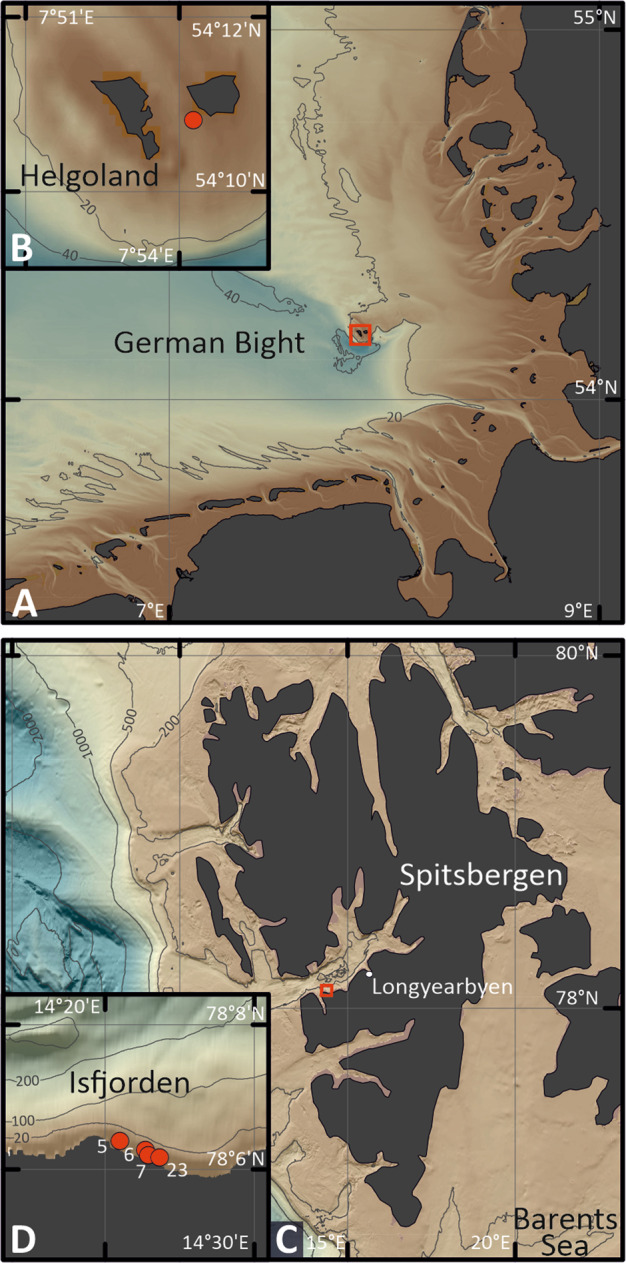
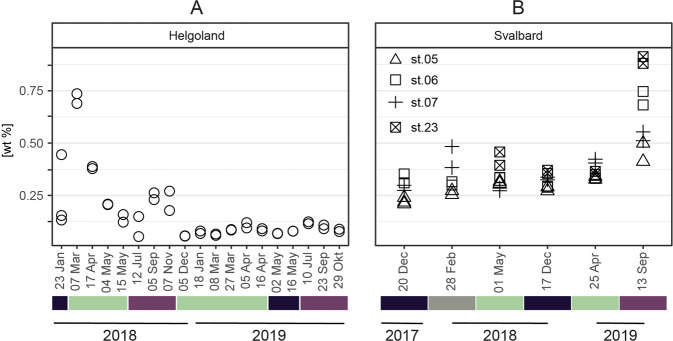
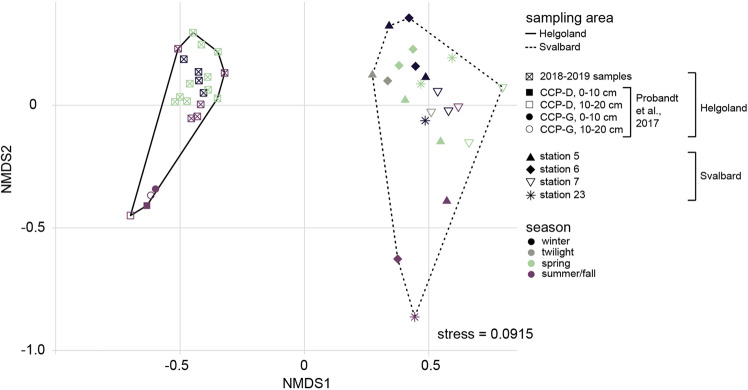
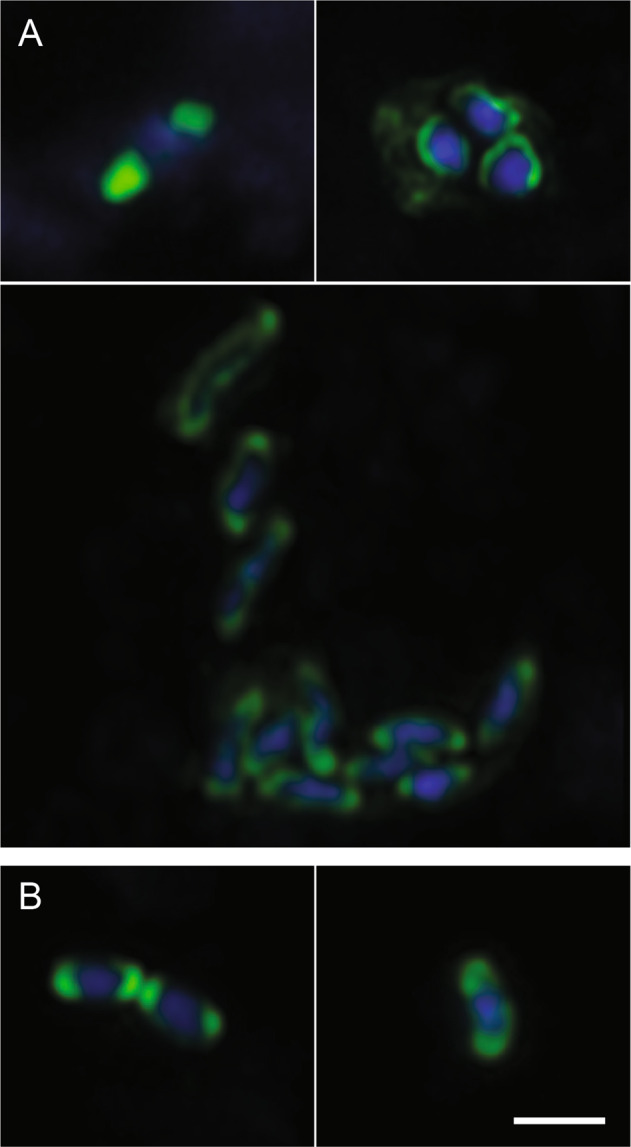
Coastal sands are biocatalytic filters for dissolved and particulate organic matter of marine and terrestrial origin, thus, acting as centers of organic matter transformation. At high temporal resolution, we accessed the variability of benthic bacterial communities over two annual cycles at Helgoland (North Sea), and compared it with seasonality of communities in Isfjorden (Svalbard, 78°N) sediments, where primary production does not occur during winter. Benthic community structure remained stable in both, temperate and polar sediments on the level of cell counts and 16S rRNA-based taxonomy. Actinobacteriota of uncultured Actinomarinales and Microtrichales were a major group, with 8 ± 1% of total reads (Helgoland) and 31 ± 6% (Svalbard). Their high activity (frequency of dividing cells 28%) and in situ cell numbers of >10% of total microbes in Svalbard sediments, suggest Actinomarinales and Microtrichales as key heterotrophs for carbon mineralization. Even though Helgoland and Svalbard sampling sites showed no phytodetritus-driven changes of the benthic bacterial community structure, they harbored significantly different communities (p < 0.0001, r = 0.963). The temporal stability of benthic bacterial communities is in stark contrast to the dynamic succession typical of coastal waters, suggesting that pelagic and benthic bacterial communities respond to phytoplankton productivity very differently.


Conflict of interest statement

The authors declare no competing interests.

Figures

Fig. 1
Fig. 1. Map of sampling areas.
A, B Helgoland Roads, North Sea (German Bight); C, D Isfjorden, an Arctic fjord in western Spitsbergen (archipelago of Svalbard, Arctic Ocean). Data sources: European Environment Agency, EEA coastline derived from EU-Hydro and GSHHG data; http://www.eea.europa.eu/data-and-maps/data/eea-coastline-for-analysis and EMODnet Bathymetry Consortium (2016, 2020): EMODnet Digital Bathymetry (DTM). 10.12770/bb6a87dd-e579-4036-abe1-e649cea9881a; 10.12770/c7b53704-999d-4721-b1a3-04ec60c87238.
Fig. 2
Fig. 2. Grain size distribution (vol%) of A Helgoland and B Svalbard surface sediments (0–2 cm depth) derived from laser diffraction particle size analysis.
Please note the different y-scales for Helgoland samples.
Fig. 3
Fig. 3
Total organic carbon content in A Helgoland and B Svalbard sediments. Seasons are color-coded (winter: black, twilight: gray; spring: green; summer/autumn: aubergine-colored).
Fig. 4
Fig. 4. Relative abundance of bacterial families and genera in Helgoland surface sediments and Svalbard sediments and seawater based on sequencing of 16S rRNA genes (V3-V4 region).
Taxonomy based on SILVA SSU138.1 Ref NR99 database. Only taxa that accounted for >2% of total sequences in at least one of the samples are shown. Minor abundant taxa were clustered on higher taxonomic levels and displayed as “other”. The bubbles’ diameters give read frequencies, bubbles’ colors indicate the season of sampling. For Svalbard samples, station numbers are indicated on the x-axis. As proxy for current or recent photosynthetic activity and primary production, read frequencies of sequences classified as chloroplasts are shown in the top bar charts.
Fig. 5
Fig. 5. NMDS ordination plot of sampling areas at Helgoland and Svalbard, generated from 16S rRNA gene datasets.
Data from sites CCP-D and CCP-G, 6.5 km apart from Helgoland (bioproject number PRJEB18774, ref. [28]) were included in the analysis. The sampling areas are depicted as polygons. Helgoland and Svalbard bacterial community structures were significantly different supported by an ANOSIM R value of 0.96 (p < 0.0001). Dissimilarity based on season was not supported by ANOSIM (R = 0.06, p = 0.09).
Fig. 6
Fig. 6. In situ abundance of bacterial taxa in Svalbard sediments as determined by CARD FISH.
Bars give absolute cells numbers, circles give relative abundances. Seasons are color-coded (winter: black, twilight: gray; spring: green; summer/fall: aubergine-colored).
Fig. 7
Fig. 7. Laser scanning micrographs of Actinobacteriota in Svalbard sediments as detected by CARD-FISH.
A Actinomarinales visualized by probe ACM1218; B Microtrichales visualized by probe MIT1218. Green, CARD-FISH signals; blue, DAPI signals. Scale bar, 1 µm.

References

    1. Boudreau BP, Huettel M, Forster S, Jahnke RA, Middelburg JJ, Boudreau BP, et al. Permeable marine sediments: overturning an old paradigm. Eos Trans AGU. 2001;82:133–6.
    1. Huettel M, Berg P, Kostka JE. Benthic exchange and biogeochemical cycling in permeable sediments. Annu Rev Mar Sci. 2014;6:23–51. doi: 10.1146/annurev-marine-051413-012706. - DOI - PubMed
    1. Huettel M, Ziebis W, Forster S. Flow-induced uptake of particulate matter in permeable sediments. Limnol Oceanogr. 1996;41:309–22. doi: 10.4319/lo.1996.41.2.0309. - DOI
    1. Huettel M, Rusch A. Transport and degradation of phytoplankton in permeable sediment. Limnol Oceanogr. 2000;45:534–49. doi: 10.4319/lo.2000.45.3.0534. - DOI
    1. Rusch A, Forster S, Huettel M. Bacteria, diatoms and detritus in an intertidal sandflat subject to advective transport across the water-sediment interface. Biogeochemistry. 2001;55:1–27. doi: 10.1023/A:1010687322291. - DOI