. 2023 Feb 4;14(1):610.
doi: 10.1038/s41467-023-35995-2.

Evolutionary route of nasopharyngeal carcinoma metastasis and its clinical significance

Affiliations

Evolutionary route of nasopharyngeal carcinoma metastasis and its clinical significance

Mei Lin et al. Nat Commun. .

Abstract

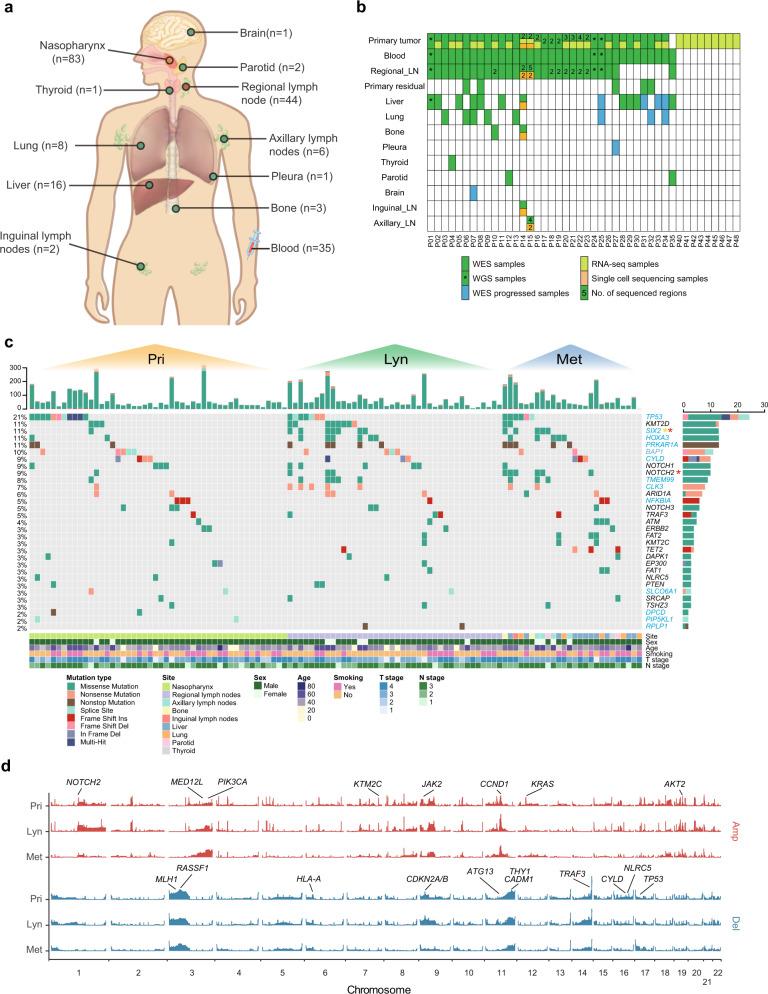
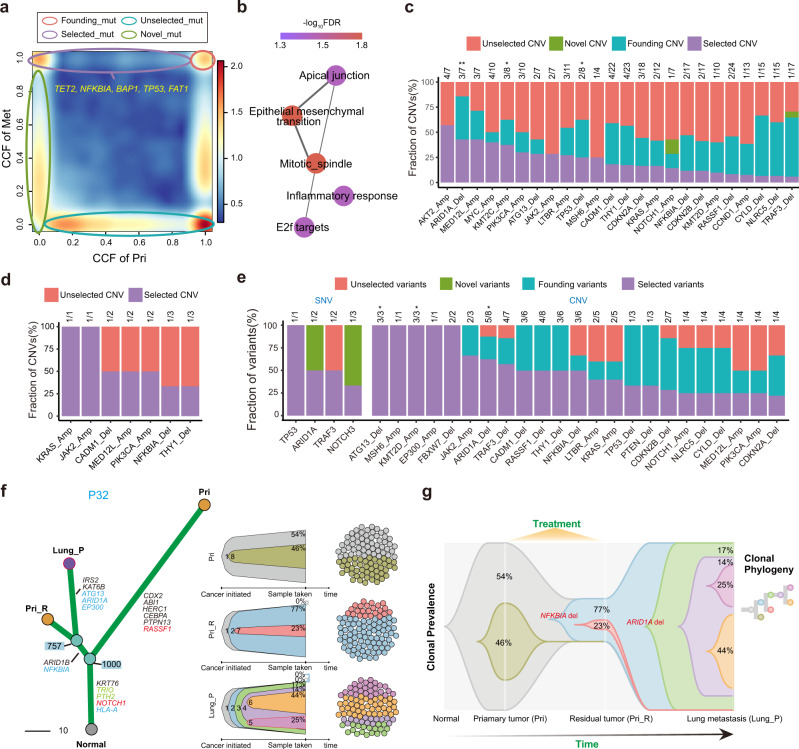
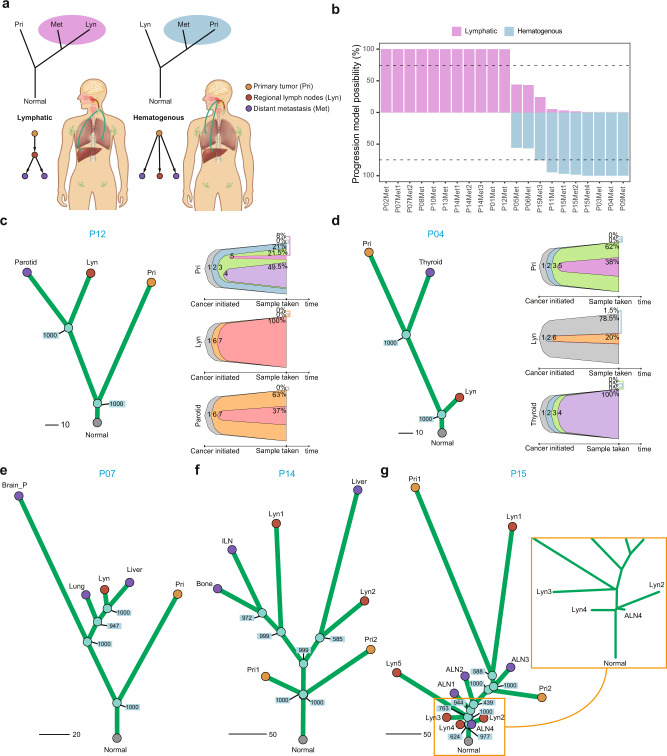
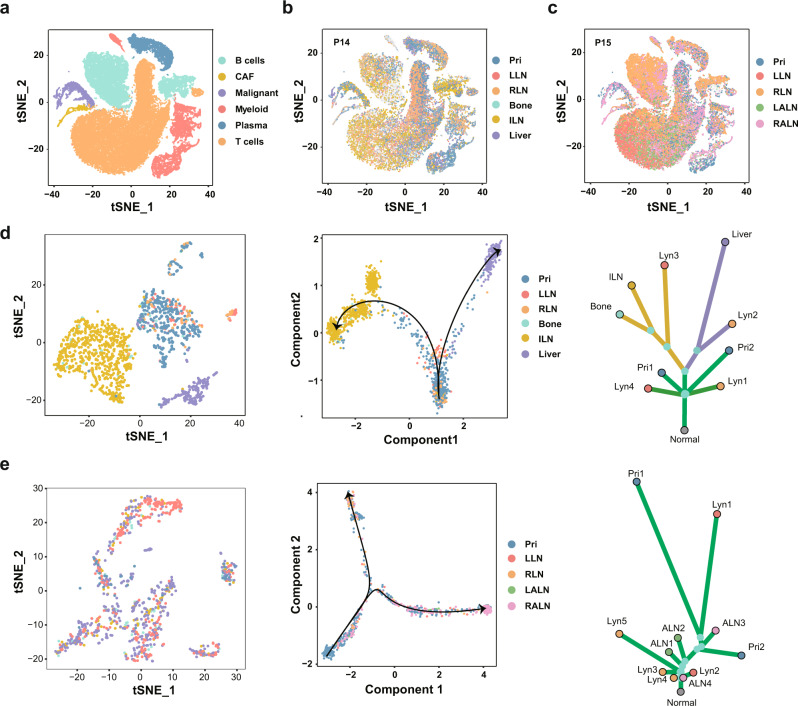
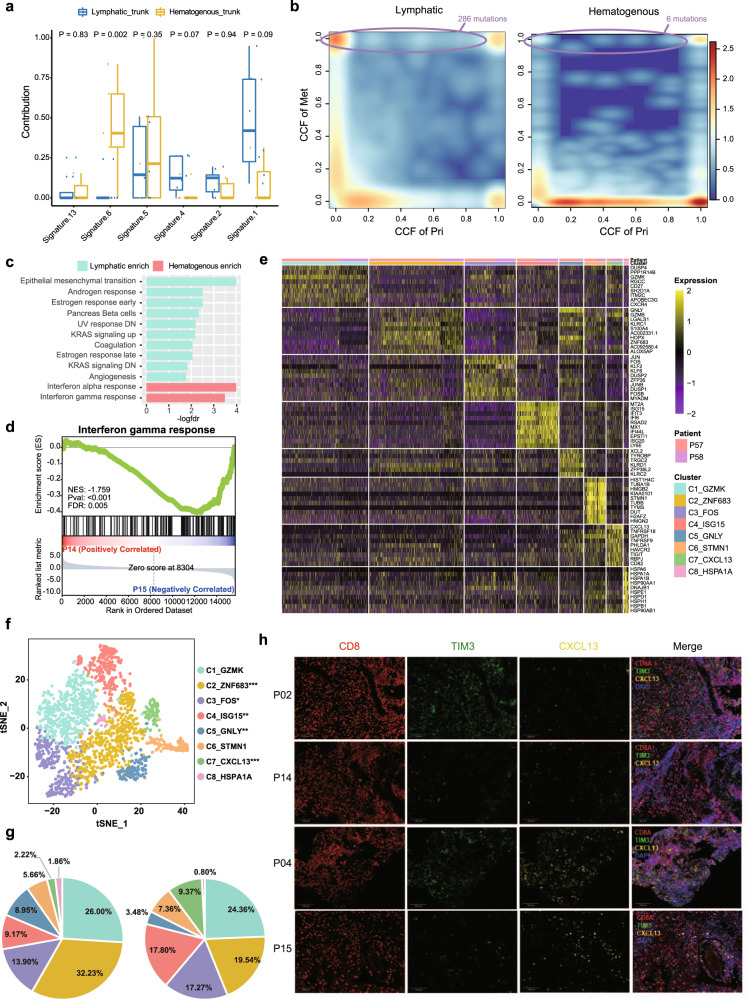
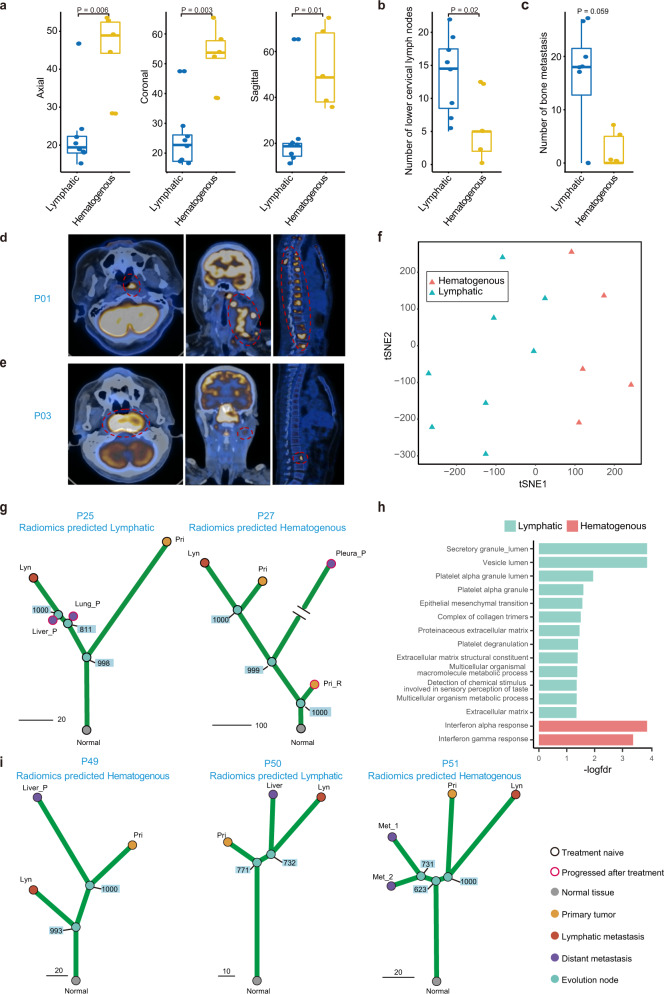
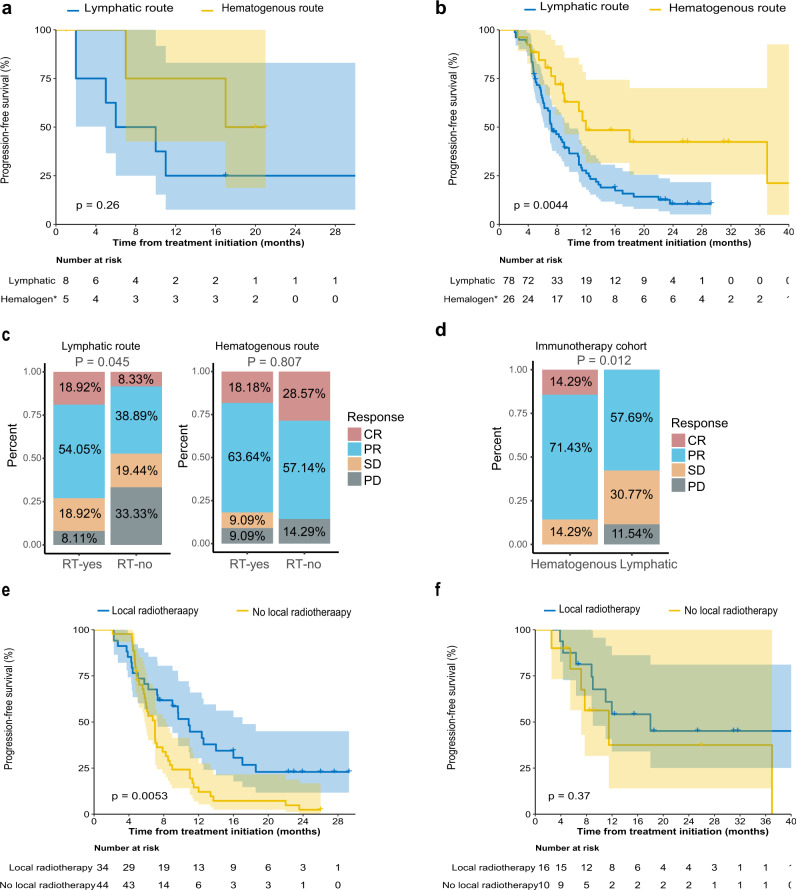
It is critical to understand factors associated with nasopharyngeal carcinoma (NPC) metastasis. To track the evolutionary route of metastasis, here we perform an integrative genomic analysis of 163 matched blood and primary, regional lymph node metastasis and distant metastasis tumour samples, combined with single-cell RNA-seq on 11 samples from two patients. The mutation burden, gene mutation frequency, mutation signature, and copy number frequency are similar between metastatic tumours and primary and regional lymph node tumours. There are two distinct evolutionary routes of metastasis, including metastases evolved from regional lymph nodes (lymphatic route, 61.5%, 8/13) and from primary tumours (hematogenous route, 38.5%, 5/13). The hematogenous route is characterised by higher IFN-γ response gene expression and a higher fraction of exhausted CD8+ T cells. Based on a radiomics model, we find that the hematogenous group has significantly better progression-free survival and PD-1 immunotherapy response, while the lymphatic group has a better response to locoregional radiotherapy.


Conflict of interest statement

The authors declare no competing interests.

Figures

Fig. 1
Fig. 1. Genomic landscape of NPC primary and metastatic tumours.
a Site distribution of the sequenced samples. The number of samples from each site is shown in brackets. b The sequencing strategy across all samples. c An overview of somatic mutations detected in primary tumour, regional lymph node metastasis and distant metastasis samples. The top panel shows the total mutations for each sample. The middle panel shows the mutation details for putative driver genes. The significantly mutated genes evaluated by MutSigCV are shown in blue, and the genes with significantly different frequencies in primary tumours and regional lymph node or distant metastasis are marked with asterisks (Pri vs. Lyn in yellow and Pri vs. Met in red). Clinical information is shown in the bottom panel. d The CNV landscape of primary tumour, regional lymph node metastasis and distant metastasis samples. The height of each bar refers to the G-score. Important frequently altered genes are highlighted. Source data are provided as a Source Data file.
Fig. 2
Fig. 2. Driver events during NPC metastasis.
a Scatter plot indicating different variant groups during metastasis. Each variant is measured by CCFs in the primary tumour and distant metastasis from the same patient. The colour range reflects the mutation density. Red circles, founding variants that are clonal both before and after metastasis; purple circles, selected variants that are undetectable or subclonal before metastasis but clonal after metastasis; blue circles, unselected variants that are clonal or subclonal before metastasis and undetectable after metastasis; and green circles, novel variants that are subclonal after metastasis but undetectable before metastasis. Predicted driver genes harbouring SSNVs are marked. b Reactome pathway enrichment of mutated genes in the “selected” group. c Distribution of variant groups during metastasis according to key NPC CNVs. Only selected CNVs are shown, and the number of selected CNVs was annotated. d Distribution of variant groups during progression according to the key CNVs between paired primary tumours and residual tumour after treatment. The number of selected variants is annotated. e Distribution of variant groups during progression according to key variants, including SSNVs and CNVs, between paired primary tumour samples and posttreatment progressed metastatic samples. f The evolutionary landscape of P32. The left panel shows the phylogenetic tree with the key variants highlighted. The right panel shows the subclone-based evolution architecture of each sample and their sampling transect, which reflects the proportion of each subclone at the time of sampling. g Dynamic subclone-based evolution architecture of P32 plotted using TimeScape, with the proportion of each cluster at the time of sampling annotated. Source data are provided as a Source Data file.
Fig. 3
Fig. 3. “Lymphatic” and “hematogenous” evolution pattern of NPC metastases indicated from genome sequencing data.
a Schematic diagram illustrating the classification of distant metastases into lymphatic or hematogenous evolution patterns. b Bootstrap values reflecting the evolutionary pattern confidence for each distant metastasis in 15 patients with matched primary, regional lymph node metastasis and distant metastasis samples before treatment. Samples with both probabilities less than 75% (P05Met, P06Met), as indicated by the dashed lines, were too ambiguous for classification and were removed in downstream analysis. c, d Typical examples of lymphatic (c) and hematogenous (d) models. Left: Phylogenetic tree with bootstrap values for each divergence node. Right: Subclone-based evolution analysis revealed the same pattern as the phylogenetic tree. Each colour of the bell plot represents a specific subclone. For the lymphatic pattern, one or more subclones found in the distant metastasis could also be found in the regional lymph node metastasis instead of the primary tumour. Otherwise, this kind of cluster is not found in the hematogenous evolution pattern. The CCF value of each subclone in each sample at the time of sampling is marked in the bell plot. eg Distant metastases show consistent evolutionary patterns revealed by patients with multiregion or multiorgan distant metastases. All distant metastases from P07 and P14 are classified as the lymphatic route (e, f), and all distant metastases from P15 are classified as the hematogenous route (g). Source data are provided as a Source Data file.
Fig. 4
Fig. 4. Lymphatic and hematogenous evolution models revealed by scRNA-seq.
a The t-SNE plot showing the unsupervised clustering results with cell types annotated. b The t-SNE plot showing the sample locations of single cells from P14. c The t-SNE plot showing the sample locations of single cells from P15. d, e Pseudotime trajectory analysis of tumour cells from P14 (d) and P15 (e). The left panel shows the t-SNE plot of tumour cells coloured according to the sample locations, the middle panel shows the evolutionary trajectory of tumour cells, and the right panel shows the corresponding phylogenetic tree. Source data are provided as a Source Data file. Pri, LLN, RLN, ILN, LALN, and RALN: primary tumour, left regional lymph nodes, right regional lymph nodes, inguinal lymph nodes, left axillary lymph nodes and right axillary lymph nodes, respectively.
Fig. 5
Fig. 5. Molecular characteristics of the lymphatic and hematogenous evolutionary modes.
a Mutation signature profile of trunk mutations in samples with the lymphatic pattern (n = 8) and the hematogenous pattern (n = 5). The y-axis shows the contribution of each signature. In each box plot, the centre line represents the median, the bounds represent the first and third quartiles, and whiskers extend from the hinge to the largest value no further than 1.5 × interquartile range (IQR) from the hinge. After adjusting for age, gender and tumour stage by using covariance analysis model, the Wilcoxon signed-rank test (two-sided) was used to calculate the P values. b Scatter plots showing the selection pattern of all mutations during metastasis in the lymphatic (left) and hematogenous (right) routes according to the comparison of the CCF for each variant between primary (x-axis) and metastatic (y-axis) tumours. The colour range reflects the mutation density in the scatter plot. The circle box indicates the selected mutations with the numbers of selected mutations marked. c Hallmark GSEA of lymphatic vs. hematogenous primary tumour using bulk RNA-seq data. d Hallmark GSEA of P14 primary tumour cells vs. P15 primary tumour cells using scRNA-seq data. An empirical phenotype-based permutation test (two-sided) was used to calculate the P value and false discovery rate (FDR). e Heatmap showing the differentially expressed genes among different CD8+ T-cell subclusters from primary tumours. Information on the clusters and patient-of-origin is shown at the top. f The t-SNE projection of CD8+ T cells from primary tumour, with cells coloured based on the unsupervised clustering results. The statistical significance of the difference in the proportion of each cell type between P14 and P15 was measured using Fisher’s exact test (two-sided) and is marked in the figure legend (“*”, P < 0.05; “**”, P < 0.01; “***”, P < 0.001). g Pie charts showing fractions of CD8+ T-cell subclusters for P14 (left) and P15 (right). h Infiltration of exhausted CD8+ T cells enriched in the microenvironment of the hematogenous route. Independent experiments were conducted in patients with clear metastatic route classification (n = 13). Representative multiplex immunohistochemistry (IHC) staining images of CXCL13+ TIM3+ CD8+ T cells in the lymphatic route (P02 & P14) and hematogenous route (P04 & P15). Scale bar, 100 μm. Source data are provided as a Source Data file.
Fig. 6
Fig. 6. Imaging characteristics distinguished the lymphatic metastatic pattern from the hematogenous metastatic pattern.
a Box plot shows the longest diameter of the primary tumour in the axial (left), coronal (middle) and sagittal views (right) in the lymphatic (n = 8) and the hematogenous (n = 5) models. In each box plot, the centre line represents the median, the bounds represent the first and third quartiles and whiskers extend from the hinge to the largest value no further than 1.5 × interquartile range (IQR) from the hinge. The Wilcoxon signed-rank test (two-sided) was used to calculate the P values; “*”P < 0.05. b, c Box plot shows the number of lower cervical lymph nodes (b) and bone metastasis lesions (c) in the lymphatic (n = 8) and hematogenous (n = 5) models. In each box plot, the centre line represents the median, the bounds represent the first and third quartiles and whiskers extend from the hinge to the largest value no further than 1.5 * interquartile range (IQR) from the hinge. The Wilcoxon signed-rank test (two-sided) was used to calculate the P values. “*”p < 0.05. d, e Positron emission tomography-computed tomography (PET-CT) images of the primary tumour (left), regional lymph node metastasis (middle) and bone metastasis (right) in the lymphatic (d) and hematogenous (e) models. The red dashed circle indicates tumour location. f The t-SNE plot shows the unsupervised clustering results of radiomics features of patients in the lymphatic and hematogenous models. g Phylogenetic tree with the bootstrap value on each divergence node showed the evolutionary route of patients without complete matched primary, regional lymph node metastasis and distant metastasis samples before treatment. The radiomics prediction model classifies patients with metastatic tumour after treatment into the lymphatic (left) and hematogenous (right) groups. h GSEA of radiomics model-predicted lymphatic vs. hematogenous primary tumour using bulk RNA-seq data. i Radiomics prediction model results and phylogenetic trees for newly collected patients to further validate the radiomics prediction model. *P: progressed samples after treatment. Source data are provided as a Source Data file.
Fig. 7
Fig. 7. Different clinical outcomes between the “lymphatic” and “hematogenous” metastatic routes.
a Kaplan‒Meier curves of progression free survival (PFS) in the 13 NPC with identified metastatic models via genomic phylogenetic tree. The data are shown along with 95% confidence intervals. The log-rank test was used to calculate the P value (two-sided). b Kaplan‒Meier curves of PFS comparing the radiomics-predicted lymphatic and hematogenous metastatic models in the de novo metastatic NPC cohort. The data are shown along with 95% confidence intervals. The log-rank test was used to calculate the P value (two-sided). c Bar plot showing the different treatment response rates between patients who received locoregional radiation therapy and those who did not in the primary diagnosed metastatic NPC cohort in the lymphatic (left) and hematogenous (right) models. RT: radiation therapy. d Bar plot showing the different response rates to combination immunotherapy between the lymphatic and hematogenous groups in the immunotherapy NPC cohort. e, f Kaplan‒Meier curves of PFS between metastatic patients who received local radiotherapy and those who did not receive local radiotherapy in patients with metastases emerging via the lymphatic route (e) or the hematogenous route (f). The data are shown along with 95% confidence intervals. The log-rank test was used to calculate the P value (two-sided).

References

    1. Chen YP, et al. Nasopharyngeal carcinoma. Lancet (Lond., Engl.) 2019;394:64–80. - PubMed
    1. Lee AW, et al. Retrospective analysis of 5037 patients with nasopharyngeal carcinoma treated during 1976-1985: overall survival and patterns of failure. Int. J. Radiat. Oncol., Biol., Phys. 1992;23:261–270. - PubMed
    1. Mickisch GH, Garin A, van Poppel H, de Prijck L, Sylvester R. Radical nephrectomy plus interferon-alfa-based immunotherapy compared with interferon alfa alone in metastatic renal-cell carcinoma: a randomised trial. Lancet. 2001;358:966–970. - PubMed
    1. You R, et al. Efficacy and safety of locoregional radiotherapy with chemotherapy vs chemotherapy alone in de novo metastatic nasopharyngeal carcinoma: a multicenter phase 3 randomized clinical trial. JAMA Oncol. 2020;6:1345–1352. - PMC - PubMed
    1. Cohen EE, et al. A feed-forward loop involving protein kinase Calpha and microRNAs regulates tumor cell cycle. Cancer Res. 2009;69:65–74. - PMC - PubMed

Publication types

MeSH terms