. 2023 Apr 1:269:119926.
doi: 10.1016/j.neuroimage.2023.119926. Epub 2023 Feb 3.

Reduced emergent character of neural dynamics in patients with a disrupted connectome

Affiliations

Reduced emergent character of neural dynamics in patients with a disrupted connectome

Andrea I Luppi et al. Neuroimage. .

Abstract

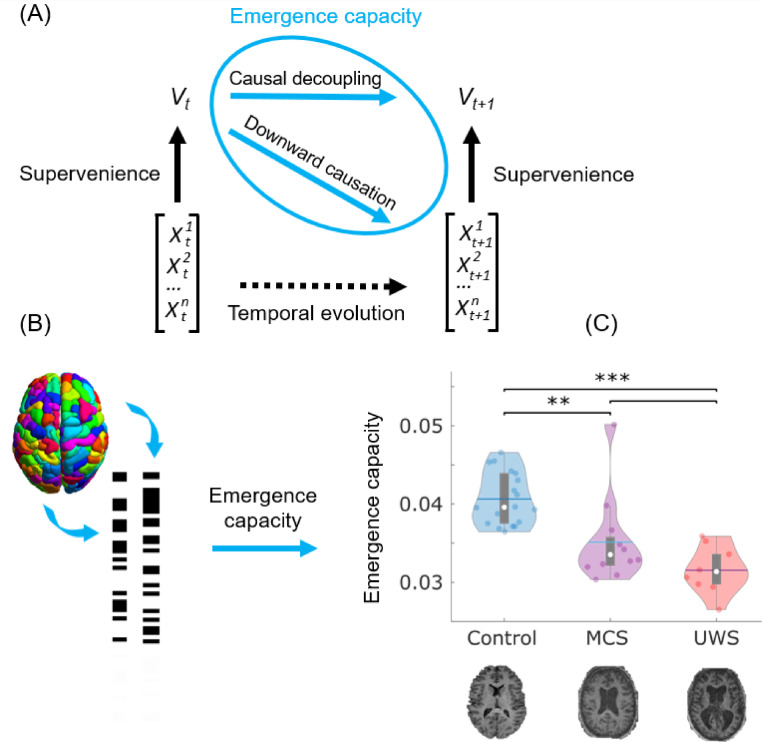
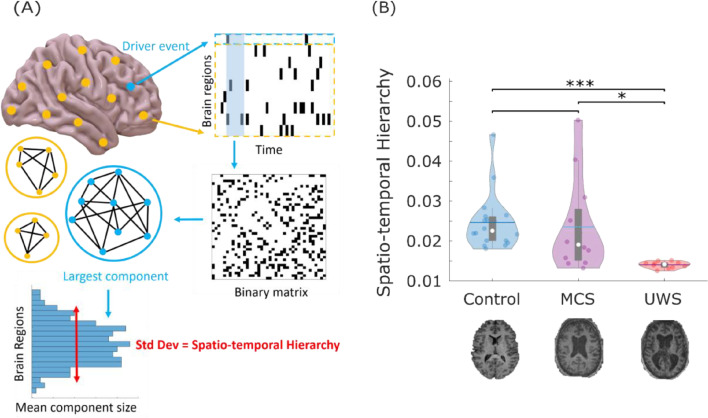
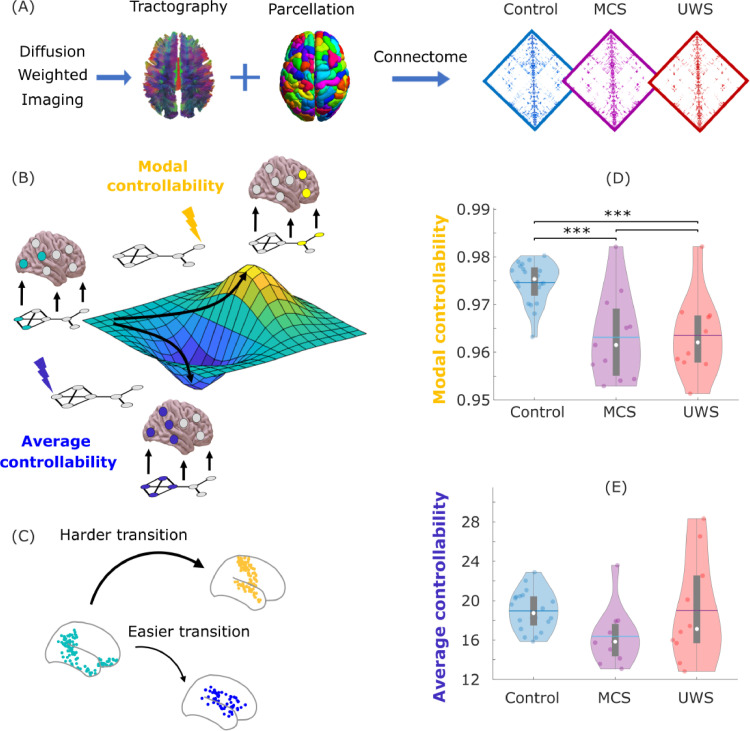
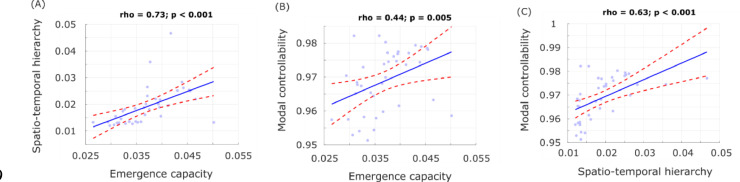
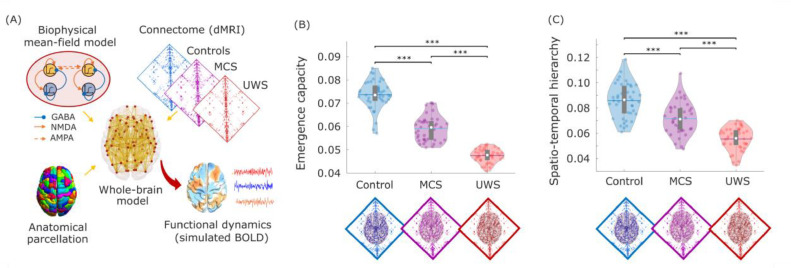
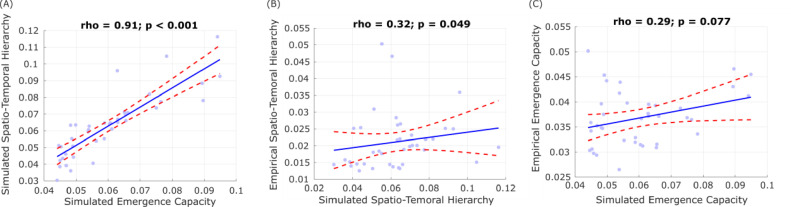
High-level brain functions are widely believed to emerge from the orchestrated activity of multiple neural systems. However, lacking a formal definition and practical quantification of emergence for experimental data, neuroscientists have been unable to empirically test this long-standing conjecture. Here we investigate this fundamental question by leveraging a recently proposed framework known as "Integrated Information Decomposition," which establishes a principled information-theoretic approach to operationalise and quantify emergence in dynamical systems - including the human brain. By analysing functional MRI data, our results show that the emergent and hierarchical character of neural dynamics is significantly diminished in chronically unresponsive patients suffering from severe brain injury. At a functional level, we demonstrate that emergence capacity is positively correlated with the extent of hierarchical organisation in brain activity. Furthermore, by combining computational approaches from network control theory and whole-brain biophysical modelling, we show that the reduced capacity for emergent and hierarchical dynamics in severely brain-injured patients can be mechanistically explained by disruptions in the patients' structural connectome. Overall, our results suggest that chronic unresponsiveness resulting from severe brain injury may be related to structural impairment of the fundamental neural infrastructures required for brain dynamics to support emergence.

Keywords: Disorders of consciousness; Emergence; Hierarchy; Information decomposition; Network control theory; Whole-brain modelling.


Conflict of interest statement

Declaration of Competing Interest The authors declare no competing interests.

Figures

Fig 1
Fig. 1
Causal emergence is diminished in the brain dynamics of DOC patients. (A) Relationship between emergence and supervenience. A macroscale feature Vt of a system is supervenient on the state of the system at time t, denoted by Xt, if Vt is fully determined by Xt (beyond the addition of noise), such that anything about Vt that can be predicted from the system's previous state, Xt1 can also be predicted from the system's current state, Xt. Then, a supervenient feature Vt  is said to be causally emergent if it has “unique” predictive power over the future evolution of the system Xt— in the sense of providing information about the dynamics of the system that cannot be found in any of the parts of the system when considered separately. The two components of emergence capacity are causal decoupling, the unique predictive power of Vt on Vt+1corresponding to the system's macroscale influencing the macroscale's future;  and downward causation, the unique predictive power of  Vt on Xt+1i.e. the macroscale influencing the microscale.  (B) The global emergence capacity of the human brain is obtained from Integrated Information Decomposition as the average emergence capacity (downward causation + causal decoupling) between each pair of discretised regional fMRI BOLD signals (Methods and Fig. S1). (C) Violin plots of each subject's emergence capacity by group. Data points represent subjects. White circle, median; centre line, mean; box limits, upper and lower quartiles; whiskers, 1.5x interquartile range. ** p < 0.01; *** p < 0.001, FDR-corrected. Here we used a time-step of 1 TR (2 s), the fastest available for our functional MRI data. No significant difference was observed when using a slower timescale of 4 TRs. We also show that analogous results are obtained using continuous (rather than discretised) signals (Fig. S3A), and using a different information-theoretic formalism (Methods and Fig. S3B), with UWS patients exhibiting significantly lower emergence capacity than healthy controls in both cases. We found that differences in emergence capacity can be attributed to downward causation (Fig. S4), rather than causal decoupling (all p > 0.05): that is, the overall difference in emergence capacity is primarily accounted for by the effects of the macroscale on the microscale.
Fig 2
Fig. 2
Spatio-temporal hierarchy of intrinsic-driven ignition is compromised in DOC patients. (A) intrinsic-driven ignition is obtained by identifying “driver events” (unusually high BOLD spontaneous activity; here, an event is defined to occur at a given region when its BOLD signal exhibits a Z-score larger than 1, following previous work (Deco et al., 2017; Deco and Kringelbach, 2017)), and measuring the magnitude of the concomitant activity occurring in the rest of the brain within a short time window (here, 4 TRs, approximately corresponding to the duration of the hemodynamic response function, following previous work (Deco et al., 2017; Deco and Kringelbach, 2017)). By the term “event” we refer to each regional occurrence of threshold-crossing; so if two regions cross the threshold within the same BOLD volume, then two events are occurring. The level of intrinsic-driven ignition is calculated as the size of the resulting largest connected component over a network linking regions that exhibit co-occurring events within the chosen time window. A measure of spatio-temporal hierarchy is obtained by calculating the variability across regions of their average IDI. (B) Violin plots of each subject's spatio-temporal hierarchy by group, showing that UWS patients exhibit diminished hierarchy compared with both healthy controls and MCS patients. Data points represent subjects. White circle, median; centre line, mean; box limits, upper and lower quartiles; whiskers, 1.5x interquartile range. * p < 0.05; ** p < 0.01, FDR-corrected.
Fig 3
Fig. 3
Reduced controllability of structural brain networks in DOC patients. (A) To obtain the structural connectome, diffusion weighted imaging (which measures the direction of water diffusion in the brain) is used to reconstruct white matter streamlines through tractography algorithms, obtaining a network representation of the physical connections between brain regions (here, N = 234 regions from the Lausanne atlas). The average structural networks for each group (control, MCS and UWS) are shown. (B) Functional brain activity (colored nodes are active, grey nodes are inactive) evolves through time over a fixed network structure (displayed below the brains). From a given starting configuration of activity (green), some alternative configurations are relatively easy to reach in the space of possible configurations (valley, in blue), whereas others are relatively difficult to achieve (peak, in yellow). To achieve a desired target configuration, input energy (represented by the lightning bolt icons) can be injected locally into the system, and it will spread to the rest of the system based on its network organisation. Average controllability quantifies the network's support for moving the system from an initial configuration of activity (green) to easy-to-reach configurations (blue), whereas modal controllability quantifies the network's support for moving the system to difficult-to-reach configurations of activity (yellow). (C) Example of easier and harder transitions from the literature (Karrer et al., 2020): starting from a baseline state corresponding to activation of the default mode network regions (green), previous work has shown that under the framework of linear network control theory it is easier to transition to activation of the limbic network regions (blue) than of the somatomotor network regions (yellow). (D) Global modal controllability is significantly reduced in DOC patients. Data points represent subjects. (E) Global average controllability across each group. White circle, median; center line, mean; box limits, upper and lower quartiles; whiskers, 1.5x interquartile range. *** p < 0.001, FDR-corrected.
Fig 4
Fig. 4
Functional and structural properties of the brain are correlated across subjects. Plots show Spearman's rank-based correlation tests between each pair of structural and functional measures that had exhibited significant differences across DOC patients and controls. Each data-point represents one subject (note that the two healthy controls and one DOC patient who did not have both structural and functional data were not included in this analysis).
Fig 5
Fig. 5
Whole-brain models informed by empirical connectomes replicate empirical changes in brain dynamics. (A) Overview of the whole-brain modelling approach to investigate structure-function relationships. The whole-brain model is based on local biophysical models of excitatory and inhibitory neuronal populations, corresponding to brain regions as defined by an anatomical parcellation, interconnected by a network of structural connections obtained from diffusion MRI from each group of subjects (healthy controls, MCS and UWS patients). The whole-brain model has one free parameter, the global coupling G, which is selected as the value just before the simulated firing rate becomes unstable. (B) Emergence capacity is highest in the dynamics simulated from control connectome, in line with empirical results. (C) Spatio-temporal hierarchical character is highest in the dynamics simulated from control connectome, in line with empirical results. Each data-point corresponds to one of 40 simulations obtained from each whole-brain model. White circle, median; centre line, mean; box limits, upper and lower quartiles; whiskers, 1.5x interquartile range. *** p < 0.001, FDR-corrected.
Fig 6
Fig. 6
Correlation between empirical and simulated functional properties of the brain. Plots show Spearman's rank-based correlation tests between each pair of simulated functional measures (A), and between simulated and empirical measures (B,C).

Similar articles

Cited by

References

    1. Andellini M., Cannatà V., Gazzellini S., Bernardi B., Napolitano A. Test-retest reliability of graph metrics of resting state MRI functional brain networks: a review. J. Neurosci. Methods. 2015;253:183–192. doi: 10.1016/j.jneumeth.2015.05.020. - DOI - PubMed
    1. Avena-Koenigsberger A., Misic B., Sporns O. Communication dynamics in complex brain networks. Nat. Rev. Neurosci. 2017;19:17–33. doi: 10.1038/nrn.2017.149. - DOI - PubMed
    1. Barttfeld P., Uhrig L., Sitt J.D., Sigman M., Jarraya B., Dehaene S. Signature of consciousness in the dynamics of resting-state brain activity. Proc. Natl. Acad. Sci. 2015;112:887–892. doi: 10.1073/pnas.1418031112. - DOI - PMC - PubMed
    1. Behzadi Y., Restom K., Liau J., Liu T.T. A component based noise correction method (CompCor) for BOLD and perfusion based fMRI. NeuroImage. 2007;37:90–101. - PMC - PubMed
    1. Benjamini Y., Hochberg Y. Controlling the false discovery rate: a practical and powerful approach to multiple testing. J. R. Stat. Soc. Ser. B Methodol. 1995;57:289–300.

Publication types