. 2023 Jun;164(7):1119-1136.e12.
doi: 10.1053/j.gastro.2023.01.037. Epub 2023 Feb 4.

SOX9 Modulates the Transformation of Gastric Stem Cells Through Biased Symmetric Cell Division

Affiliations

SOX9 Modulates the Transformation of Gastric Stem Cells Through Biased Symmetric Cell Division

Qiyue Chen et al. Gastroenterology. 2023 Jun.

Abstract

Background & aims: Transformation of stem/progenitor cells has been associated with tumorigenesis in multiple tissues, but stem cells in the stomach have been hard to localize. We therefore aimed to use a combination of several markers to better target oncogenes to gastric stem cells and understand their behavior in the initial stages of gastric tumorigenesis.

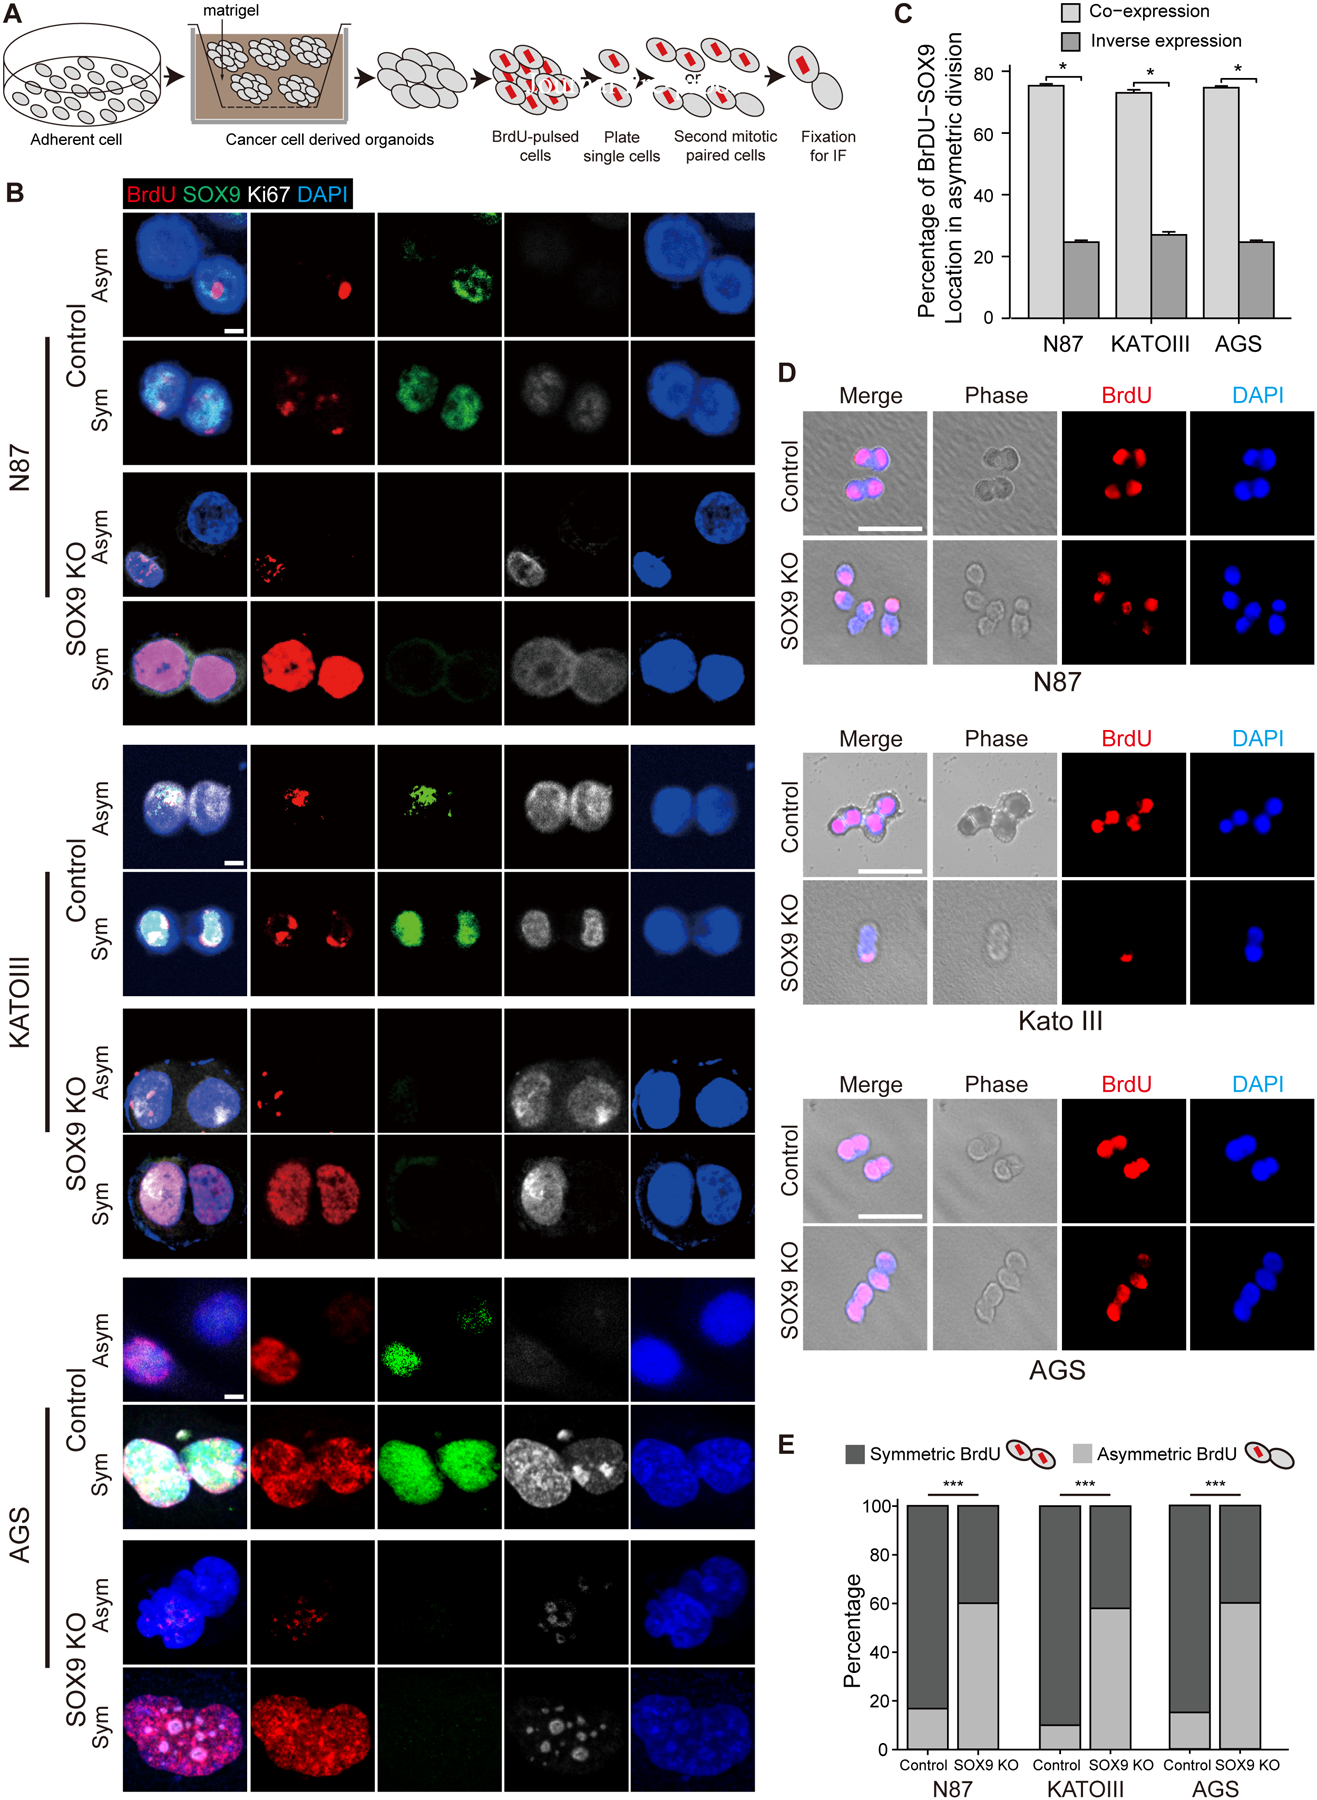
Methods: Mouse models of gastric metaplasia and cancer by targeting stem/progenitor cells were generated and analyzed with techniques including reanalysis of single-cell RNA sequencing and immunostaining. Gastric cancer cell organoids were genetically manipulated with clustered regularly interspaced short palindromic repeats (CRISPR)/CRISPR-associated protein 9 (Cas9) for functional studies. Cell division was determined by bromodeoxyuridine-chasing assay and the assessment of the orientation of the mitotic spindles. Gastric tissues from patients were examined by histopathology and immunostaining.

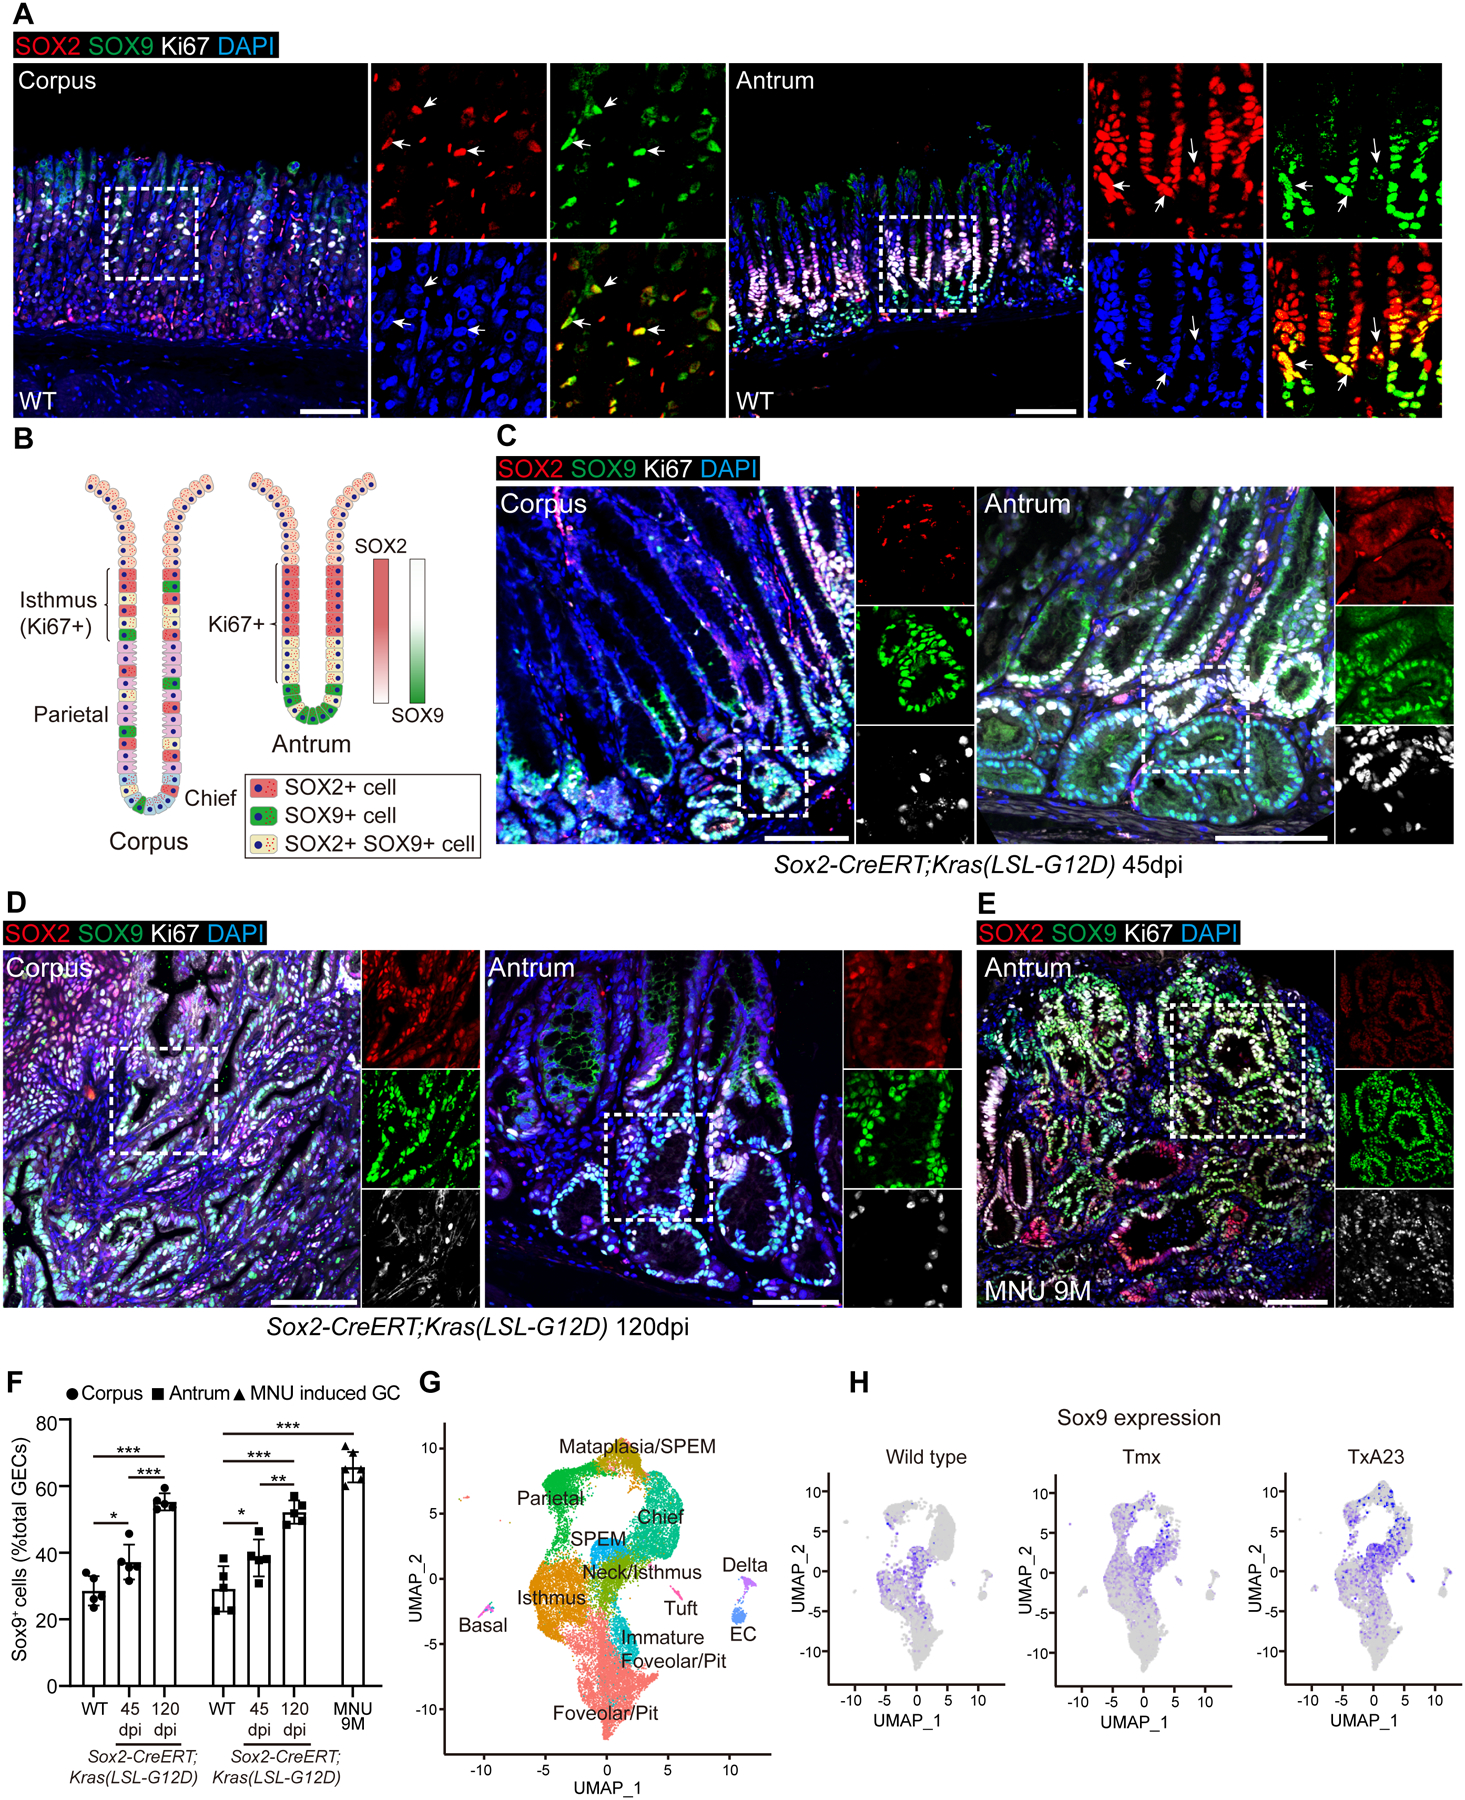
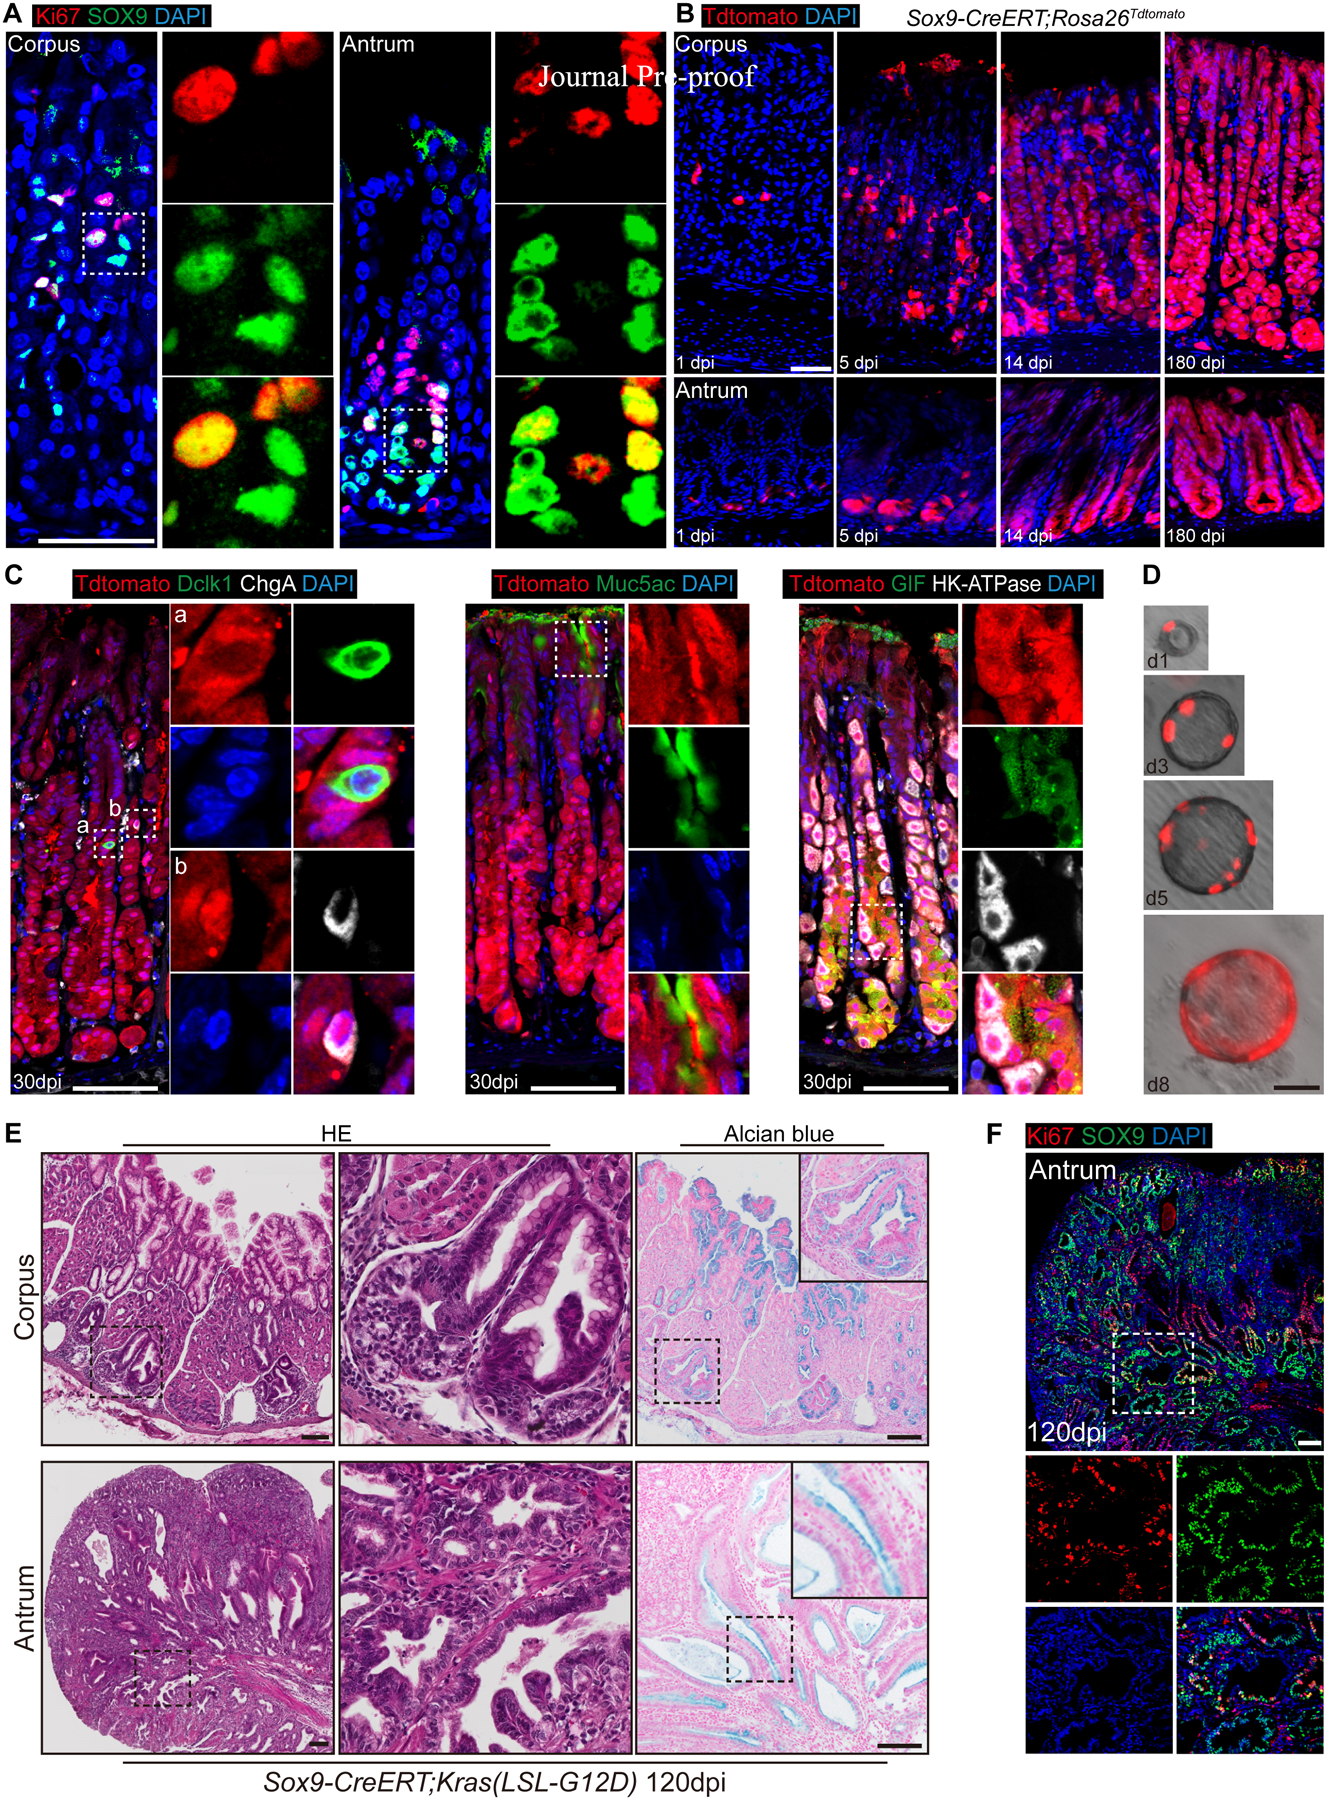
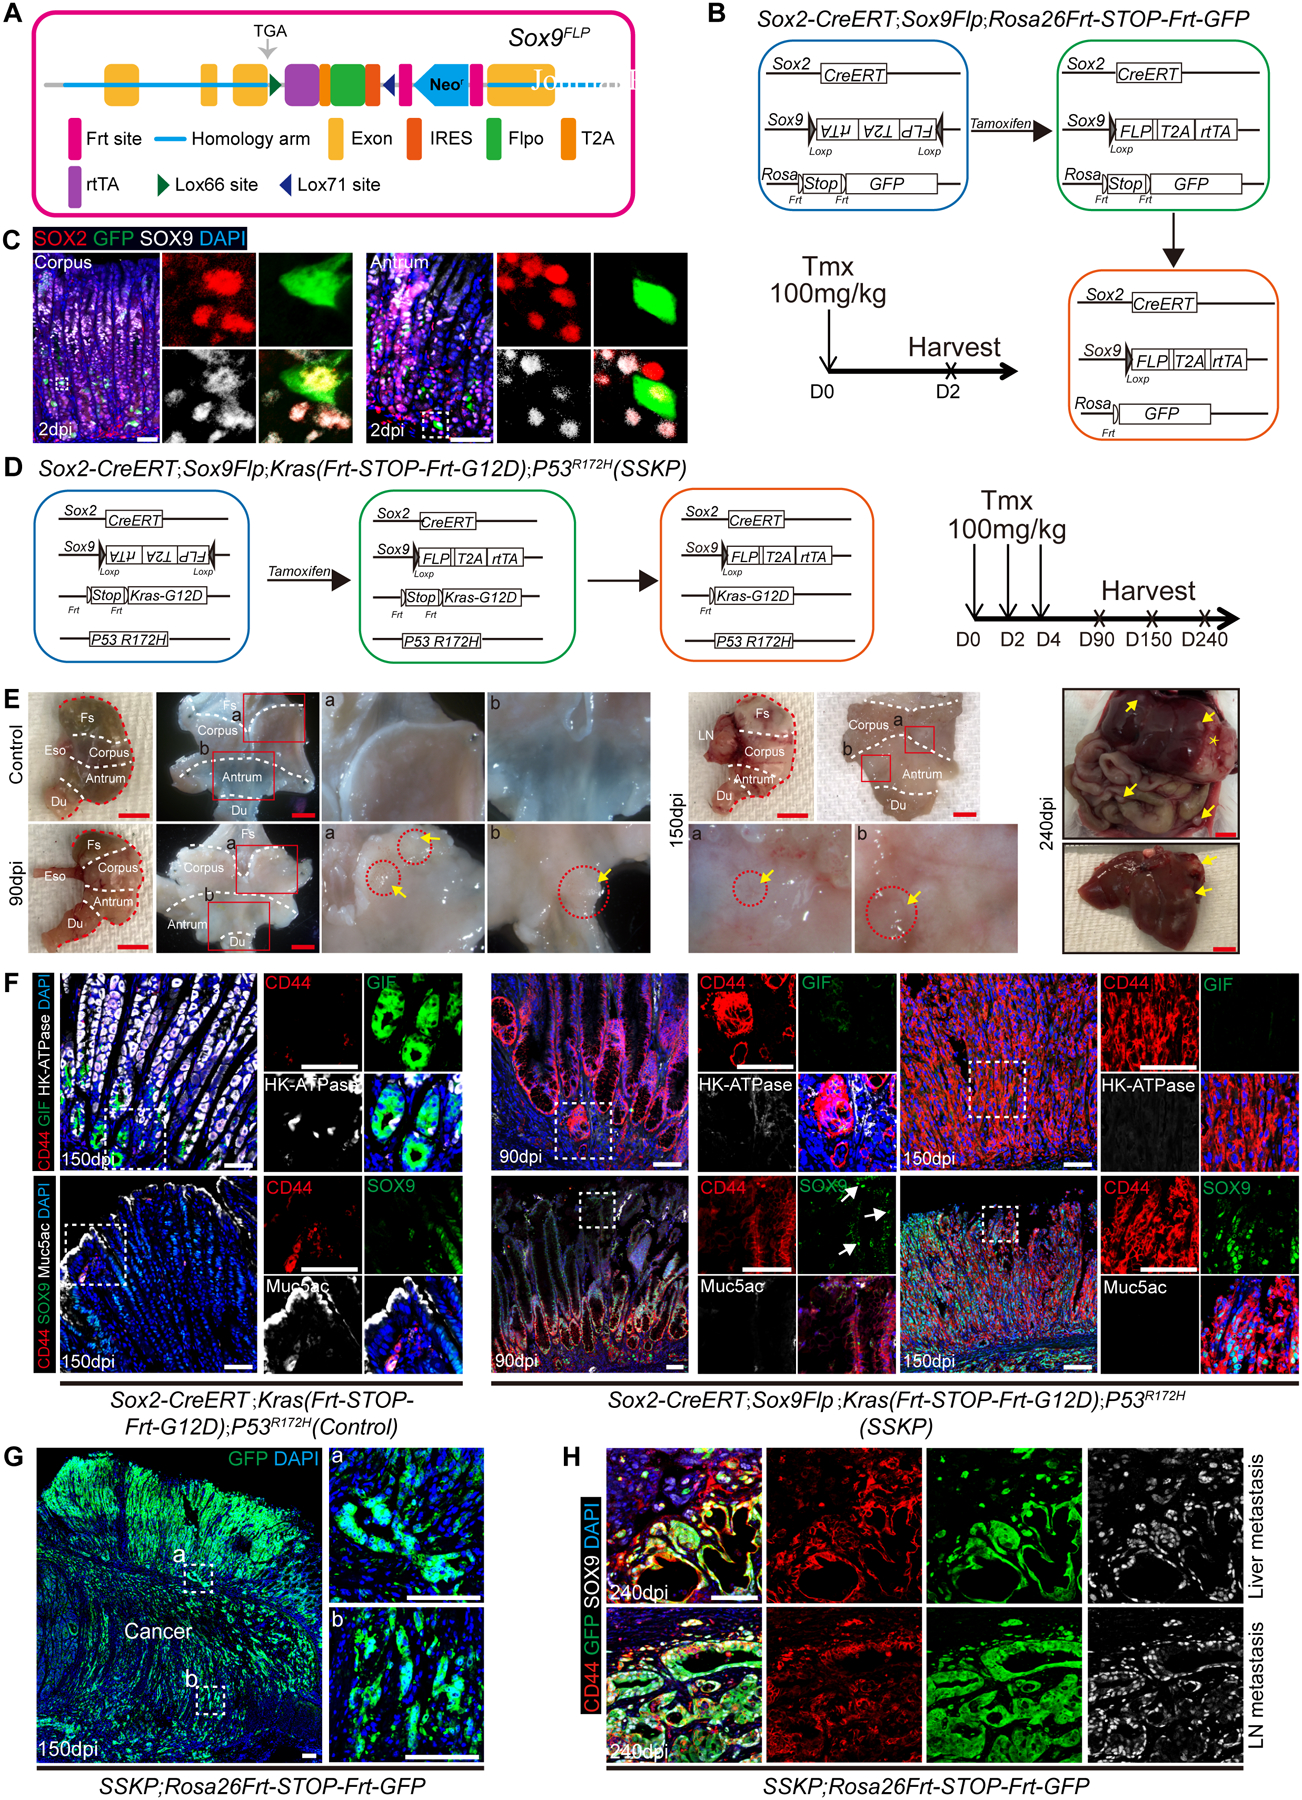
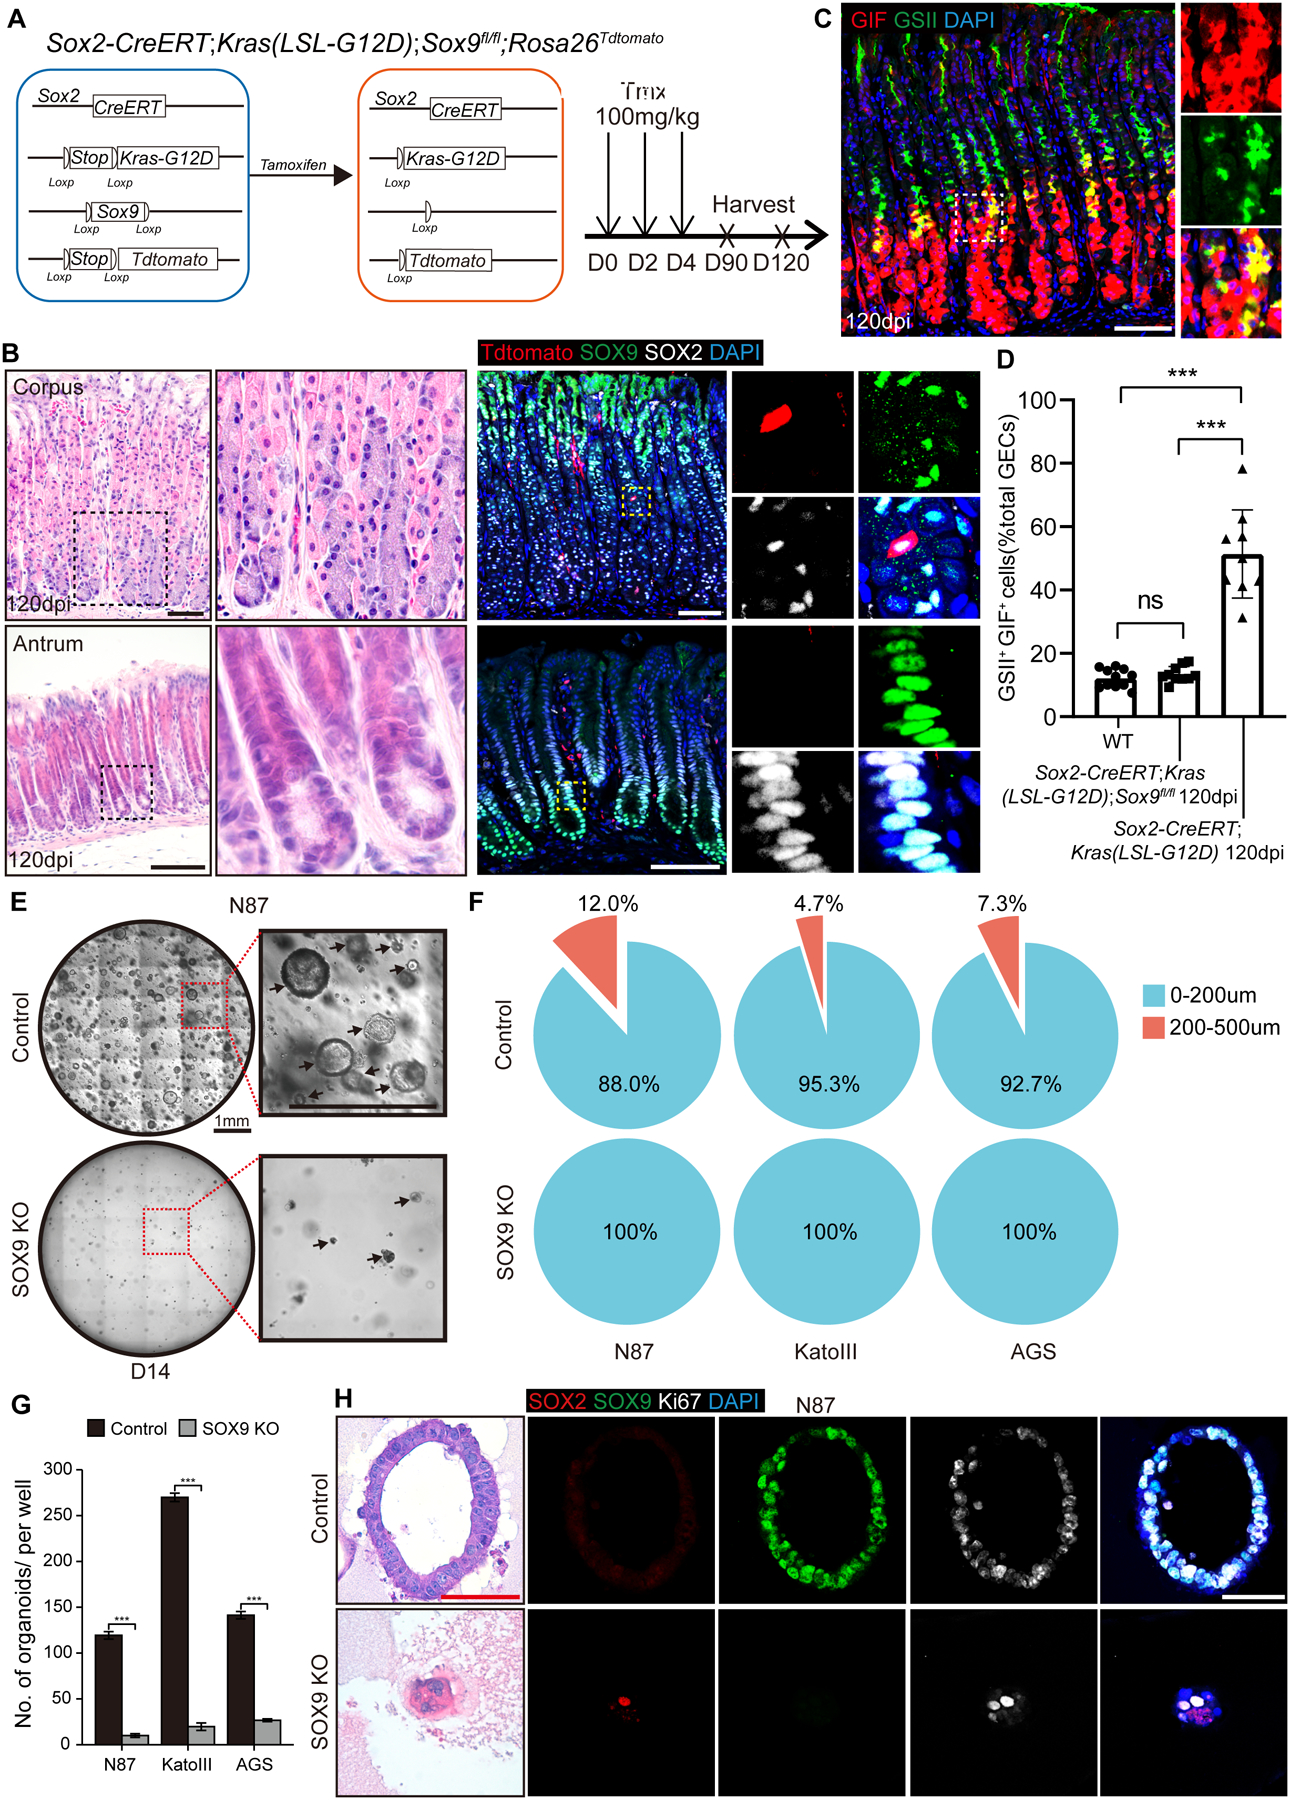
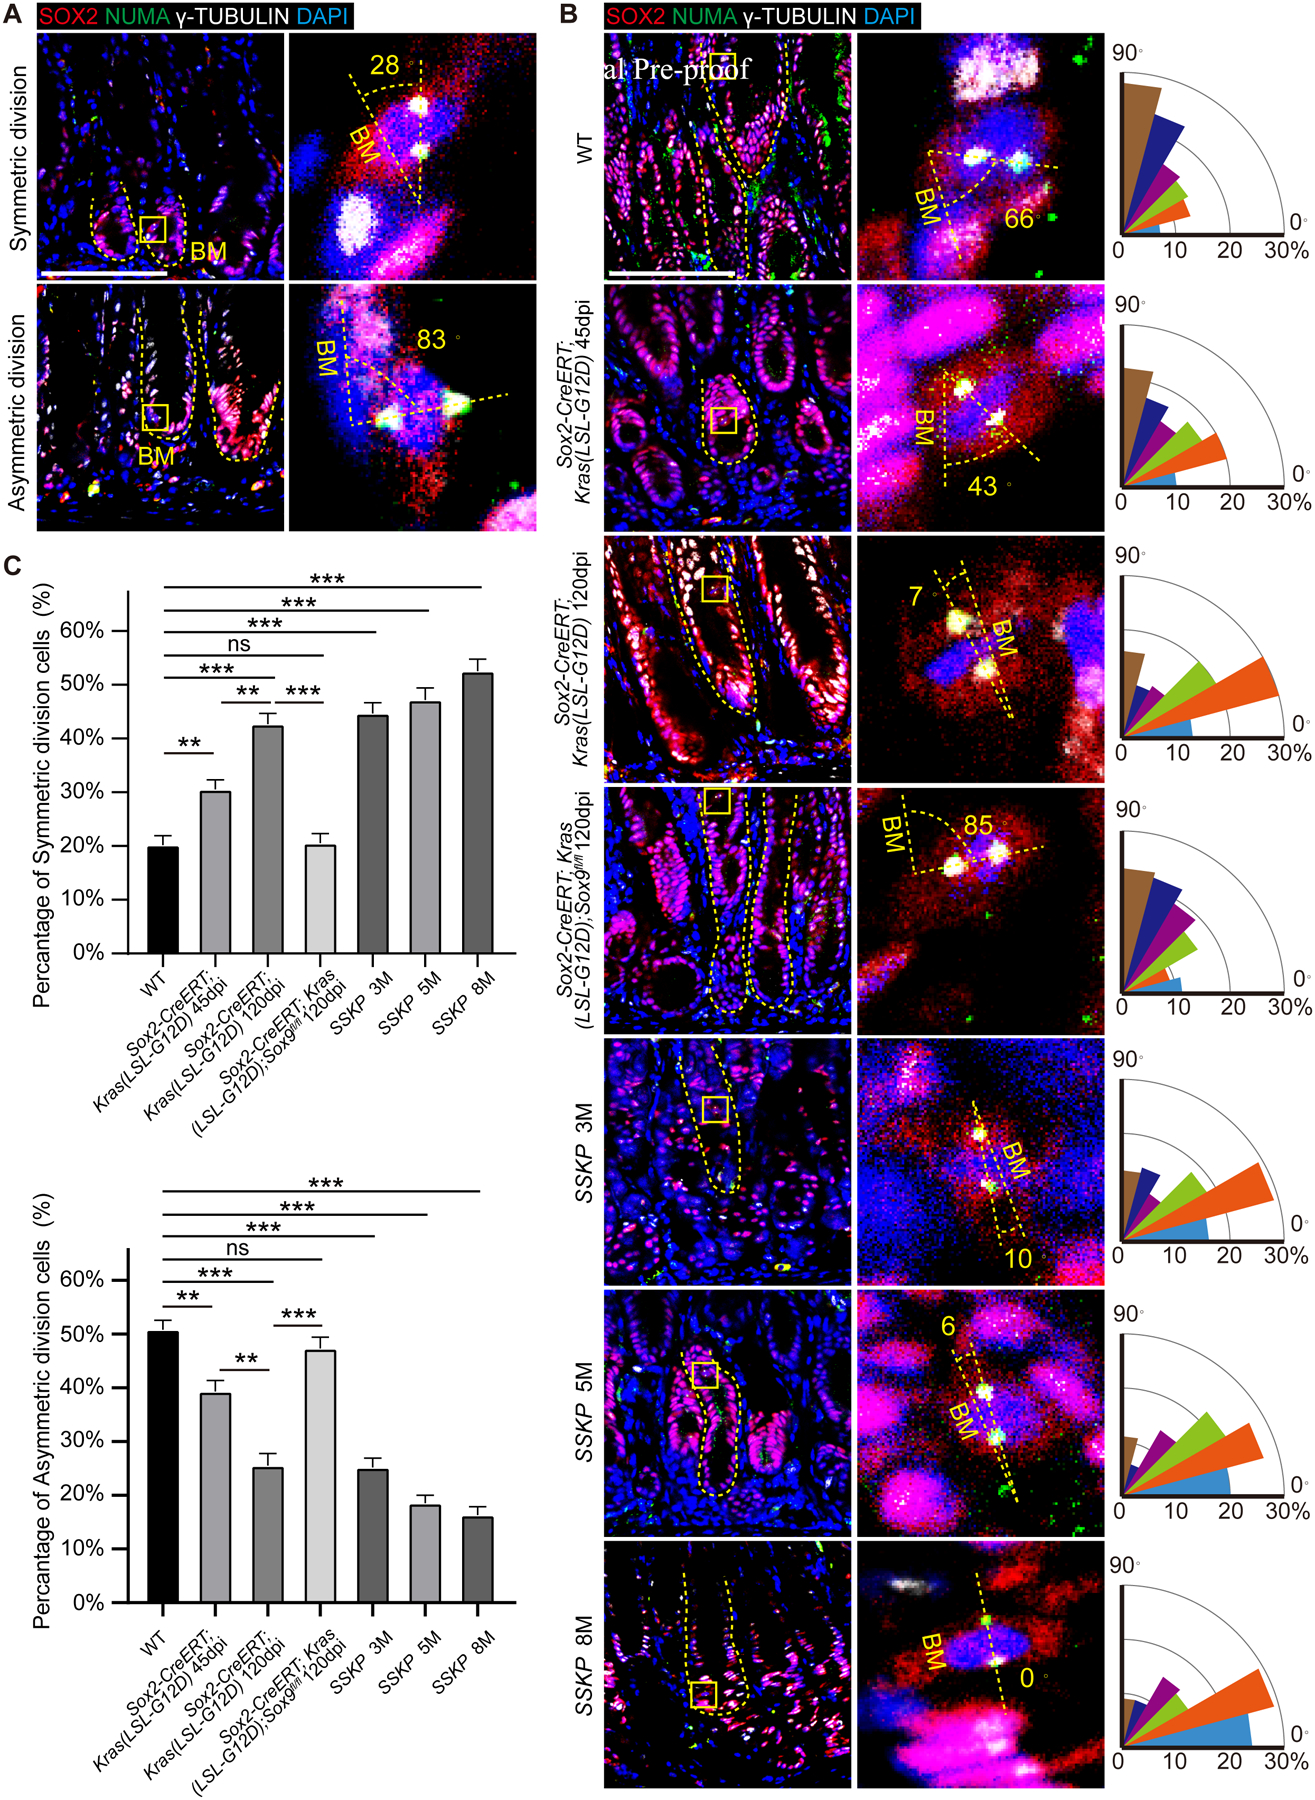
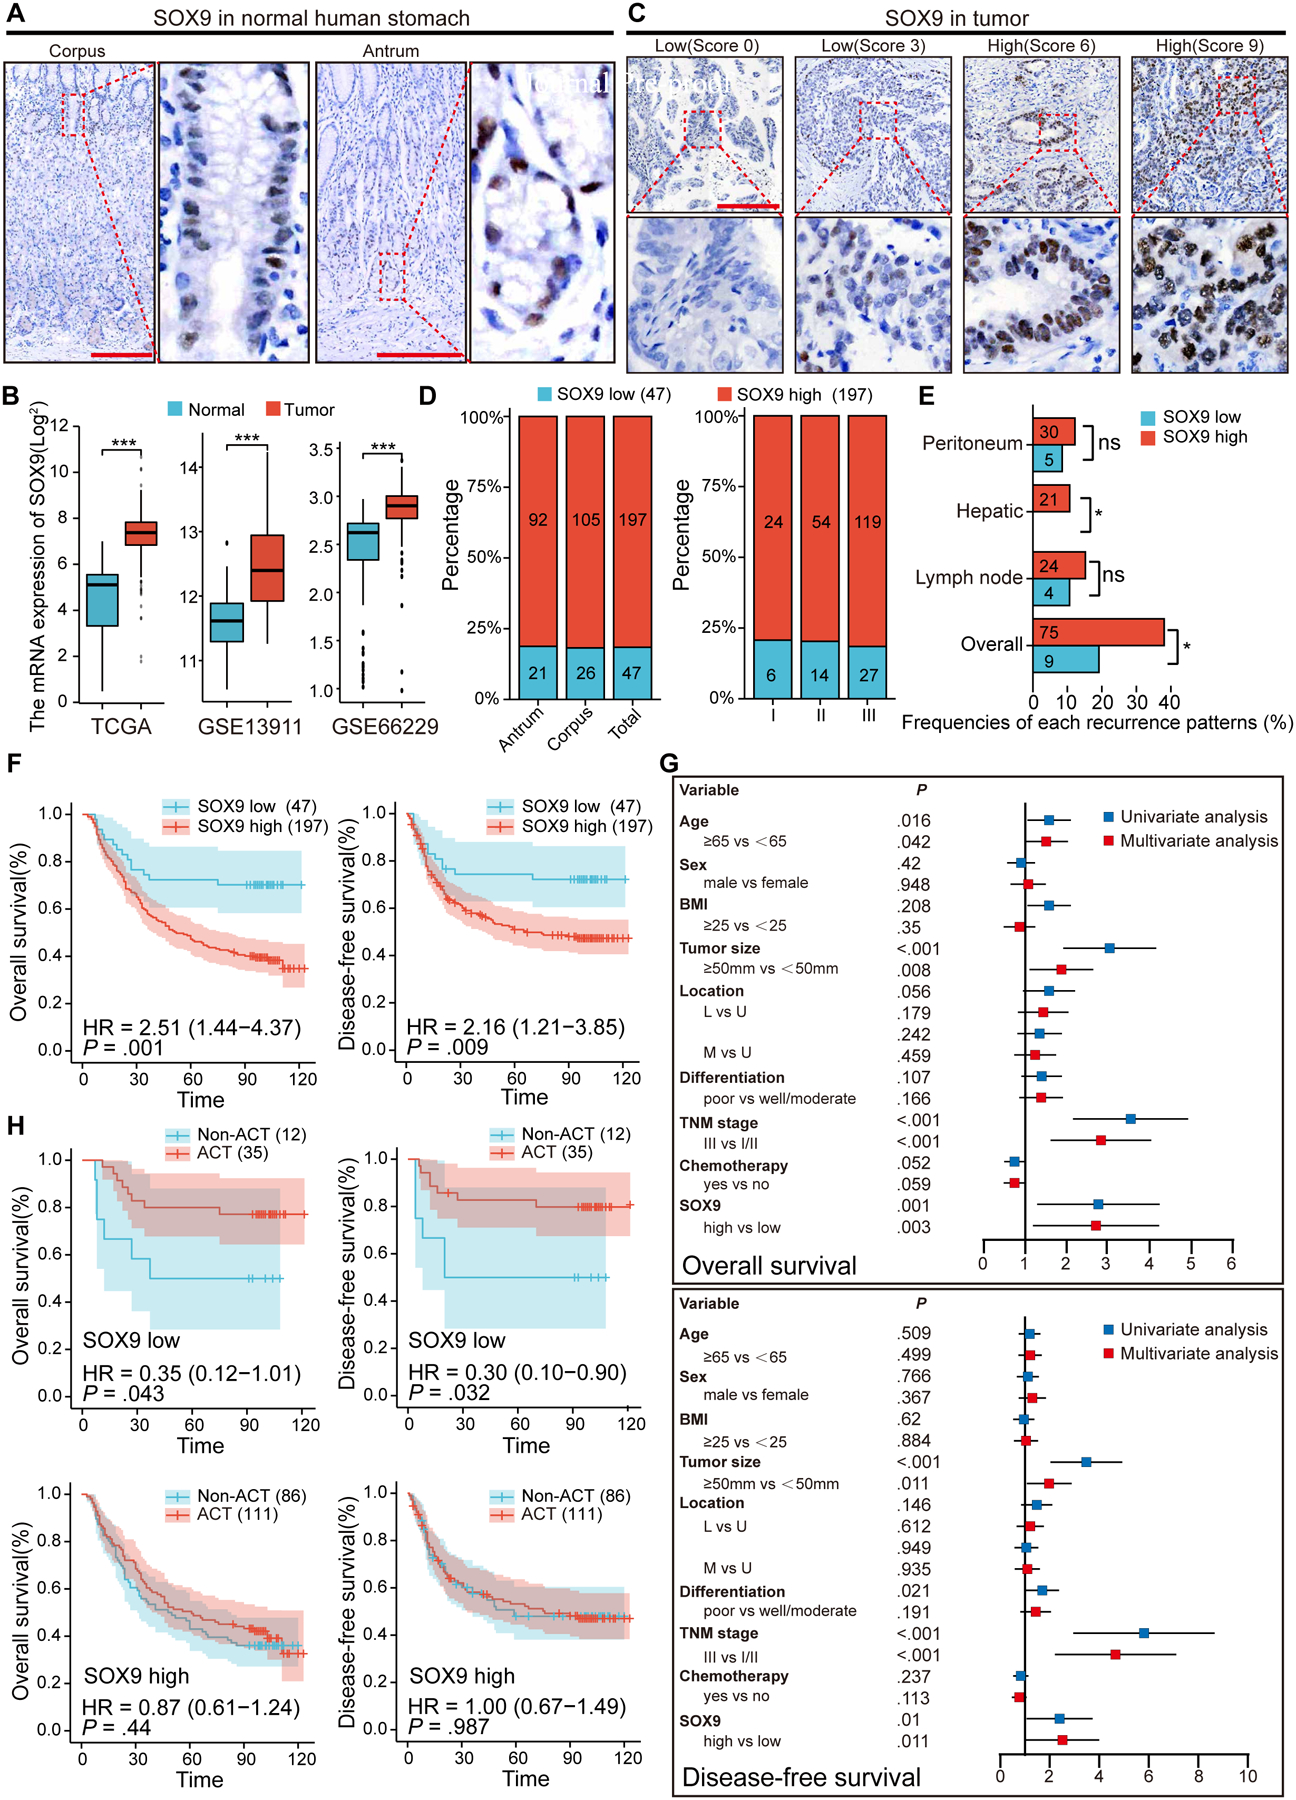
Results: Oncogenic insults lead to expansion of SOX9+ progenitor cells in the mouse stomach. Genetic lineage tracing and organoid culture studies show that SOX9+ gastric epithelial cells overlap with SOX2+ progenitors and include stem cells that can self-renew and differentiate to generate all gastric epithelial cells. Moreover, oncogenic targeting of SOX9+SOX2+ cells leads to invasive gastric cancer in our novel mouse model (Sox2-CreERT;Sox9-loxp(66)-rtTA-T2A-Flpo-IRES-loxp(71);Kras(Frt-STOP-Frt-G12D);P53R172H), which combines Cre-loxp and Flippase-Frt genetic recombination systems. Sox9 deletion impedes the expansion of gastric progenitor cells and blocks neoplasia after Kras activation. Although Sox9 is not required for maintaining tissue homeostasis where asymmetric division predominates, loss of Sox9 in the setting of Kras activation leads to reduced symmetric cell division and effectively attenuates the Kras-dependent expansion of stem/progenitor cells. Similarly, Sox9 deletion in gastric cancer organoids reduces symmetric cell division, organoid number, and organoid size. In patients with gastric cancer, high levels of SOX9 are associated with recurrence and poor prognosis.

Conclusion: SOX9 marks gastric stem cells and modulates biased symmetric cell division, which appears to be required for the malignant transformation of gastric stem cells.

Keywords: Gastric Cancer; Metaplasia; Mouse Model; Neoplasia; SOX2.


Conflict of interest statement

Declaration of interests: The authors declare that they have no competing interests.

Figures

Figure 1.
Figure 1.. Increased numbers of SOX9+ cells in the stomach of SOX2-CreERT;Kras(LSL-G12D) (Sox2Kras) mice and a chemically induced gastric cancer model.
(A) Representative images of immunofluorescence of Sox2, Sox9, Ki67 in the corpus and antrum of wildtype (WT) mice. Arrows indicate co-expression of Sox2 and Sox9. (B) Schematic depicts the expression of Sox9, Sox2 and Ki67 in the mouse stomach. (C-D) Representative images of immunofluorescence of Sox2, Sox9 and Ki67 in the corpus and antrum of Sox2Kras mice at different time points after tamoxifen administration. (E) Representative images of immunofluorescence of Sox2, Sox9 and Ki67 in the stomach of WT mice 9 months after MNU treatment. (F) Quantification of Sox9+ cells in Sox2Kras mice at different time points following tamoxifen (Tmx) administration and WT mice with 9 months of MNU treatment. (G) UMAP annotation of gastric epithelial cell types from the corpus of healthy control mice, Tmx-treated mice and TxA23 transgenic mice. (H) Expression of Sox9 transcripts in the corpus of the three groups of mice as revealed by UMAP. Data are expressed as mean ± SD. Statistical analyses used unpaired t-test or one-way ANOVA test. *p < 0.05; **p < 0.01; ***p < 0.001; n.s. no significance. Scale bars, 100 μm. See also Figure S1 and S2.
Figure 2.
Figure 2.. Gastric Sox9+ cells serve as progenitor cells during homeostasis and recommit following Kras activation.
(A) Representative images of immunofluorescence of Sox9 and Ki67 in the mouse antrum and corpus. (B) Lineage-tracing in the stomach of Sox9-CreERT; Rosa26Tdtomato mice at different time points following a single dose of tamoxifen. (C) Staining of enteroendocrine cell (ChgA+), tuft cell (Dclk1+), pit cell (Muc5AC+), parietal cell (HK-ATPase+) and chief cell (Gif+) with Tdtomato in the stomach of Sox9-CreERT;Rosa26Tdtomato mice at 30 dpi. (D) Lineage tracing of gastric organoids established by using cells isolated from the gastric tisssus of Sox9-CreERT;Rosa26Tdtomato mice 24h after Tmx induction. (E) H&E and Alcian blue staining of gastric tissues collected from Sox9-CreERT;Kras(LSL-G12D) mice at 120 dpi. The epithelium displays neoplasia in the corpus and dysplasia in the antrum. (F) The numbers of Sox9+ cells increased in the gastric tissues of Sox9-CreERT;Kras(LSL-G12D) mice examined at 120 dpi. Each group has at least three mice. Scale bar in A, B, D, 50 μm; C, E, F, 100 μm. See also Figure S3 and S4.
Figure 3.
Figure 3.. Combine Cre-loxp and Flipase (Flp)-Frt system to specifically target Sox9+ cell in the stomach.
(A) Schematic depicts the knockin allele Sox9Flp. (B) Schematic strategy depicts the generation of Sox2-CreERT;Sox9Flp;Rosa26Frt-STOP-Frt-GFP mice. (C) Expression of Sox2, Sox9 and GFP in the stomach of Sox2-CreERT;Sox9Flp;Rosa26Frt-STOP-Frt-GFP mice. (D) Schematic depicts the generation of SSKP mice. (E) Representative gross images of SSKP mouse stomach, liver and peritoneal metastasis at different time points after Tmx administration. Asterisks indicate primary tumor and arrows indicate metastatic tumor. (F) Expression of different cell markers in the stomach of SSKP and control mice at 90 and 150 dpi. Note the presence of Sox9+ cells in the pit (arrows). (G) Lineage tracing of cancer cells in the stomach of SSKP;Rosa26Frt-STOP-Frt-GFP mice at 150 dpi. (H) Metastasized cancer cells express GFP, CD44 and Sox9 in the liver and lymph node of SSKP;Rosa26Frt-STOP-Frt-GFP mice at 240 dpi. Each group includes at least three mice. Scale bar in C, F, 50 μm; E, 5 mm; G, H, 100 μm. See also Figure S4 and S5.
Figure 4.
Figure 4.. Sox9 is essential for the formation of precancer lesion and gastric cancer organoid.
(A) Schematic depicts the generation of Sox2-CreERT;Kras(LSL-G12D);Sox9fl/fl; Rosa26Tdtomato mice. (B) H&E staining and lineage tracing in the stomach of Sox2-CreERT;Kras(LSL-G12D);Sox9fl/fl mice at 120 dpi. (C) Co-localization of the metaplasia markers GSII and GIF in the stomach of Sox2-CreERT;Kras(LSL-G12D);Sox9fl/fl mice at 120 dpi. (D) Quantification of GSII+GIF+ cells in the stomach of WT, Sox2-CreERT;Kras(LSL-G12D);Sox9fl/fl and Sox2-CreERT;Kras(LSL-G12D) mice at 120 dpi (n=7 per group). (E) Organoids formed by N87 gastric cancer cells with/without SOX9 deletion. Arrows indicate organoids. (F-G) Reduced numbers and diameters of organoids formed by gastric cancer cell lines with SOX9 deletion. (H) H&E staining and expression of SOX2, SOX9 and Ki67 in the organoids formed by N87 gastric cancer cells with/without SOX9. Data are expressed as mean ± SD. Statistical analyses used unpaired t-test or one-way ANOVA test. *p < 0.05; **p < 0.01; ***p < 0.001; n.s. no significance. Scale bar in B, C, 100 μm; E, 1 mm; H, 50 μm. See also Figure S6 and S7.
Figure 5.
Figure 5.. Sox9 regulates symmetric division in the gastric tissues during tumor development.
(A) Epithelial cells undergo symmetrical and asymmetric division in the stomach of WT mice. Dotted line indicates the basement membrane (BM). (B) Representative images and quantification of mitotic angles of gastric epithelial cells in Sox2-CreERT;Kras(LSL-G12D) mutants with and without Sox9 deletion and SSKP mice at different time points. (C) Quantification of symmetric and asymmetric division in B. Data are expressed as mean ± SD. Statistical analyses used unpaired t-test or one-way ANOVA test. *p < 0.05; **p < 0.01; ***p < 0.001; n.s. no significance. Scale bar, 50 μm. See also Figure S8.
Figure 6.
Figure 6.. Deletion of SOX9 reduces symmetric division in gastric cancer cells.
(A) Schematic diagram of BrdU pulse-chase assay. (B) Representative images of symmetric and asymmetric division in gastric cancer cells assessed by paired-cell assay. (C) The percentage of BrdU and SOX9 co-expression or inverse expression in gastric cancer cells undergoing asymmetric division. Co-expression indicates that SOX9 is colocalized with the prelabeled BrdU in the same cells, while inverse expression exhibits that SOX9 and prelabeled BrdU were localized to the opposite cells. (D) Cell division assessed by paired-cell assay and corresponding phase contrasted images in gastric cancer cells with and without SOX9 deletion. (E) Quantification of symmetric and asymmetric division in D. Data are expressed as mean ± SD. Statistical analyses used unpaired t-test or one-way ANOVA test. *p < 0.05; **p < 0.01; ***p < 0.001; n.s. no significance. Scale bar in B, 5 μm; D, 50 μm. See also Figure S9.
Figure 7.
Figure 7.. Elevated expression of SOX9 is associated with gastric cancer recurrence and poor prognosis.
(A) Representative images of SOX9 IHC staining in the normal human stomach. (B) Using TCGA and GEO database to examine the expression of SOX9 in gastric cancer and adjacent normal tissues. (C) Representative images of different score of SOX9 IHC staining in gastric cancer tissues. (D) Association of SOX9 expression, tumor location and stage in gastric cancer cohorts. (E) Association of SOX9 expression and the frequency of various recurrence patterns. (F) Kaplan-Meier analyses of the correlations between SOX9 expression and the overall survival or disease-free survival in 244 patients. (G) Univariate and multivariate survival Cox regression analyses for the 244 patients with gastric cancer. (H) Effect of chemotherapy on the overall survival and disease-free survival in gastric cancer patients with low and high SOX9 expression. ACT, adjuvant chemotherapy. Data are expressed as mean ± SD. Statistical analyses used unpaired t-test. *p < 0.05; **p < 0.01; ***p < 0.001; n.s. no significance. Scale bar in A, 200 μm; C, 100 μm.

Comment in

References

    1. Sung H, Ferlay J, Siegel RL, et al. Global cancer statistics 2020: GLOBOCAN estimates of incidence and mortality worldwide for 36 cancers in 185 countries. CA: a cancer journal for clinicians 2021;71:209–249. - PubMed
    1. Barker N, Ridgway R, van Es J, et al. Crypt stem cells as the cells-of-origin of intestinal cancer. Nature 2009;457:608–11. - PubMed
    1. Ang C, Hsu S, Guo F, et al. Lgr5 pericentral hepatocytes are self-maintained in normal liver regeneration and susceptible to hepatocarcinogenesis. Proceedings of the National Academy of Sciences of the United States of America 2019;116:19530–19540. - PMC - PubMed
    1. Liu B, McDermott S, Khwaja S, et al. The transforming activity of Wnt effectors correlates with their ability to induce the accumulation of mammary progenitor cells. Proceedings of the National Academy of Sciences of the United States of America 2004;101:4158–63. - PMC - PubMed
    1. Liu K, Jiang M, Lu Y, et al. Sox2 cooperates with inflammation-mediated Stat3 activation in the malignant transformation of foregut basal progenitor cells. Cell stem cell 2013;12:304–15. - PMC - PubMed

Publication types

Substances