. 2023 Feb 5;20(1):26.
doi: 10.1186/s12974-023-02709-w.

ASC specks exacerbate α‑synuclein pathology via amplifying NLRP3 inflammasome activities

Affiliations

ASC specks exacerbate α‑synuclein pathology via amplifying NLRP3 inflammasome activities

Ran Zheng et al. J Neuroinflammation. .

Abstract

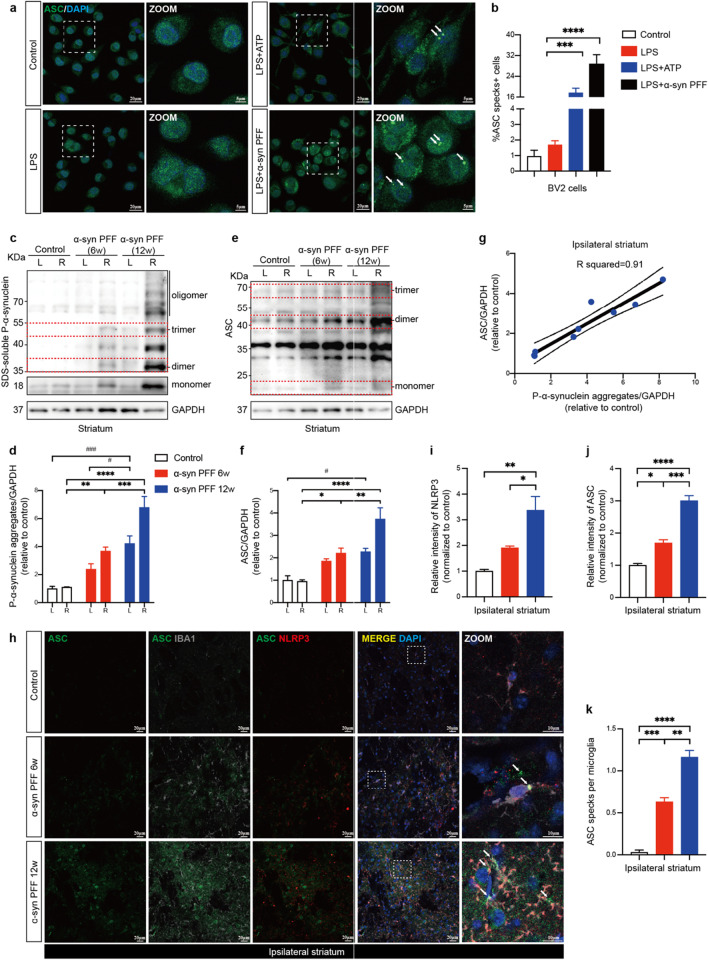
Background: Inflammasome activation has a pathogenic role in Parkinson's disease (PD). Up-regulated expressions of inflammasome adaptor apoptosis-associated speck-like protein containing a CARD (ASC) and assembly of ASC specks have been observed in postmortems of human PD brains and experimental PD models. Extracellular ASC specks behave like danger signals and sustain prolonged inflammasome activation. However, the contribution of ASC specks in propagation of inflammasome activation and pathological progression in PD has not been fully established.

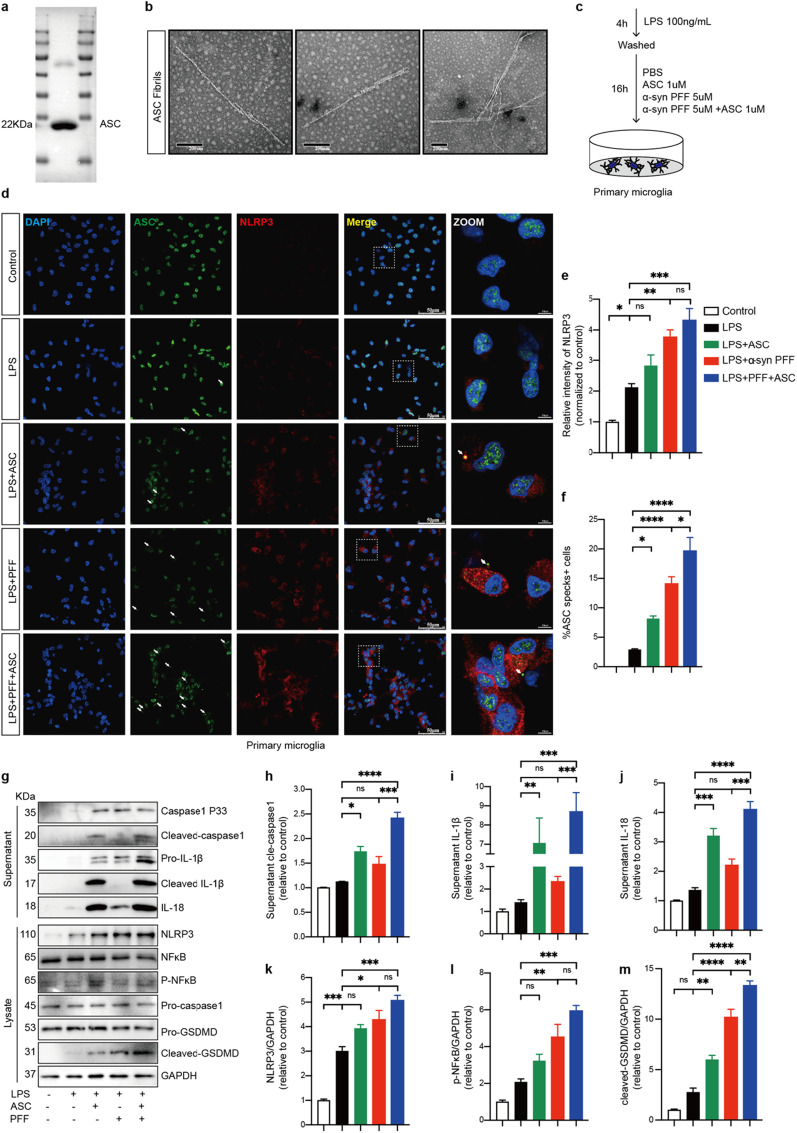
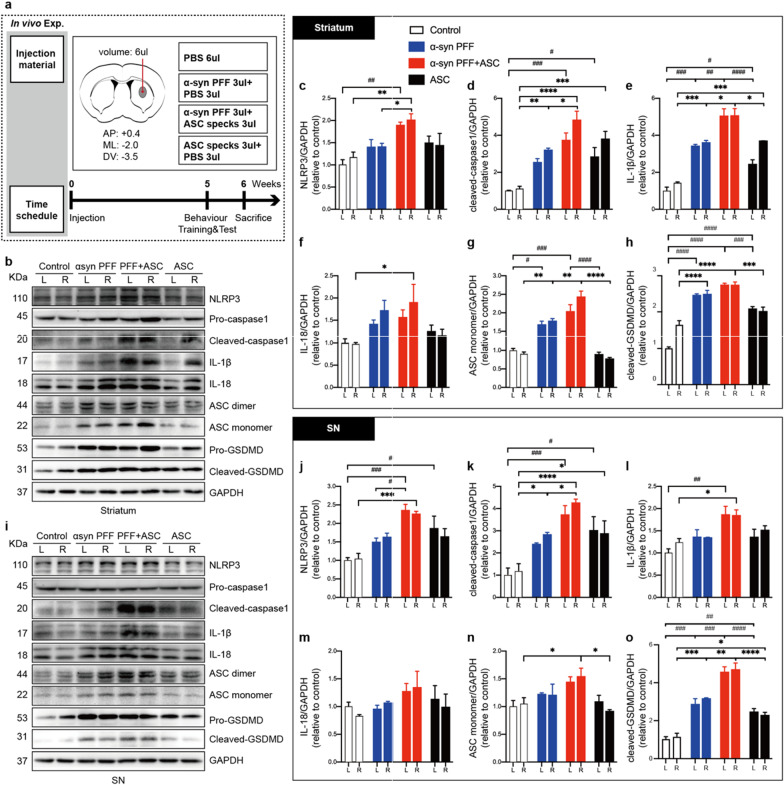
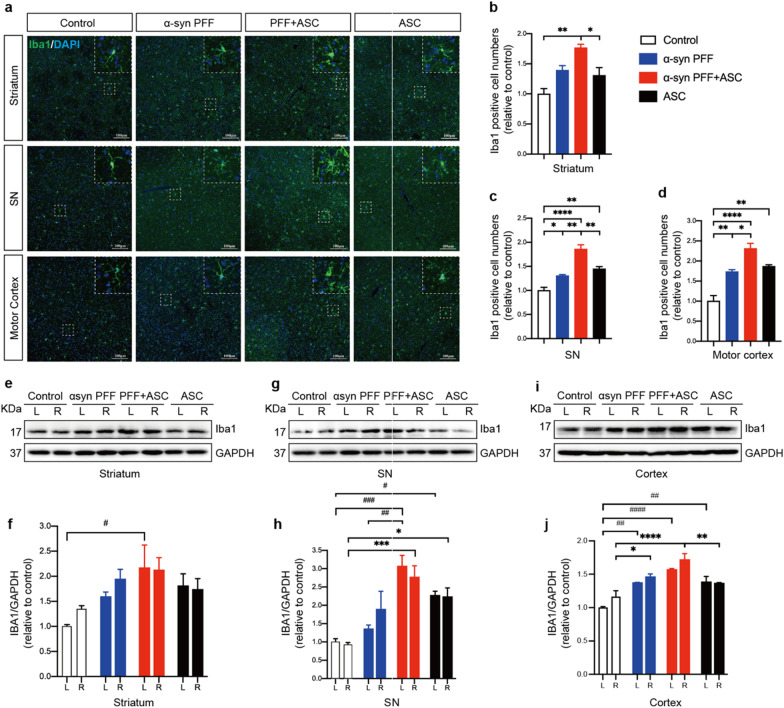
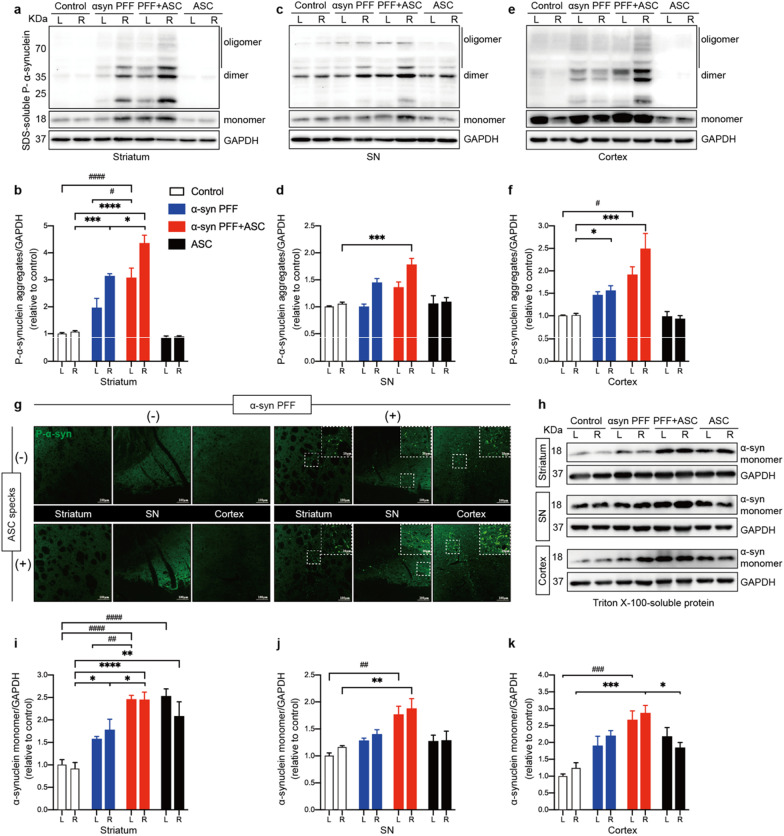
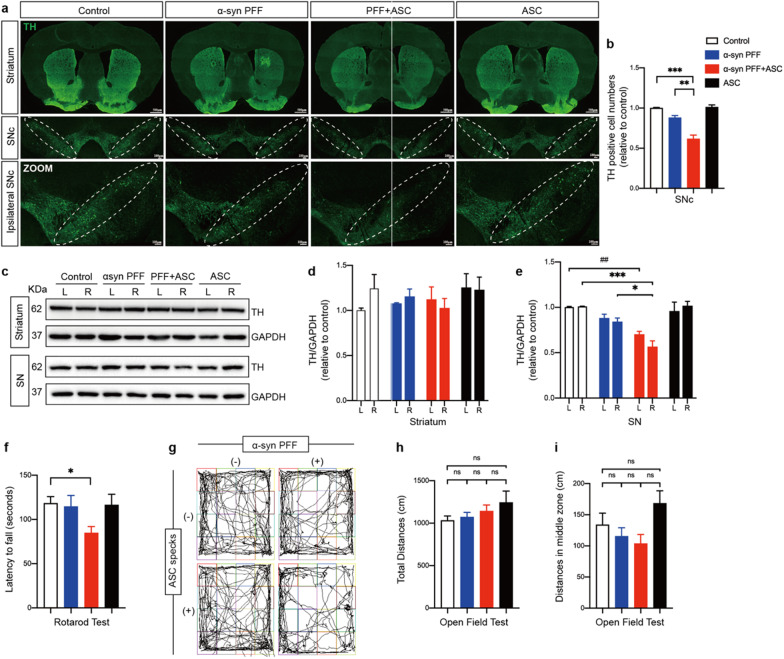
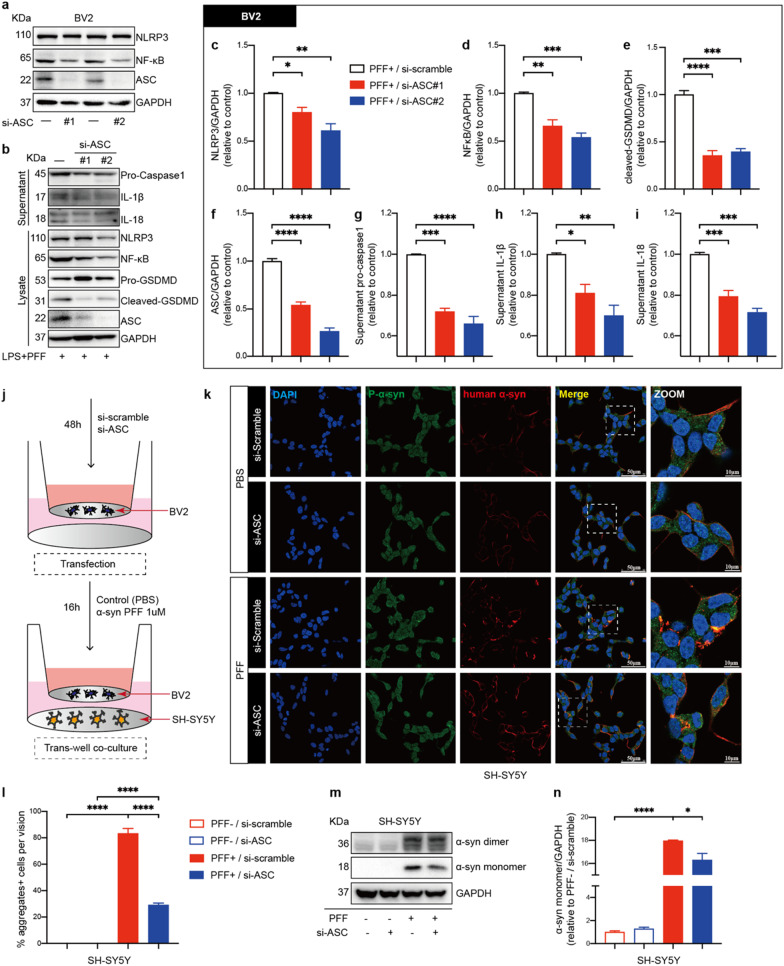
Methods: Herein, we used human A53T mutant α-synuclein preformed fibrils (PFFs)-stimulated microglia in vitro and unilateral striatal stereotaxic injection of PFFs-induced mice model of PD in vivo, to investigate the significance of ASC specks in PD pathological progression. Rotarod and open-field tests were performed to measure motor behaviors of indicated mice. Changes in the molecular expression were evaluated by immunofluorescence and immunoblotting (IB). Intracellular knockdown of the ASC in BV2 cells was performed using si-RNA. Microglial and neuronal cells were co-cultured in a trans-well system to determine the effects of ASC knockdown on cytoprotection.

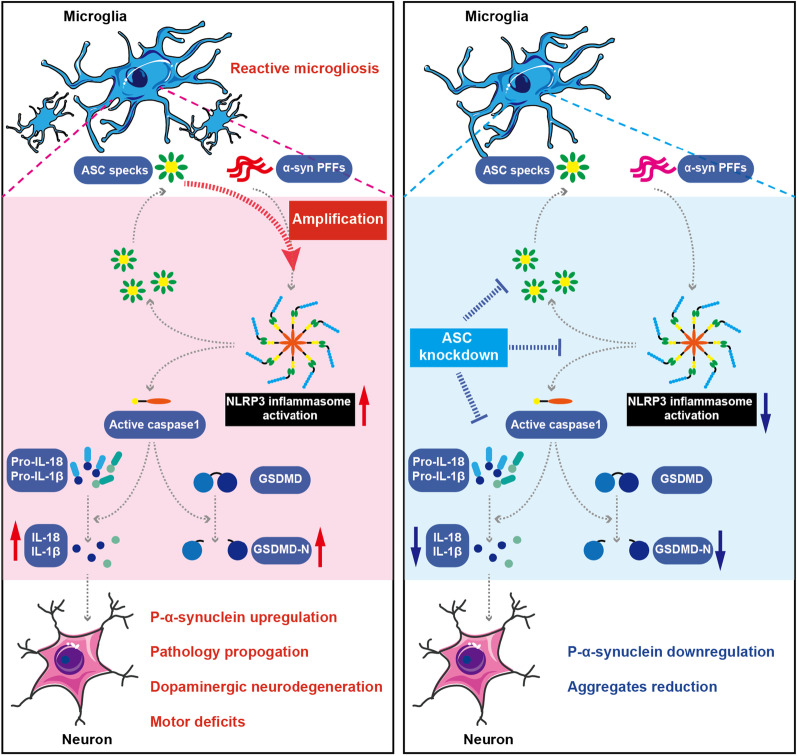
Results: We observed a direct relationship between levels of ASC protein and misfolded α‑synuclein aggregates in PD mice brains. ASC specks amplified NLRP3 inflammasome activation driven by α-synuclein PFFs stimulation, which aggravated reactive microgliosis and accelerated α‑synuclein pathology, dopaminergic neurodegeneration and motor deficits. Endogenous ASC knockdown suppressed microglial inflammasome activation and neuronal α‑synuclein aggregation.

Conclusions: In conclusion, our study elucidated that ASC specks contribute to the propagation of inflammasome activation-associated α‑synuclein pathology in PD, which forms the basis for targeting ASC as a potential therapy for PD.

Keywords: ASC specks; Microglia; NLRP3 inflammasome; Parkinson’s disease; α‑synuclein pathology.


Conflict of interest statement

The authors declare that there are no competing interests.

Figures

Fig. 1
Fig. 1
ASC specks formation upon PFFs stimulation correlated with progression of α-synuclein pathology. a Representative immunofluorescence staining of ASC (green) in BV2 cells stimulated with 1ug/ml LPS for 4 h followed by 5 mM ATP for 0.5 h or 2 μM human A53T mutant α-synuclein PFFs for 16 h. ATP was used as the positive control. DAPI represents the nuclear signal (blue). The white dotted boxes in images are magnified on the right. White arrows indicate ASC specks. b Quantification of the percentages of ASC specks-positive BV2 cells. cf Immunoblot (IB) analysis and quantification of phosphate-α-synuclein aggregates and ASC levels in bilateral striatum of controls and human A53T mutant α-synuclein PFFs-induced PD mice at six- and twelve-weeks post-surgery (n = 3). The red dotted boxes in images indicate monomeric, dimeric or trimeric proteins. g A simple linear regression was performed on relative levels of ASC and phosphate-α-synuclein aggregates, and R squared was calculated (n = 9). h Representative immunofluorescence images of ASC (green), NLRP3 (red) and Iba1 (grey) in the ipsilateral striatum of indicated mice brains (n = 3). DAPI represents the nuclear signal (blue). The white dotted boxes in images are magnified on the right. White arrows indicate ASC specks. i Quantification of relative fluorescent intensities of NLRP3. (j) Quantification of relative fluorescent intensities of ASC. k Quantification of the average numbers of ASC specks per microglia in the indicated mice ipsilateral striatum. Data are presented as mean ± SEM for at least n = 3 and are analyzed by one-way or two-way ANOVA followed by Tukey’s post hoc test for multiple comparisons. Significance levels are indicated as: *p < 0.05, **p < 0.01, ***p < 0.001, ****p < 0.0001; #p < 0.05; ###p < 0.001. Scale bars are as indicated. L left, R right, LPS lipopolysaccharide, ATP adenosine triphosphate
Fig. 2
Fig. 2
ASC fibrils amplified NLRP3 inflammasome activation in PFFs-treated microglia. a IB was probed for purified ASC proteins. 22 KDa: theoretical molecular weight of ASC monomer. b Representative transmission electron microscopy (TEM) images of ASC fibrils induced by incubation. c Schematic presentation of the following experimental setup. d Representative immunofluorescence staining of ASC (green) and NLRP3 (red) in primary microglia with indicated treatments. The white dotted boxes in images are magnified on the right. White arrows indicate ASC specks. e Quantification of relative fluorescent intensities of NLRP3. f Quantification of the percentages of ASC specks-positive primary microglia. gm IB analysis and quantification of NLRP3 inflammasome signals in supernatants and cell lysates of PFFs or PBS-treated primed-primary microglia cells challenged with or without ASC specks. Data are shown as representative plots g and bands quantified by densitometric analysis (hm). Data are presented as mean ± SEM for at least n = 3 and are analyzed by one-way ANOVA followed by Tukey’s post hoc test for multiple comparisons. Significance levels are indicated as: *p < 0.05, **p < 0.01, ***p < 0.001, ****p < 0.0001, ns no significant. Scale bars are as indicated
Fig. 3
Fig. 3
ASC specks augmented NLRP3 inflammasome activation in human A53T mutant α-synuclein PFFs-induced PD mice. a Diagram showing the experimental design and time course of treatment schedules in vivo. The number of mice in each group: PBS group, n = 11; PFFs treated group, n = 10; PFF + ASC co-injected group, n = 13; ASC specks treated group, n = 10. bh IB analysis and quantification of NLRP3 inflammasome signals in bilateral striatum of indicated mice (n = 3 or 4). io IB analysis and quantification of NLRP3 inflammasome signals in bilateral SN of indicated mice (n = 3 or 4). Quantifications of NLRP3, cleaved-caspase 1, IL-1β, IL18, ASC monomer and cleaved GSDMD levels were performed by densitometric analysis normalized to GAPDH, relative to the contralateral striatum or SN regions of the control group. Values are presented as mean ± SEM and are analyzed by two-way ANOVA followed by Tukey’s post hoc test for multiple comparisons. Significance levels are: *p < 0.05, **p < 0.01, ***p < 0.001, ****p < 0.0001 (Right hemisphere of brain tissues); #p < 0.05; ##p < 0.01; ###p < 0.001; ####p < 0.0001(Left hemisphere of brain tissues). L left, R right, SN substantia nigra
Fig. 4
Fig. 4
ASC specks enhanced reactive microgliosis. a Representative immunofluorescence staining of Iba1 (green) in ipsilateral striatum, SN and motor cortex of indicated mice brains. White dotted squares show the morphology of the microglia after magnification. bd Quantification of the relative Iba1-positive cell numbers in ipsilateral striatum, SN and motor cortex of indicated mice brains (n = 3 or 4). e, f IB analysis and quantification of Iba1 in bilateral striatum (n = 3 or 4). g, h IB analysis and quantification of Iba1 in bilateral SN tissues (n = 3 or 4). i, j IB analysis and quantification of Iba1 in bilateral cortex (n = 3 or 4). Values are presented as mean ± SEM and are analyzed by one-way or two-way ANOVA followed by Tukey’s post hoc test for multiple comparisons. Significance levels are: *p < 0.05, **p < 0.01, ***p < 0.001, ****p < 0.0001 (Right hemisphere of brain tissues); #p < 0.05; ##p < 0.01; ###p < 0.001; ####p < 0.0001 (Left hemisphere of brain tissues). Scale bar: 100 μm. L left, R right, SN substantia nigra
Fig. 5
Fig. 5
ASC specks exacerbated α-synuclein aggregation and propagation. a, b IB analysis and quantification of SDS-soluble phosphate-α-synuclein (P-α-syn) in bilateral striatum (n = 4 or 6). c, d IB analysis and quantification of SDS-soluble P-α-syn in bilateral SN tissues (n = 4 or 6). e, f IB analysis and quantification of SDS-soluble P-α-syn in cortex (n = 4 or 6). g Representative immunofluorescence staining of P-α-syn (green) in the ipsilateral striatum and SN regions of indicated mice. hk IB analysis and quantification of triton-soluble α-synuclein monomers in the bilateral striatum, SN and cortex in indicated mice (n = 4 or 6). Data are presented as mean ± SEM and are analyzed by two-way ANOVA followed by Tukey’s post hoc test for multiple comparisons. Significance levels are: *p < 0.05, **p < 0.01, ***p < 0.001, ****p < 0.0001 (Right hemisphere of brain tissue); #p < 0.05; ##p < 0.01; ###p < 0.001; ####p < 0.0001 (Left hemisphere of brain tissue). Scale bars are as indicated. L left, R right, SN substantia nigra
Fig. 6
Fig. 6
ASC specks accelerated dopaminergic neurons degeneration and motor deficits. a Representative immunofluorescence staining of tyrosine hydroxylase (TH) positive neurons (green) in the striatum and substantia nigra compacta (SNc) of indicated mice brains. White dotted circles indicate SNc regions. Ipsilateral SNc regions in images are magnified below. b Quantification of percentages of relative TH positive cells in SNc (n = 3 or 4). ce IB was performed to determine TH levels in bilateral striatum and SN of indicated mice brains (n = 3 or 4). Data are shown as representative plots c and bands quantified by densitometric analysis (d, e). f Latency to falling during the rotarod test was recorded and analyzed for each mouse. g Representative images of general locomotor activities and exploratory behaviors of indicated mice in the open field test. h, i Total distance traveled and distance traveled in middle zone were recorded and analyzed for each mouse. Data are presented as mean ± SEM and are analyzed by one-way or two-way ANOVA followed by Tukey’s post hoc test for multiple comparisons. Significance levels are denoted as: *p < 0.05, **p < 0.01, ***p < 0.001; ##p < 0.01; ns no significant. Scale bars are as indicated. L left, R right, SNc substantia nigra compacta, SN substantia nigra
Fig. 7
Fig. 7
ASC knockdown suppressed PFFs-induced NLRP3 inflammasome activation in BV2 cells and upregulation of α-synuclein in SH-SY5Y cells. a IB analysis of NLRP3, NF-κB, ASC in mouse BV2 cells transfected with either si-scramble RNA or si-ASC RNA for 48 h. bi IB analysis and quantification of NLRP3 inflammasome signals in BV2 cells challenged with 500 ng/ml LPS priming for 4 h followed by 1 μM PFFs stimulation for 16 h after transfection. j Schematic drawing of the BV2 cells and SH-SY5Y cells co-culture setup used in this study. Si-scramble RNA or si-ASC RNA transfected BV2 cells are treated with PBS or 1 μM PFFs and co-cultured with SH-SY5Y cells for 16 h. k Representative immunofluorescence images of P-α-syn (green) and human α-synuclein (red) in SH-SY5Y cells co-cultured with indicated-treated BV2 cells. The white dotted boxes in images are magnified on the right. l Quantification of the percentages of α-synuclein aggregates-positive cells per vision in SH-SY5Y cells. m, n IB analysis and quantification of α-synuclein in co-cultured SH-SY5Y cells. Data are obtained from at least three independent experiments. Data are presented as mean ± SEM and are analyzed by one-way ANOVA followed by Tukey’s post hoc test for multiple comparisons. Significance levels are: *p < 0.05, **p < 0.01, ***p < 0.001, ****p < 0.0001. Scale bars are as indicated
Fig. 8
Fig. 8
ASC specks exacerbate neuronal α‑synuclein pathology via amplifying microglial NLRP3 inflammasome activities. The NLRP3 inflammasome was assembled and activated in microglia under α-synuclein PFFs stimulation. Upon the assembly of ASC with NLRP3, pro-caspase-1 was recruited, which mediated cleavage of cytokines and GSDMD, accompanied with ASC specks formation and release. ASC specks amplified NLRP3 inflammasome activation induced by α-synuclein PFFs in a vicious positive feedback manner, which significantly promoted reactive microgliosis and neuronal α-synuclein accumulation. These effects contributed to propagation of α-synuclein pathology, degeneration of dopaminergic neurons and motor deficits. Knockdown of endogenous ASC significantly suppressed microglial NLRP3 inflammasome activation and neuronal α‑synuclein aggregation under the challenge of PFFs, indicating that targeting ASC is a potentially therapeutic approach for PD

References

    1. Poewe W, Seppi K, Tanner CM, Halliday GM, Brundin P, Volkmann J, Schrag AE, Lang AE. Parkinson disease. Nat Rev Dis Primers. 2017;3:17013. - PubMed
    1. Cacabelos R. Parkinson's disease: from pathogenesis to pharmacogenomics. Int J Mol Sci. 2017;18:551. - PMC - PubMed
    1. Koziorowski D, Figura M, Milanowski LM, Szlufik S, Alster P, Madetko N, Friedman A. Mechanisms of neurodegeneration in various forms of parkinsonism-similarities and differences. Cells. 2021;10:656. - PMC - PubMed
    1. Hulse J, Bhaskar K. Crosstalk between the NLRP3 inflammasome/ASC speck and amyloid protein aggregates drives disease progression in Alzheimer's and Parkinson's disease. Front Mol Neurosci. 2022;15:805169. - PMC - PubMed
    1. McGeer PL, McGeer EG. The amyloid cascade-inflammatory hypothesis of Alzheimer disease: implications for therapy. Acta Neuropathol. 2013;126:479–497. - PubMed

MeSH terms

Substances