Clinical Trial
. 2023 Feb 6;15(1):19.
doi: 10.1186/s13148-023-01436-6.

Aberrant JAK-STAT signaling-mediated chromatin remodeling impairs the sensitivity of NK/T-cell lymphoma to chidamide

Affiliations
Clinical Trial

Aberrant JAK-STAT signaling-mediated chromatin remodeling impairs the sensitivity of NK/T-cell lymphoma to chidamide

Jinghong Chen et al. Clin Epigenetics. .

Abstract

Background: Natural killer/T-cell lymphoma (NKTL) is a rare type of aggressive and heterogeneous non-Hodgkin's lymphoma (NHL) with a poor prognosis and limited therapeutic options. Therefore, there is an urgent need to exploit potential novel therapeutic targets for the treatment of NKTL. Histone deacetylase (HDAC) inhibitor chidamide was recently approved for treating relapsed/refractory peripheral T-cell lymphoma (PTCL) patients. However, its therapeutic efficacy in NKTL remains unclear.

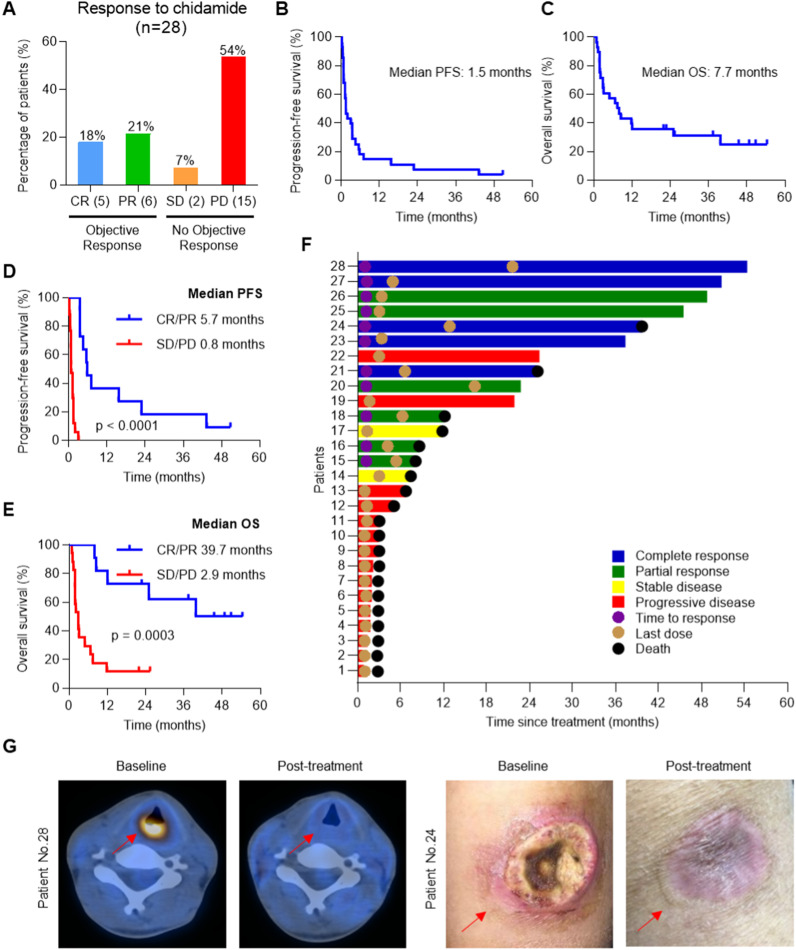
Methods: We performed a phase II clinical trial to evaluate the efficacy of chidamide in 28 relapsed/refractory NKTL patients. Integrative transcriptomic, chromatin profiling analysis and functional studies were performed to identify potential predictive biomarkers and unravel the mechanisms of resistance to chidamide. Immunohistochemistry (IHC) was used to validate the predictive biomarkers in tumors from the clinical trial.

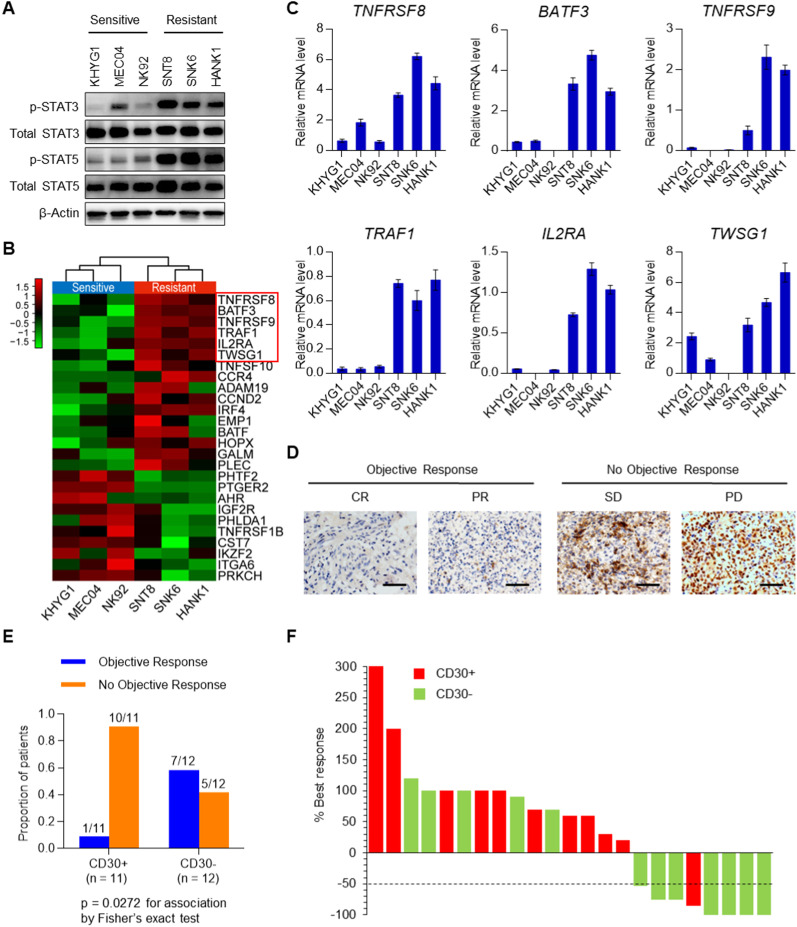
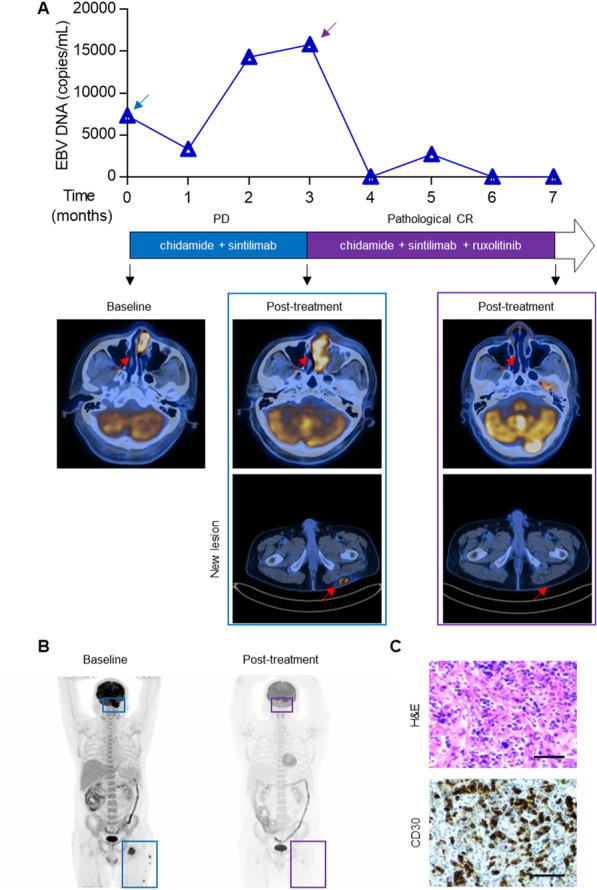
Results: We demonstrated that chidamide is effective in treating relapsed/refractory NKTL patients, achieving an overall response and complete response rate of 39 and 18%, respectively. In vitro studies showed that hyperactivity of JAK-STAT signaling in NKTL cell lines was associated with the resistance to chidamide. Mechanistically, our results revealed that aberrant JAK-STAT signaling remodels the chromatin and confers resistance to chidamide. Subsequently, inhibition of JAK-STAT activity could overcome resistance to chidamide by reprogramming the chromatin from a resistant to sensitive state, leading to synergistic anti-tumor effect in vitro and in vivo. More importantly, our clinical data demonstrated that combinatorial therapy with chidamide and JAK inhibitor ruxolitinib is effective against chidamide-resistant NKTL. In addition, we identified TNFRSF8 (CD30), a downstream target of the JAK-STAT pathway, as a potential biomarker that could predict NKTL sensitivity to chidamide.

Conclusions: Our study suggests that chidamide, in combination with JAK-STAT inhibitors, can be a novel targeted therapy in the standard of care for NKTL.

Trial registration: ClinicalTrials.gov, NCT02878278. Registered 25 August 2016, https://clinicaltrials.gov/ct2/show/NCT02878278.

Keywords: Chidamide resistance; Chromatin remodeling; HDAC inhibitor; JAK-STAT pathway; NKTL.


Conflict of interest statement

The authors declare that they have no competing interests.

Figures

Fig. 1
Fig. 1
Efficacy of chidamide in 28 relapsed/refractory NKTL patients. A Assessment of responses in 28 relapsed/refractory NKTL patients treated with chidamide. CR (5), complete response, 5 patients; PR (6), partial response, 6 patients; SD (2), stable disease, 2 patients; PD (15), progressive disease, 15 patients. Patients with CR or PR were classified as having objective responses, while those with SD or PD were classified as not having objective responses. B Kaplan–Meier curve for PFS of all patients treated with chidamide. C Kaplan–Meier curve for OS of all patients treated with chidamide. D Kaplan–Meier curve comparing the PFS of patients who responded to chidamide (n = 11) with the PFS of those who did not respond (n = 17); p value, log-rank test. E Kaplan–Meier curve comparing the OS of patients who responded to chidamide (n = 11) with the OS of those who did not respond (n = 17); p value, log-rank test. F Swimmer plot showing duration since treatment initiation and clinical outcomes for patients. G Representative images showing tumor lesions (red arrow) before and after chidamide treatment in two relapsed/refractory NKTL patients who achieved CR. Upper images, positron emission tomography-computed tomography (PET-CT) imaging of patient No. 28, throat; lower images, photographs of patient No. 24, left arm
Fig. 2
Fig. 2
Chidamide inhibits cell proliferation and selectively induces the death of NKTL cells. A The effect of chidamide on the proliferation of 11 NKTL cell lines at 96 h posttreatment, represented as the concentration of chidamide required to inhibit proliferation by 50% (IC50). B–C Cell viability responses of NKTL cells to the HDAC inhibitors chidamide (1 μM), romidepsin (2.5 nM), belinostat (400 nM), SAHA (1 μM) and TSA (0.1 μM). D Dose-dependent effects of chidamide on cell proliferation over time in sensitive (KHYG1 and MEC04) and resistant (HANK1 and SNK6) cell lines. E Cell cycle assay of KHYG1, MEC04, HANK1 and SNT8 cells treated with chidamide for 72 h. F Annexin V/PI staining of KHYG1 and HANK1 cells treated with chidamide for 72 h. The results are expressed as the mean ± SD of three independent experiments
Fig. 3
Fig. 3
Chromatin and transcriptomic profiling of chidamide-resistant and chidamide-sensitive NKTL cells. A Heatmap representation of unsupervised hierarchical clustering based on H3K27ac occupancy at total H3K27ac ChIP-seq peaks (n = 28,727). Samples were clustered based on the Spearman correlation coefficient with average linkage. B Venn diagram showing the overlap of H3K27ac peaks between resistant and sensitive cells. C MA plot of all peaks from comparison of resistant and sensitive samples after normalization by MAnorm3. Each dot represents a peak, the red dots represent the GAIN regions (n = 9267), and the blue dots represent the LOSS regions (n = 3558). D Heatmap representation of GAIN and LOSS regions based on H3K27ac occupancy in resistant and sensitive samples. Ten kb around the center of the GAIN and LOSS regions is displayed for each sample. E Motif analysis of GAIN regions in resistant cells using HOMER, showing significant enrichment of the bZIP family, RHD family, STAT family and IRF family (hypergeometric test). F Scatter plot showing the correlation between ChIP-seq mark intensity and RNA-seq read intensity. Each dot represents an overlapping locus, while the red dots (n = 906) indicate upregulated loci between resistant and sensitive cells, and the blue dots (n = 340) indicate downregulated loci. G Unsupervised hierarchical clustering of differentially expressed genes (DEGs) (p < 0.05, |log2-fold change|> 1) overlapping with H3K27ac GAIN and LOSS regions in sensitive versus resistant cells. H GSEA was performed based on a hypergeometric test that takes the size of the overlap between the hallmark gene set and the list of differentially expressed genes overlapping with H3K27ac GAIN and LOSS regions in resistant versus sensitive cells as the test statistics. I IGV screen shots showing the distribution of H3K27ac mark intensity in resistant versus sensitive cells at two representative genomic loci (TNFRSF8 and TNFRSF9)
Fig. 4
Fig. 4
The JAK-STAT pathway is constitutively activated in chidamide-resistant NKTL. A The JAK-STAT oncogenic signaling pathway was activated in chidamide-resistant cells. B Hierarchical clustering of DEGs from the JAK-STAT pathway in sensitive versus resistant cells. C RT–qPCR validation of genes from the JAK-STAT pathway in sensitive and resistant cells. D Representative images of IHC for CD30 in NKTL biopsies. Scale bars: 50 μm. E Association between the expression of CD30 and clinical response. The expression of CD30 in 23 NKTL biopsies (available from the 28 relapsed/refractory NKTL patients) was examined by IHC. p = 0.0272 for association by Fisher’s exact test. F Waterfall plot showing the association between the expression of CD30 and the best overall response to chidamide in 23 patients. The results are expressed as the mean ± SD of three independent experiments
Fig. 5
Fig. 5
JAK-STAT inhibitors overcome chidamide resistance in NKTL cells. A Combination index values for chidamide and tofacitinib combinatorial treatment in HANK1 and SNK6 cells. Combination index values were calculated with CalcuSyn software as a function of the level of antiproliferative activity. Combination index = 1 denotes additivity, combination index > 1 denotes antagonism, and combination index < 1 denotes synergy. B Proliferation curves in the presence of tofacitinib, chidamide or a combination. C Cell cycle assay for the combined effects of tofacitinib and chidamide in HANK1 and SNK6 cells. D–E Proliferation curves and cell cycle assays for combination treatment with other JAK-STAT inhibitors, ruxolitinib/Stattic and chidamide, in HANK1 cells. F Annexin V/PI staining of HANK1 cells treated with chidamide and tofacitinib/ruxolitinib for 72 h. G Proliferation curves in the presence of tofacitinib/ruxolitinib, romidepsin or a combination in HANK1 cells. H Cell cycle assay for the combination treatment of HANK1 cells with romidepsin and tofacitinib/ruxolitinib for 72 h. I Proliferation curve of NK-S1 cells in the presence of ruxolitinib, chidamide or a combination. J Cell cycle assay for the combination treatment of NK-S1 cells with ruxolitinib and chidamide for 72 h. K Xenograft tumor growth curve of NK-S1 cells in NOD/SCID/IL2rγnull (NSG) mice treated with chidamide at 25 mg/kg, ruxolitinib at 180 mg/kg or both for 12 days. L Body weight of NSG mice bearing NK-S1 tumors treated with chidamide at 25 mg/kg, ruxolitinib at 180 mg/kg or both for 12 days. The results are expressed as the mean ± SD of three independent experiments. *p < 0.05
Fig. 6
Fig. 6
The JAK inhibitors tofacitinib and ruxolitinib reverse chidamide resistance by altering chromatin remodeling. A Hierarchical clustering showing the DEGs in HANK1 cells treated with tofacitinib or ruxolitinib versus DMSO (p < 0.05, |log2-fold change|> 1). B GSEA pathways analysis of the JAK-STAT pathway after tofacitinib or ruxolitinib treatment versus DMSO treatment of HANK1 cells. C The JAK inhibitors tofacitinib and ruxolitinib impaired the JAK-STAT pathway in resistant NKTL. D RT–qPCR validation of genes in the JAK-STAT pathway for sensitive cells and resistant cells with or without tofacitinib/ruxolitinib treatment. E ChIP-qPCR of genes in the JAK-STAT pathway for sensitive cells and resistant cells with or without tofacitinib/ruxolitinib treatment. HANK1/SNK6 cells were treated with tofacitinib/ruxolitinib or DMSO. The results are expressed as the mean ± SD of three independent experiments. *p < 0.05, n.s., not significant
Fig. 7
Fig. 7
The benefit of combinatorial therapy in relapsed/refractory NKTL patient. A Top panel, graph depicting the dynamics of EBV DNA copy number in the blood of a relapsed/refractory NKTL patient during treatment with a series of combinatorial therapies. The blue and purple arrows indicate the start time of treatment with the combination of chidamide + sintilimab and chidamide + sintilimab + ruxolitinib, respectively. Middle panel, clinical response to the indicated therapeutic regimens. Bottom panel, representative scans from the patient at baseline and after treatment with the combination of chidamide + sintilimab or chidamide + sintilimab + ruxolitinib. The red arrows indicate lesion locations. B Whole-body PET-CT showing tumor lesions (blue and purple frames) before and after combination treatment with chidamide + sintilimab + ruxolitinib in a relapsed/refractory NKTL patient. C Representative images of H&E staining (upper) and IHC for CD30 (bottom) in an NKTL biopsy before combination treatment with chidamide + sintilimab + ruxolitinib. Scale bars, 50 μm

References

    1. Vose J, Armitage J, Weisenburger D. International peripheral T-cell and natural killer/T-cell lymphoma study: pathology findings and clinical outcomes. J Clin Oncol. 2008;26(25):4124–4130. - PubMed
    1. Gualco G, Domeny-Duarte P, Chioato L, Barber G, Natkunam Y, Bacchi CE. Clinicopathologic and molecular features of 122 Brazilian cases of nodal and extranodal NK/T-cell lymphoma, nasal type, with EBV subtyping analysis. Am J Surg Pathol. 2011;35(8):1195–1203. - PubMed
    1. Alles J, Menegatti J, Motsch N, Hart M, Eichner N, Reinhardt R, et al. miRNA expression profiling of Epstein-Barr virus-associated NKTL cell lines by Illumina deep sequencing. FEBS Open Bio. 2016;6(4):251–263. - PMC - PubMed
    1. Suzuki R, Takeuchi K, Ohshima K, Nakamura S. Extranodal NK/T-cell lymphoma: diagnosis and treatment cues. Hematol Oncol. 2008;26(2):66–72. - PubMed
    1. Liang R. Advances in the management and monitoring of extranodal NK/T-cell lymphoma, nasal type. Br J Haematol. 2009;147(1):13–21. - PubMed

Publication types

Substances

Associated data