. 2023 Jun;89(6):2432-2440.
doi: 10.1002/mrm.29594. Epub 2023 Feb 5.

Diffusion time dependency of extracellular diffusion

Affiliations

Diffusion time dependency of extracellular diffusion

Junzhong Xu et al. Magn Reson Med. 2023 Jun.

Abstract

Purpose: To quantify the variations of the power-law dependences on diffusion time t or gradient frequency f $$ f $$ of extracellular water diffusion measured by diffusion MRI (dMRI).

Methods: Model cellular systems containing only extracellular water were used to investigate the t / f $$ t/f $$ dependence of D ex $$ {D}_{ex} $$ , the extracellular diffusion coefficient. Computer simulations used a randomly packed tissue model with realistic intracellular volume fractions and cell sizes. DMRI measurements were performed on samples consisting of liposomes containing heavy water(D2 O, deuterium oxide) dispersed in regular water (H2 O). D ex $$ {D}_{ex} $$ was obtained over a broad t $$ t $$ range (∼1-1000 ms) and then fit power-law equations D ex ( t ) = D const + const · t - ϑ t $$ {D}_{ex}(t)={D}_{\mathrm{const}}+\mathrm{const}\cdotp {t}^{-{\vartheta}_t} $$ and D ex ( f ) = D const + const · f ϑ f $$ {D}_{ex}(f)={D}_{\mathrm{const}}+\mathrm{const}\cdotp {f}^{\vartheta_f} $$ .

Results: Both simulated and experimental results suggest that no single power-law adequately describes the behavior of D ex $$ {D}_{ex} $$ over the range of diffusion times of most interest in practical dMRI. Previous theoretical predictions are accurate over only limited t $$ t $$ ranges; for example, θ t = θ f = - 1 2 $$ {\theta}_t={\theta}_f=-\frac{1}{2} $$ is valid only for short times, whereas θ t = 1 $$ {\theta}_t=1 $$ or θ f = 3 2 $$ {\theta}_f=\frac{3}{2} $$ is valid only for long times but cannot describe other ranges simultaneously. For the specific t $$ t $$ range of 5-70 ms used in typical human dMRI measurements, θ t = θ f = 1 $$ {\theta}_t={\theta}_f=1 $$ matches the data well empirically.

Conclusion: The optimal power-law fit of extracellular diffusion varies with diffusion time. The dependency obtained at short or long t $$ t $$ limits cannot be applied to typical dMRI measurements in human cancer or liver. It is essential to determine the appropriate diffusion time range when modeling extracellular diffusion in dMRI-based quantitative microstructural imaging.

Keywords: D2O; diffusion; diffusion time; extracellular; liposome; oscillating gradient; phantom.


Figures

Figure 1
Figure 1
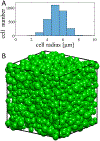
A representative distribution of cell radii (A) and the diagram of the corresponding randomly-packed tissue model used in the simulations (B) with an intracellular volume fraction = 75%.
Figure 2
Figure 2
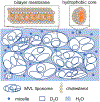
Diagram of the liposome model system. All liposome enclosed space is occupied by heavy water (D2O) that does not contribute to proton dMRI signals. Hence, measurements are determined by interstitial extracellular regular water (H2O) only.
Figure 3
Figure 3
Simulated extracellular diffusion coefficient Dex dependent on diffusion time t and gradient frequency f (markers) and the corresponding fitted curves with typical power-law exponents in different t/f ranges. The shaded area indicates the typical t/f ranges available on clinical MRI systems. A base-10 logarithmic scale is used on the t axis.
Figure 4
Figure 4
MR measured extracellular diffusion coefficient Dex of six liposome samples dependent on diffusion time t (A) and gradient frequency f (B). The shaded area indicates the typical t range 5 – 70 ms and f range f < 50 Hz used on clinical MRI systems. A base-10 logarithmic scale is used on all t axes.
Figure 5
Figure 5
NRMSE (normalized root mean square error) dependent on power-law exponents in simulations (A) and liposome experiments (B). Note that ϑf can only be zero or positive because PGSE f is assumed to be 0.

References

    1. Novikov DS, Fieremans E, Jespersen SN, Kiselev VG. Quantifying brain microstructure with diffusion MRI: Theory and parameter estimation. NMR Biomed 2019;32(4):e3998. - PMC - PubMed
    1. Jiang X, Li H, Devan SP, Gore JC, Xu J. MR cell size imaging with temporal diffusion spectroscopy. Magn Reson Imaging 2021;77:109–123. - PMC - PubMed
    1. Panagiotaki E, Walker-Samuel S, Siow B, Johnson SP, Rajkumar V, Pedley RB, Lythgoe MF, Alexander DC. Noninvasive quantification of solid tumor microstructure using VERDICT MRI. Cancer Res 2014;74(7):1902–1912. - PubMed
    1. Jiang X, Li H, Xie J, Zhao P, Gore JC, Xu J. Quantification of cell size using temporal diffusion spectroscopy. Magn Reson Med 2016;75(3):1076–1085. - PMC - PubMed
    1. Reynaud O, Winters KV, Hoang DM, Wadghiri YZ, Novikov DS, Kim SG. Pulsed and oscillating gradient MRI for assessment of cell size and extracellular space (POMACE) in mouse gliomas. NMR Biomed 2016;29(10):1350–1363. - PMC - PubMed

Publication types