iPSC-based modeling of THD recapitulates disease phenotypes and reveals neuronal malformation
- PMID: 36740977
- PMCID: PMC9994475
- DOI: 10.15252/emmm.202215847
iPSC-based modeling of THD recapitulates disease phenotypes and reveals neuronal malformation
Abstract
Tyrosine hydroxylase deficiency (THD) is a rare genetic disorder leading to dopaminergic depletion and early-onset Parkinsonism. Affected children present with either a severe form that does not respond to L-Dopa treatment (THD-B) or a milder L-Dopa responsive form (THD-A). We generated induced pluripotent stem cells (iPSCs) from THD patients that were differentiated into dopaminergic neurons (DAn) and compared with control-DAn from healthy individuals and gene-corrected isogenic controls. Consistent with patients, THD iPSC-DAn displayed lower levels of DA metabolites and reduced TH expression, when compared to controls. Moreover, THD iPSC-DAn showed abnormal morphology, including reduced total neurite length and neurite arborization defects, which were not evident in DAn differentiated from control-iPSC. Treatment of THD-iPSC-DAn with L-Dopa rescued the neuronal defects and disease phenotype only in THDA-DAn. Interestingly, L-Dopa treatment at the stage of neuronal precursors could prevent the alterations in THDB-iPSC-DAn, thus suggesting the existence of a critical developmental window in THD. Our iPSC-based model recapitulates THD disease phenotypes and response to treatment, representing a promising tool for investigating pathogenic mechanisms, drug screening, and personalized management.
Keywords: L-Dopa; Parkinsonism; dopamine; iPSC; tyrosine hydroxylase deficiency.
© 2023 The Authors. Published under the terms of the CC BY 4.0 license.
Figures

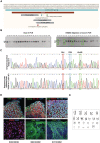
CONTROL 1, CONTROL 2, THDA1#17, THDA1#5, THDB1#15 and THDB1#1 iPSC stained for alkaline phosphatase (AP) activity and for the pluripotency‐associated markers OCT4, NANOG, SOX2 (green), SSEA3, TRA‐1‐81, SSEA4 (red), and TRA‐1‐60 (cyan).
No karyotypic abnormalities were observed in all iPSCs at passage 15.
Copy of gDNA (#/ng) of the episomal vector. Positive control (C+): THD iPSC line nucleofected with GFP, negative control (C−): fibroblasts of each THD patient.
Direct sequencing of genomic DNA from THDA and THDB iPSCs identifying the c.698G>A and c.982C>T and c.1196C>T mutations, respectively.
Immunofluorescence analyses of controls (CONTROL 1 and 2), THDA‐iPSC (THDA1#17 and THDA1#5), and THDB‐iPSC (THDB1#15 and THDB1#1) differentiated in vitro show the ability to generate cell derivatives of all three primary germ cell layers, including endoderm (stained for FOXA2, red), mesoderm (stained for α SMA, green), and ectoderm (stained for TUJ1, green).

Representative immunofluorescence (IF) images of CONTROL 1, isoTHDA1#17, THDA1#17, and THDB1#15 neuronal cultures (TH in red, TUJ1 in green, and DAPI in blue) at day 30 of differentiation.
Quantification of TUJ1/DAPI and TH/TUJ1 ratios in all cell lines (CONTROL 1, CONTROL2, isoTHDA1#17, THDA1#17, THDA1#5, THDB1#15, and THDB1#1) (n = 3, experiments per iPSC line except for THDB1#1 clone that includes n = 2).
Western blot analysis for determining TH expression in each cell line; positive control (C+): mesencephalon, negative control (C−): fibroblasts,
Quantification of Western blot results (normalized by beta‐actin expression).
ELISA quantification of intracellular dopamine levels (nmols/l) in cultures of control (CT), including CONTROL 1, CONTROL 2, isoTHDA1#17 lines, THDA1#17, and THDB1#15.
HPLC quantification of dopamine levels (fmols/μl) in cultures of control (CT), including CONTROL 1, CONTROL 2, isoTHDA1#17 lines, THDA1#17, and THDB1#15.
HPLC quantification of DOPAC levels (fmols/μl) in cultures of control (CT), including CONTROL 1, CONTROL 2, isoTHDA1#17 lines, THDA1#17, and THDB1#15. Data from isoTHDA1#17 are included as a pool with the Control.
Relative mRNA expression of dopaminergic enzymes (TH and AADC) in CONTROL 1, CONTROL 2, THDA1#17 and THDB1#15.
Relative mRNA expression of other DA genes expression (dopamine receptors, DAT and VMAT2).

A region of the exon 6 with the ssODN, the gRNA, the PAM sequence, the mutation repaired, and the new restriction site for HindIII.
PCR of exon 6 (left) and digestion of this PCR product with HindIII (right) (green boxes show digested PCR products).
Sequence of a positive clone (3F) where the mutation was repaired, the sequence PAM is inactivated, and a new restriction site is introduced; all in homozygosis.
Representative images of isoTHDA1#17 iPSC stained positive for the pluripotency‐associated markers OCT4, NANOG, Sox2, SSEA3, TRA‐1‐81, SSEA4, and Tra1‐60 and for the three primary germ cell layers, including endoderm (stained for FOXA2, red), mesoderm (stained for αSMA, green), and ectoderm (stained for TUJ1, green). Nuclei are counterstained with DAPI, shown in blue. Scale bars, 100 μm.
Normal karyotype of isoTHDA1#17 iPSC at passage 25.

- A
Representative immunofluorescence (IF) images of CONTROL 2, THDA1#5, and THDB1#1 iPSC neuronal cultures (TH in red, TUJ1 in green, and DAPI in blue) at day 30 of differentiation. Scale bars, 20 μm.
- B, C
Western blot of AADC (B) and D2DR (C) expression in CONTROL 1, CONTROL 2, THDA1#5, THDA1#17, THDB1#15, and THDB1#1 iPSCs neuronal cultures.
- D, E
Quantification of Western blot results for AADC (D) and D2DR (E) normalized for total protein (D, n = 3 experiments; E, n = 2 experiments). Data are expressed as mean ± SEM. Unpaired two‐tailed Student's t‐test or Mann–Whitney U‐test was used for pairwise comparisons. **P < 0.01; *P < 0.05.

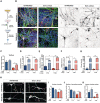
Immunofluorescence (IF) images of neuronal cultures (TH in black) of CONTROL 1, isoTHDA1#17, THDA1#17, and THDB1#15 cell lines.
Representative images of the tracing analysis (TH in white, primary neurites in blue, secondary in magenta, and tertiary in yellow) in the same cell lines.
Quantification of the neurite total length in all cell lines (CONTROL 1, CONTROL2, isoTHDA1#17, THDA1#17, THDA1#5, THDB1#15, and THDB1#1).
Number of neurites.
Number of primary neurites.
Number of secondary neurites.

Immunofluorescence (IF) images of neuronal cultures (TH in black) of the same lines.
Images of the tracing analysis (TH in white, primary neurites in blue, secondary in magenta, and tertiary in yellow) in CONTROL 2, THDA1#5, and THDB1#1 neuronal cultures.
Number of TH tertiary neurites in all cell lines (CONTROL 1, CONTROL 2, isoTHDA1#17, THDA1#17, THDA1#5, THDB1#15, and THDB1#1).

Schematic representation of treatment administration.
Immunofluorescence (IF) images of CONTROL 1, THDA1#17, and THDB1#15 neuronal cultures (TH in red, TUJ1 in green and DAPI in blue) and in black and white to show TH staining.
Quantification of the TH/TUJ1 ratio.
Quantification of the fiber density.
Western blot of TH expression after L‐Dopa treatment; positive control (C+): mesencephalon, negative control (C−): fibroblasts in CONTROL 1, THDA1#17 and THDB1#15.
Quantification of Western blot results (normalized by beta‐actin expression).

Schematic representation of treatment administration.
Immunofluorescence (IF) images of CONTROL 1 and THDB1#15 neuronal cultures (TH in red, TUJ1 in green and DAPI in blue) and in black and white to show TH staining.
Quantification of TH/TUJ1 ratio in the previous lines.
ELISA quantification of intracellular dopamine levels (nmols/l) in the CONTROL 1 and THDB1#15 lines before and after treatment.
HPLC quantification of dopamine levels (fmols/μl).
HPLC quantification of DOPAC levels (fmols/μl).
HPLC quantification of L‐Dopa levels (fmols/μl) in CONTROL 1 and THDB1#15 lines.
Representative images of the tracing analysis (TH in white, primary neurites in blue, secondary in magenta and tertiary in yellow) of CONTROL 1 and THDB1#15 lines.
Number of neurites.
Number of secondary neurites.
Number of tertiary neurites.

Representative images of the tracing analysis (TH in white, primary neurites in blue, secondary in magenta and tertiary in yellow) of CONTROL 1, THDA1#17, and THDB1#15 lines.
Quantification of the total neurite length in CONTROL 1, THDA1#17, and THDB1#15 untreated and treated cultures.

ELISA quantification of intracellular dopamine levels (nmols/l) in CONTROL 1, THDA1#17 and THDB1#15 lines before and after treatment.
HPLC quantification of dopamine levels (fmols/μl).
HPLC quantification of DOPAC levels (fmols/μl).
HPLC quantification of L‐Dopa levels (fmols/μl).
Relative mRNA expression of DA enzymes (TH and AADC).
Dopamine receptors (D1DR and D2DR), DAT, and VMAT2 mRNA expression levels relative to Neural Specific Enolase (NSE) in CONTROL 1, THDA1#17, and THDB1#15.
References
-
- Althini S, Bengtsson H, Usoskin D, Söderström S, Kylberg A, Lindqvist E, De Sousa Lopes SC, Olson L, Lindeberg J, Ebendal T (2003) Normal nigrostriatal innervation but dopamine dysfunction in mice carrying hypomorphic tyrosine hydroxylase alleles. J Neurosci Res 72: 444–453 - PubMed
-
- Brüggemann N, Spiegler J, Hellenbroich Y, Opladen T, Schneider SA, Stephani U, Boor R, Gillessen‐Kaesbach G, Sperner J, Klein C (2012) Beneficial prenatal levodopa therapy in autosomal recessive guanosine triphosphate cyclohydrolase 1 deficiency. Arch Neurol 69: 1071–1075 - PubMed

