

Comparing therapeutic modulators of the SOD1 G93A Amyotrophic Lateral Sclerosis mouse pathophysiology
- PMID: 36741054
- PMCID: PMC9893287
- DOI: 10.3389/fnins.2022.1111763
Comparing therapeutic modulators of the SOD1 G93A Amyotrophic Lateral Sclerosis mouse pathophysiology
Abstract
Introduction: Amyotrophic Lateral Sclerosis (ALS) is a paralyzing, multifactorial neurodegenerative disease with limited therapeutics and no known cure. The study goal was to determine which pathophysiological treatment targets appear most beneficial.
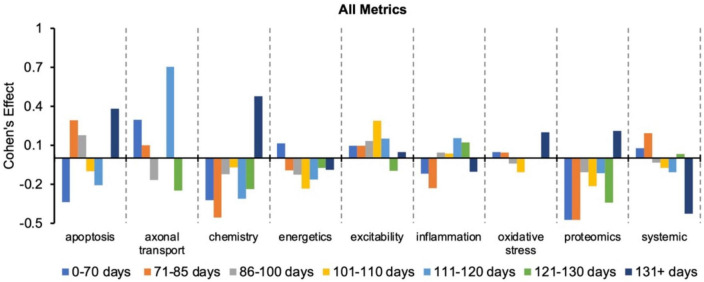
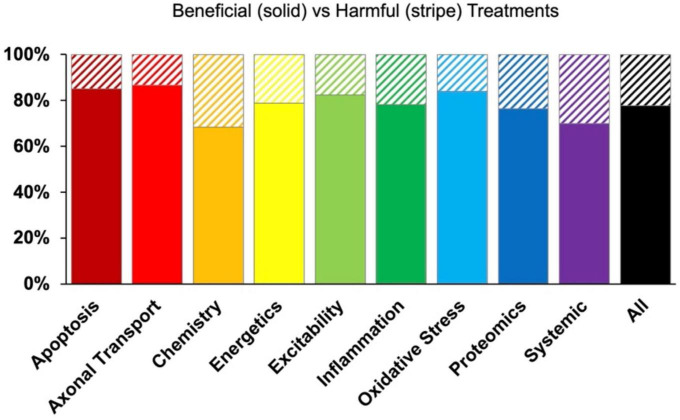
Methods: A big data approach was used to analyze high copy SOD1 G93A experimental data. The secondary data set comprised 227 published studies and 4,296 data points. Treatments were classified by pathophysiological target: apoptosis, axonal transport, cellular chemistry, energetics, neuron excitability, inflammation, oxidative stress, proteomics, or systemic function. Outcome assessment modalities included onset delay, health status (rotarod performance, body weight, grip strength), and survival duration. Pairwise statistical analysis (two-tailed t-test with Bonferroni correction) of normalized fold change (treatment/control) assessed significant differences in treatment efficacy. Cohen's d quantified pathophysiological treatment category effect size compared to "all" (e.g., all pathophysiological treatment categories combined).
Results: Inflammation treatments were best at delaying onset (d = 0.42, p > 0.05). Oxidative stress treatments were significantly better for prolonging survival duration (d = 0.18, p < 0.05). Excitability treatments were significantly better for prolonging overall health status (d = 0.22, p < 0.05). However, the absolute best pathophysiological treatment category for prolonging health status varied with disease progression: oxidative stress was best for pre-onset health (d = 0.18, p > 0.05); excitability was best for prolonging function near onset (d = 0.34, p < 0.05); inflammation was best for prolonging post-onset function (d = 0.24, p > 0.05); and apoptosis was best for prolonging end-stage function (d = 0.49, p > 0.05). Finally, combination treatments simultaneously targeting multiple pathophysiological categories (e.g., polytherapy) performed significantly (p < 0.05) better than monotherapies at end-stage.
Discussion: In summary, the most effective pathophysiological treatments change as function of assessment modality and disease progression. Shifting pathophysiological treatment category efficacy with disease progression supports the homeostatic instability theory of ALS disease progression.
Keywords: Amyotrophic Lateral Sclerosis (ALS); SOD1; SOD1 G93A mouse; motoneuron disease; mouse model; neuromuscular; pharmacology.
Copyright © 2023 Lee, Kittel, Kim, Bach, Zhang and Mitchell.
Conflict of interest statement
The authors declare that the research was conducted in the absence of any commercial or financial relationships that could be construed as a potential conflict of interest.
Figures


Similar articles
-
P2X7 antagonism using Brilliant Blue G reduces body weight loss and prolongs survival in female SOD1G93A amyotrophic lateral sclerosis mice.PeerJ. 2017 Mar 1;5:e3064. doi: 10.7717/peerj.3064. eCollection 2017. PeerJ. 2017. PMID: 28265522 Free PMC article.
-
Epothilone D accelerates disease progression in the SOD1G93A mouse model of amyotrophic lateral sclerosis.Neuropathol Appl Neurobiol. 2018 Oct;44(6):590-605. doi: 10.1111/nan.12473. Epub 2018 Mar 27. Neuropathol Appl Neurobiol. 2018. PMID: 29380402
-
Ablation of P2X7 receptor exacerbates gliosis and motoneuron death in the SOD1-G93A mouse model of amyotrophic lateral sclerosis.Hum Mol Genet. 2013 Oct 15;22(20):4102-16. doi: 10.1093/hmg/ddt259. Epub 2013 Jun 4. Hum Mol Genet. 2013. PMID: 23736299
-
Trehalose decreases mutant SOD1 expression and alleviates motor deficiency in early but not end-stage amyotrophic lateral sclerosis in a SOD1-G93A mouse model.Neuroscience. 2015 Jul 9;298:12-25. doi: 10.1016/j.neuroscience.2015.03.061. Epub 2015 Apr 1. Neuroscience. 2015. PMID: 25841320
-
Effects of cannabinoids in Amyotrophic Lateral Sclerosis (ALS) murine models: a systematic review and meta-analysis.J Neurochem. 2019 Apr;149(2):284-297. doi: 10.1111/jnc.14639. Epub 2019 Jan 18. J Neurochem. 2019. PMID: 30520038
Cited by
-
Insights on the Multifaceted Roles of Wild-Type and Mutated Superoxide Dismutase 1 in Amyotrophic Lateral Sclerosis Pathogenesis.Antioxidants (Basel). 2023 Sep 10;12(9):1747. doi: 10.3390/antiox12091747. Antioxidants (Basel). 2023. PMID: 37760050 Free PMC article. Review.
-
Restoring Homeostasis: Treating Amyotrophic Lateral Sclerosis by Resolving Dynamic Regulatory Instability.Int J Mol Sci. 2025 Jan 21;26(3):872. doi: 10.3390/ijms26030872. Int J Mol Sci. 2025. PMID: 39940644 Free PMC article.
-
Pathogenetic Contributions and Therapeutic Implications of Transglutaminase 2 in Neurodegenerative Diseases.Int J Mol Sci. 2024 Feb 17;25(4):2364. doi: 10.3390/ijms25042364. Int J Mol Sci. 2024. PMID: 38397040 Free PMC article. Review.
References
-
- Abe K., Itoyama Y., Sobue G., Tsuji S., Aoki M., Doyu M., et al. (2014). Confirmatory double-blind, parallel-group, placebo-controlled study of efficacy and safety of edaravone (MCI-186) in amyotrophic lateral sclerosis patients. Amyotroph. Lateral Scler. Frontotemporal. Degener. 15 610–617. 10.3109/21678421.2014.959024 - DOI - PMC - PubMed
Grants and funding
LinkOut - more resources
Full Text Sources
Miscellaneous