

Ni loaded SnS2 hexagonal nanosheets for photocatalytic hydrogen generation via water splitting
- PMID: 36741188
- PMCID: PMC9841975
- DOI: 10.1039/d2ra07954b
Ni loaded SnS2 hexagonal nanosheets for photocatalytic hydrogen generation via water splitting
Abstract
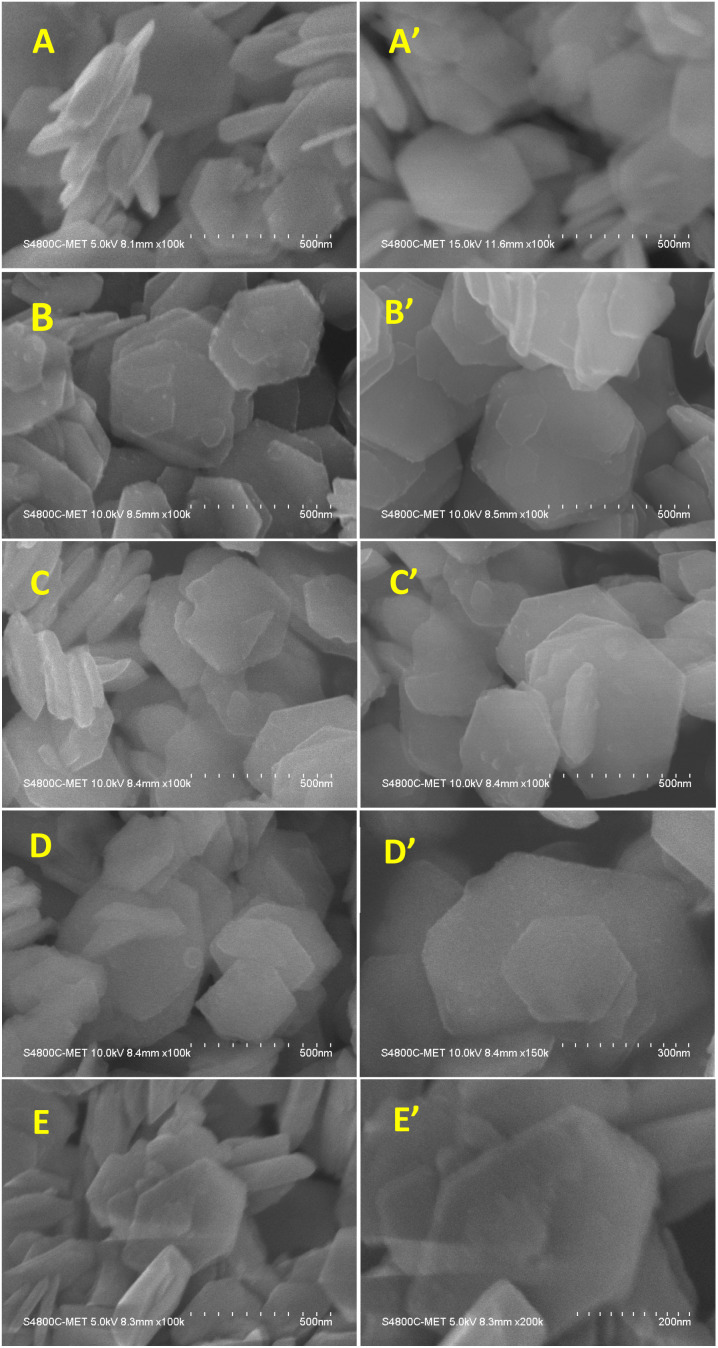
Herein we have prepared the Ni-decorated SnS2 nanosheets with varying concentrations of Ni from 1 to 10 mol% (1, 2.5, 5, and 10 mol%) and studied their various physicochemical and photocatalytic properties. The chemical reduction technique was utilized to load the Ni nanoparticles on SnS2 nanosheets. The synthesized Ni decorated SnS2 (denoted as Ni-SnS2) was characterized using different spectroscopic techniques such as X-ray diffraction, diffuse reflectance UV-vis and photoluminescence spectroscopy, field emission scanning electron microscopy (FESEM), and field emission transmission electron microscopy (FETEM). XRD revealed the formation of the highly crystalline hexagonal phase of SnS2 but for nickel loading there is no additional peak observed. Further, the as-prepared Ni-SnS2 nano-photocatalyst shows absorption behaviour in the visible region, and photoluminescence spectra of the Ni-SnS2 nanostructures show band edge emission centred at 524 nm, and the peak intensity decreases with Ni loading. The FE-SEM and FE-TEM confirm the formation of hexagonal sheets having evenly distributed Ni nanoparticles of size ∼5-10 nm. BET surface area analysis was observed to be enhanced with Ni loading. The photocatalytic performance of the prepared Ni-SnS2 nanosheets was evaluated for hydrogen generation via water splitting under a 400 W mercury vapour lamp. Among the prepared Ni-SnS2 nanostructures, the Ni loaded with 2.5 mol% provided the highest hydrogen production i.e., 1429.2 μmol 0.1 g-1 (% AQE 2.32) in four hours, almost 1.6 times that of pristine SnS2 i.e., 846 μmol 0.1 g-1. Furthermore, the photocatalytic performance of the catalyst is also correlated with the photoconductivity by measuring the photocurrent. The photoconductivity of the samples is revealed to be stable and the conductivity of 2.5 mol% Ni-SnS2 is higher i.e. 20 times that of other Ni-SnS2 and pristine SnS2 catalysts.
This journal is © The Royal Society of Chemistry.
Conflict of interest statement
There is no conflict of interest.
Figures


Similar articles
-
Synthesis of silver-loaded ZnO nanorods and their enhanced photocatalytic activity and photoconductivity study.Photochem Photobiol Sci. 2019 Jun 12;18(6):1503-1511. doi: 10.1039/c9pp00099b. Photochem Photobiol Sci. 2019. PMID: 30972400
-
In-Situ Growth of SnS2 Hexagonal Nanoplates on 2D Ti3C2Tx: An Efficient Nanoheterostructure for Hydrogen Generation and Dye Degradation.Langmuir. 2025 Jul 1;41(25):15892-15908. doi: 10.1021/acs.langmuir.5c00719. Epub 2025 Jun 19. Langmuir. 2025. PMID: 40538030
-
Fabrication of 2D SnS2/g-C3N4 heterojunction with enhanced H2 evolution during photocatalytic water splitting.J Colloid Interface Sci. 2018 Aug 15;524:313-324. doi: 10.1016/j.jcis.2018.04.038. Epub 2018 Apr 10. J Colloid Interface Sci. 2018. PMID: 29655151
-
Highly efficient heterostructured stannic disulfide/stannic anhydride hybrids: Synthesis, morphology, and photocatalytic reduction of chromium (VI) under visible light.J Colloid Interface Sci. 2018 May 15;518:298-306. doi: 10.1016/j.jcis.2018.02.045. Epub 2018 Feb 16. J Colloid Interface Sci. 2018. PMID: 29475051
-
In-situ synthesis of novel Z-scheme SnS(2)/BiOBr photocatalysts with superior photocatalytic efficiency under visible light.J Colloid Interface Sci. 2017 May 1;493:1-9. doi: 10.1016/j.jcis.2016.12.066. Epub 2016 Dec 30. J Colloid Interface Sci. 2017. PMID: 28088115
Cited by
-
In situ synthesis of g-C3N4/Ti3C2Tx nano-heterostructures for enhanced photocatalytic H2 generation via water splitting.RSC Adv. 2023 Dec 4;13(50):35369-35378. doi: 10.1039/d3ra07321a. eCollection 2023 Nov 30. RSC Adv. 2023. PMID: 38053692 Free PMC article.
-
Electroless Ni plated nanostructured TiO2 as a photocatalyst for solar hydrogen production.RSC Adv. 2023 Jul 4;13(29):20068-20080. doi: 10.1039/d3ra03139j. eCollection 2023 Jun 29. RSC Adv. 2023. PMID: 37409038 Free PMC article.
References
-
- Banerjee S. Sharma H. Hazra S. J. Bio-Clean Energy Technol. 2022;2:1–11.
-
- Nnbuife S. G. Johnson J. U. Okeke N. E. Ogbonnaya C. Carbon Capture Sci. Technol. 2022;3:100042.
-
- Ifkovits Z. P. Evans J. M. Meier M. C. Papadantonakis K. M. Lewis N. S. Energy Environ. Sci. 2021;14:4740–4759.
-
- Zhang F. Wang Q. ACS Mater. Lett. 2021;3(5):641–651.
-
- Marlinda A. R. Yusoff N. Sagadevan S. Johan M. R. Int. J. Hydrogen Energy. 2020;45(21):11976–11994.
LinkOut - more resources
Full Text Sources