. 2023 Jan 20:13:1043219.
doi: 10.3389/fimmu.2022.1043219. eCollection 2022.

Blood transcriptome responses in patients correlate with severity of COVID-19 disease

Collaborators, Affiliations

Blood transcriptome responses in patients correlate with severity of COVID-19 disease

Ya Wang et al. Front Immunol. .

Abstract

Background: Coronavirus disease 2019 (COVID-19) is an infectious disease caused by severe acute respiratory syndrome coronavirus 2 (SARS-CoV-2). Infected individuals display a wide spectrum of disease severity, as defined by the World Health Organization (WHO). One of the main factors underlying this heterogeneity is the host immune response, with severe COVID-19 often associated with a hyperinflammatory state.

Aim: Our current study aimed to pinpoint the specific genes and pathways underlying differences in the disease spectrum and outcomes observed, through in-depth analyses of whole blood transcriptomics in a large cohort of COVID-19 participants.

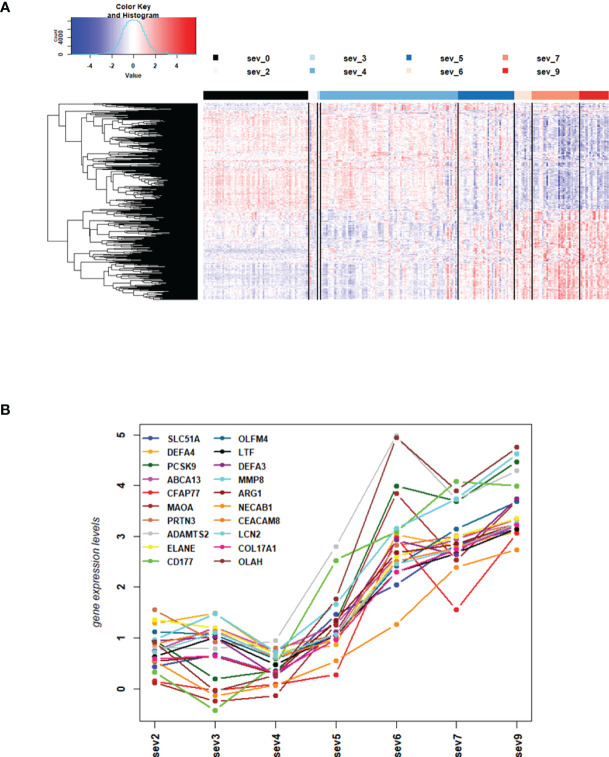
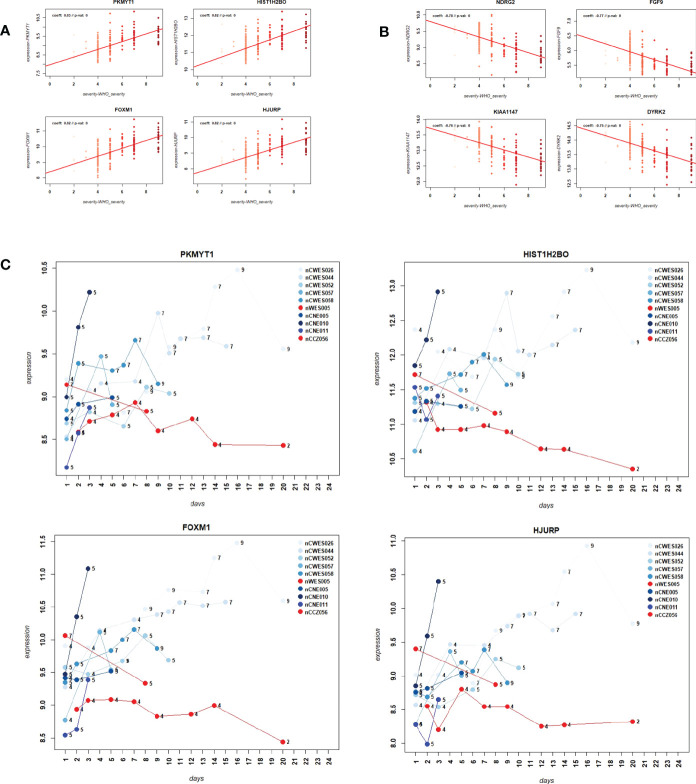
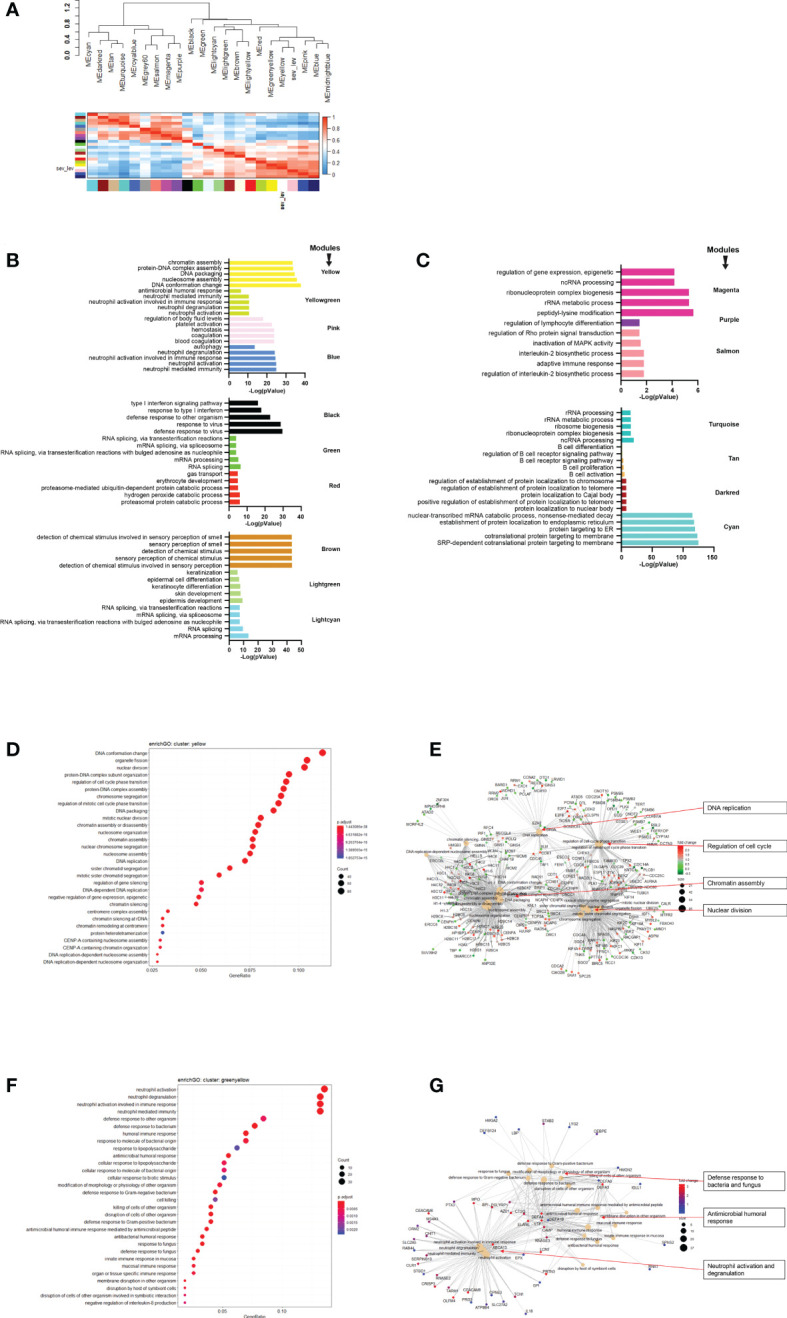
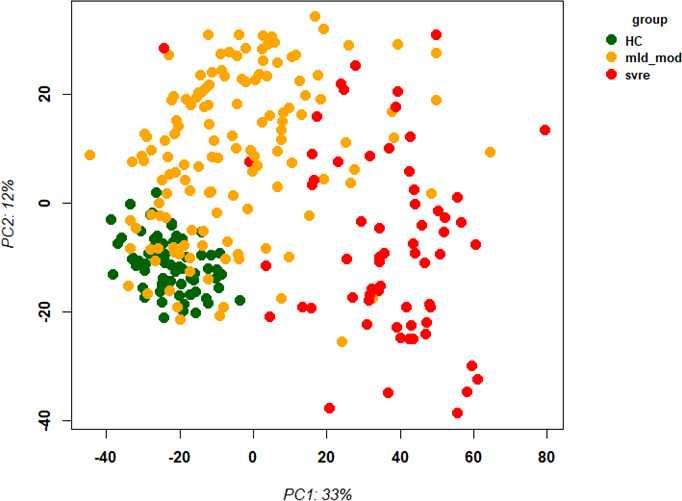
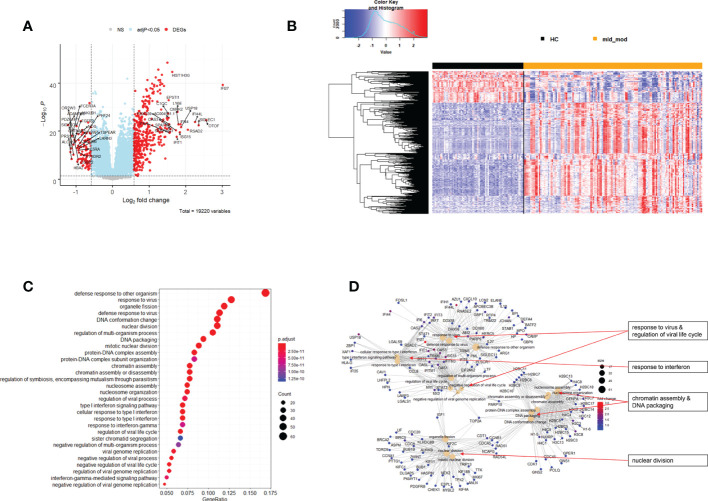
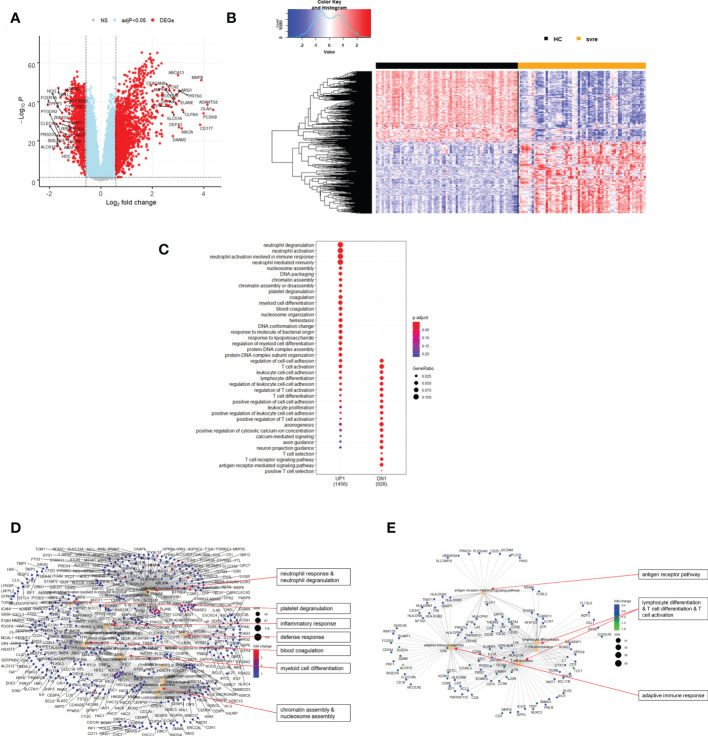
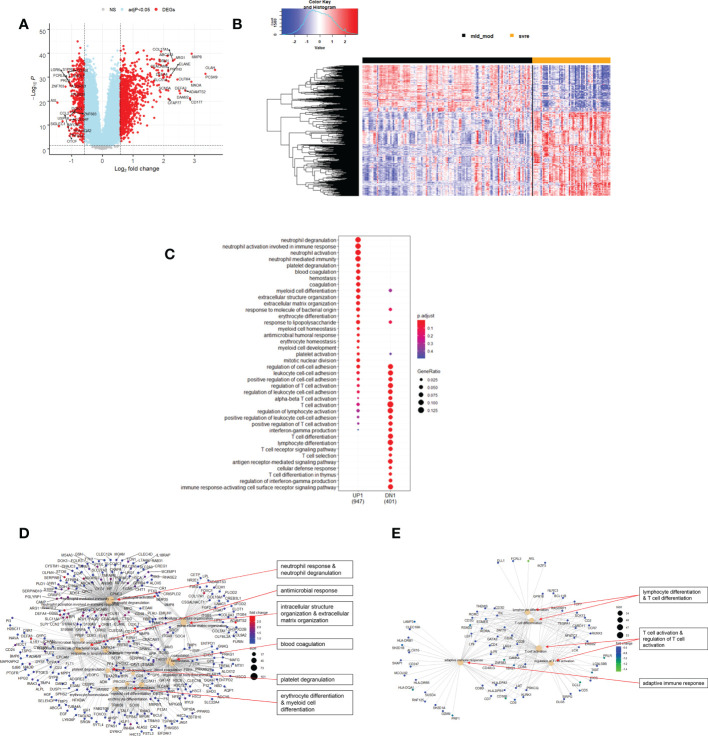
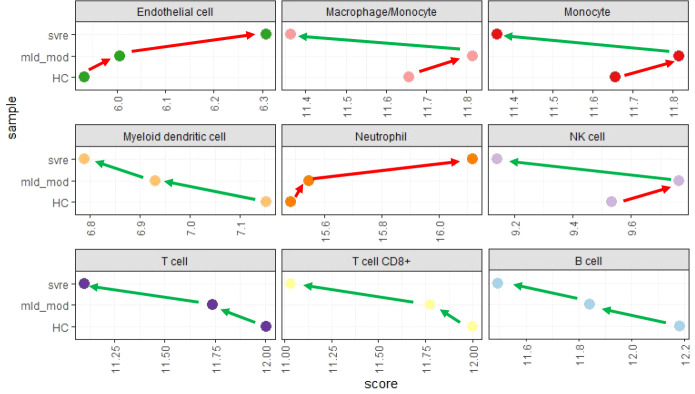
Results: All WHO severity levels were well represented and mild and severe disease displaying distinct gene expression profiles. WHO severity levels 1-4 were grouped as mild disease, and signatures from these participants were different from those with WHO severity levels 6-9 classified as severe disease. Severity level 5 (moderate cases) presented a unique transitional gene signature between severity levels 2-4 (mild/moderate) and 6-9 (severe) and hence might represent the turning point for better or worse disease outcome. Gene expression changes are very distinct when comparing mild/moderate or severe cases to healthy controls. In particular, we demonstrated the hallmark down-regulation of adaptive immune response pathways and activation of neutrophil pathways in severe compared to mild/moderate cases, as well as activation of blood coagulation pathways.

Conclusions: Our data revealed discrete gene signatures associated with mild, moderate, and severe COVID-19 identifying valuable candidates for future biomarker discovery.

Keywords: RNA sequencing; SARS-CoV-2; WGCNA; deconvolution; host immune response.


Conflict of interest statement

The authors declare that the research was conducted in the absence of any commercial or financial relationships that could be construed as a potential conflict of interest.

Figures

Figure 1
Figure 1
Principal Component Analysis (PCA) of all samples. PCA plot of PC1 and PC2. (A) Representing infected participants (COVID) and healthy controls (Healthy) by different colors. (B) Representing infected (COVID) participants by WHO severity (levels 2 to 9) and healthy controls (level 0) by different intensities of red. Abbreviations: 0, 2, 3, 4, 5, 6, 7, and 9 stand for WHO severity level 0, 2, 3, 4, 5, 6, 7, and 9, respectively. Note that our cohort did not have participants at levels 1 and 8.
Figure 2
Figure 2
DEGs from comparisons of WHO severity level groups. (A) Heatmap of expression levels for top 500 DEGs from the comparison of WHO severity levels 7 + 9 versus 4 + 5. Values were scaled by row. red: up-regulated DEGs, blue: down-regulated DEGS, sev0 to sev9: severity levels 0 to 9, respectively. (B) Mean gene expression differences for all severity levels compared to healthy controls for top 20 up-regulated DEGs from the comparison of WHO severity scores 7 + 9 versus 4 + 5. Y-axis: gene expression differences as log fold change, X-axis: severity level groups. Note that our cohort did not have participants at levels 1 and 8. Abbreviations: sev0, 2, 3, 4, 5, 6, 7, and 9 stand for WHO severity level 0, 2, 3, 4, 5, 6, 7, and 9, respectively. These results demonstrate the intermediate (moderate severity) of levels 5 versus mild severity levels (1-4) and severe levels (6-9).
Figure 3
Figure 3
Correlation of gene expression levels with WHO severity levels. (A) Scatter plot for the four most strongly positively correlated DEGs with WHO severity levels. Y-axis: gene expression levels for indicated genes, X-axis: WHO severity levels 0 to 9. (B) Scatter plot for four most strongly negatively correlated DEGs with severity levels. Y-axis: gene expression levels for indicated genes, X-axis: WHO severity levels 0 to 9. (C) Expression levels over time for ten paarticipants for correlated genes PKMYT1, HIST1H2BO, FOXM1 and HJURP. Y-axis: gene expression levels for indicated genes, X-axis: day of sample collection after hospital admission of individual patient. Numbers on the line graphs stand for WHO severity levels at the time of sample collection. Note that not all participants were sampled at all the time points.
Figure 4
Figure 4
Modules from Weighed Gene Correlation Analysis (WGCNA). (A) Dendrogram showing clustering of modules identified by WGCNA. WHO severity levels are correlated with yellow and greenyellow modules. (B)& (C) Bar diagram showing the top 5 (by adjusted p-value) pathways associated with each of the 17 modules as identified by WGCNA. The significance level is indicated as -Log10(adjusted p-value). (D) Functional analysis using GO term enrichment for genes in yellow module showing the 30 most significant pathway annotations. (E) cnetplot illustrating relationship of genes from yellow module to pathways. (F) Functional analysis using GO term enrichment for genes in greenyellow module showing the 30 most significant pathway annotations. (G) cnetplot illustrating relationship of genes from greenyellow cluster to pathways. Nodes in cnetplots represent pathways significantly associated with the genes from the respective module. Genes from the module are connected to these nodes with color-coded log-fold changes from the contrast between severe cases versus healthy controls. Abbreviations: sev_lev stands for WHO severity levels.
Figure 5
Figure 5
Principal Component Analysis (PCA) of all samples. PCA plot of PC1 and PC2 representing different severity categories (mild, moderate, severe, and healthy) by colors. Abbreviations: HC stands for healthy controls; mld_mod stands for mild and moderate; svre stands for severe.
Figure 6
Figure 6
Differential genes expression analysis contrasting mild/moderate cases to healthy controls. (A) Volcano plot of results of the contrast from the linear regression analysis. y-axis: -log10 BH multiple testing adjusted p-values, x-axis: log2 fold change. DEGs (absolute log-fold change > 1.5, corresponding to a log2-fold change > 0.58; multiple testing adjusted p-value < 0.05) are colored red and the top 20 up- and down-regulated (by log-fold change) DEGs are labeled. Blue: genes with adjusted p-value < 0.05. (B) Heatmap of expression levels for DEGs. Values were scaled by row. red: up-regulated DEGs, blue: down-regulated DEGS. HC: healthy controls, mld_mod: mild/moderate pateints. (C) Functional analysis using GO term enrichment for up-regulated DEGs showing 30 most significant pathway annotations. No significant pathways could be identified for the down-regulated genes (D): cnetplot illustrating relationship of DEGs to pathway annotations. Nodes in cnetplots represent pathways significantly associated with the differentially expressed genes. The differentially expressed genes are connected to these nodes with color-coded log-fold changes from the contrast between mild/moderate cases versus healthy controls. Abbreviations: HC stands for healthy controls; mld_mod stands for mild and moderate.
Figure 7
Figure 7
Differential genes expression analysis contrasting severe cases to healthy controls. (A) Volcano plot of results of the contrast from the linear regression analysis. y-axis: -log10 BH multiple testing adjusted p-values, x-axis: log2 fold change. DEGs (absolute log-fold change > 1.5, corresponding to a log2-fold change > 0.58; multiple testing adjusted p-value < 0.05) are colored red and the top 20 up- and down-regulated (by log-fold change) DEGs are labeled. Blue: genes with adjusted p-value < 0.05. (B) Heatmap of expression levels of top 500 (by log fold change) regulated DEGs. Values were scaled by row. red: up-regulated DEGs, blue: down-regulated DEGS. HC: healthy controls, mld/mod: mild/moderate pateints. (C) Functional analysis using GO term enrichment for up- and down-regulated DEGs showing 20 most significant pathway annotations for both groups. (D) cnetplot illustrating relationship of up-regulated DEGs to pathway annotations. (E) cnetplot illustrating relationship of down-regulated DEGs to pathway annotations. Nodes in cnetplots represent pathways significantly associated with the differentially expressed genes. The differentially expressed genes are connected to these nodes with color-coded log-fold changes with color-coded log-fold changes from the contrast between severe cases versus healthy controls. Abbreviations: HC stands for healthy controls; svre stands for severe.
Figure 8
Figure 8
Differential genes expression analysis contrasting mild/moderate to severe cases. (A) Volcano plot of results of the contrast from the linear regression analysis. Y-axis: -log10 BH multiple testing adjusted p-values, x-axis: log2 fold change. DEGs (absolute log-fold change > 1.5, corresponding to a log2-fold change > 0.58; multiple testing adjusted p-value < 0.05) are colored red and the top 20 up- and down-regulated (by log-fold change) DEGs are labeled. Blue: genes with adjusted p-value < 0.05. (B) Heatmap of expression levels of top 500 (by log fold change) regulated DEGs. Values were scaled by row. Red: up-regulated DEGs, blue: down-regulated DEGS. HC: healthy controls, mld/mod: mild/moderate pateints. (C) Functional analysis using GO term enrichment for up- and down-regulated DEGs showing 20 most significant pathway annotations for both groups. (D) cnetplot illustrating relationship of up-regulated DEGs to pathway annotations. (E) cnetplot illustrating relationship of down-regulated DEGs to pathway annotations. Nodes in cnetplots represent pathways significantly associated with the differentially expressed genes. The differentially expressed genes are connected to these nodes with color-coded log-fold changes from the contrast between severe versus mild/moderate cases. Abbreviations: mld_mod stands for mild and moderate; svre stands for severe.
Figure 9
Figure 9
Deconvolution analysis. Mean values for mild/moderate, severe and healthy control groups were calculated and subjected to deconvolution analysis. Y-axis: severity categories, X-axis: scores from mcp_counter analysis for the different cell populations. Abbreviations: HC stands for healthy controls; mld_mod stands for mild and moderate; svre stands for severe.

References

    1. Wu Z, McGoogan JM. Characteristics of and important lessons from the coronavirus disease 2019 (Covid-19) outbreak in China: Summary of a report of 72 314 cases from the Chinese center for disease control and prevention. Jama (2020) 323(13):1239–42. doi: 10.1001/jama.2020.2648 - DOI - PubMed
    1. infection WWGotCCaMoC . A minimal common outcome measure set for covid-19 clinical research. Lancet Infect Dis (2020) 20(8):e192–e7. doi: 10.1016/s1473-3099(20)30483-7 - DOI - PMC - PubMed
    1. Giamarellos-Bourboulis EJ, Netea MG, Rovina N, Akinosoglou K, Antoniadou A, Antonakos N, et al. . Complex immune dysregulation in covid-19 patients with severe respiratory failure. Cell Host Microbe (2020) 27(6):992–1000.e3. doi: 10.1016/j.chom.2020.04.009 - DOI - PMC - PubMed
    1. Chen G, Wu D, Guo W, Cao Y, Huang D, Wang H, et al. . Clinical and immunological features of severe and moderate coronavirus disease 2019. J Clin Invest (2020) 130(5):2620–9. doi: 10.1172/jci137244 - DOI - PMC - PubMed
    1. Del Valle DM, Kim-Schulze S, Huang HH, Beckmann ND, Nirenberg S, Wang B, et al. . An inflammatory cytokine signature predicts covid-19 severity and survival. Nat Med (2020) 26(10):1636–43. doi: 10.1038/s41591-020-1051-9 - DOI - PMC - PubMed

Publication types