

Single-cell RNA-seq reveals cellular heterogeneity from deep fascia in patients with acute compartment syndrome
- PMID: 36741388
- PMCID: PMC9889980
- DOI: 10.3389/fimmu.2022.1062479
Single-cell RNA-seq reveals cellular heterogeneity from deep fascia in patients with acute compartment syndrome
Abstract
Introduction: High stress in the compartment surrounded by the deep fascia can cause acute compartment syndrome (ACS) that may result in necrosis of the limbs. The study aims to investigate the cellular heterogeneity of the deep fascia in ACS patients by single-cell RNA sequencing (scRNA-seq).
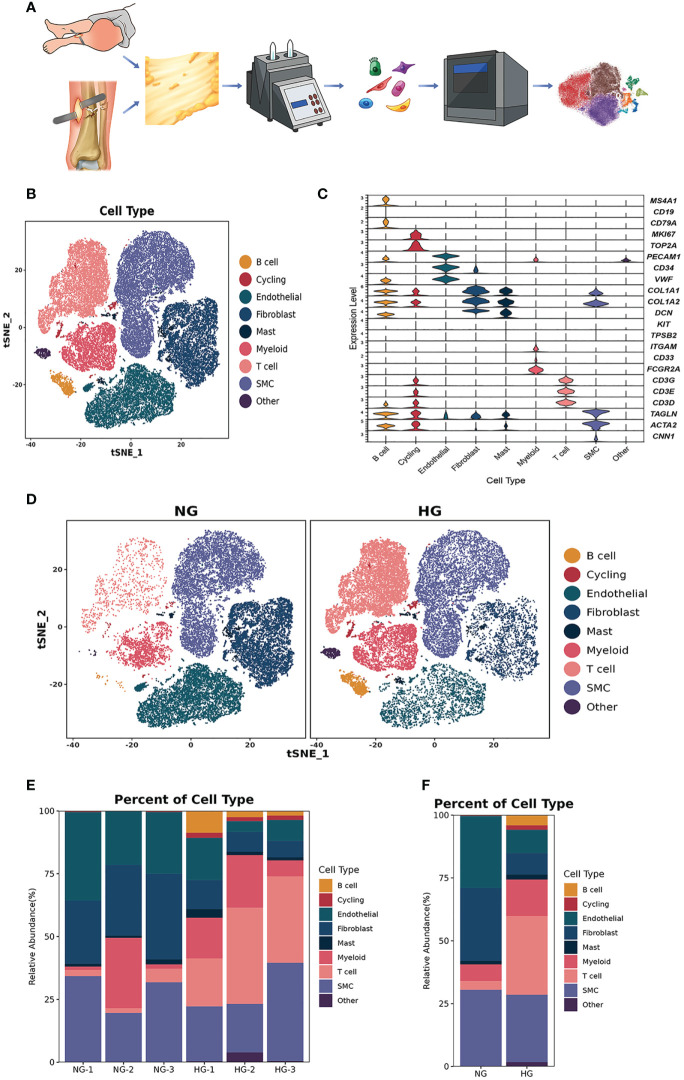
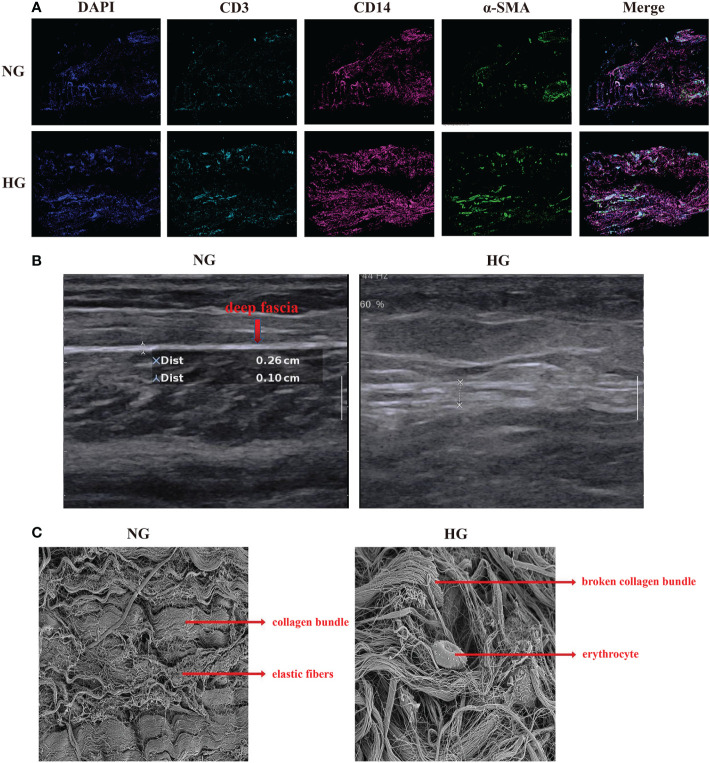
Methods: We collected deep fascia samples from patients with ACS (high-stress group, HG, n=3) and patients receiving thigh amputation due to osteosarcoma (normal-stress group, NG, n=3). We utilized ultrasound and scanning electron microscopy to observe the morphologic change of the deep fascia, used multiplex staining and multispectral imaging to explore immune cell infiltration, and applied scRNA-seq to investigate the cellular heterogeneity of the deep fascia and to identify differentially expressed genes.
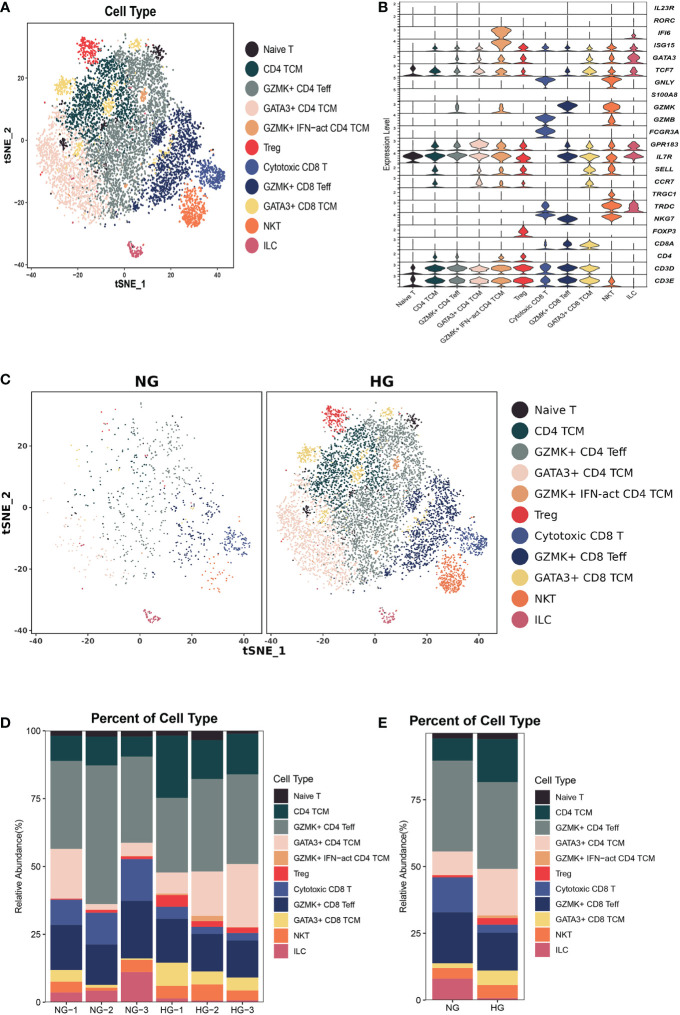
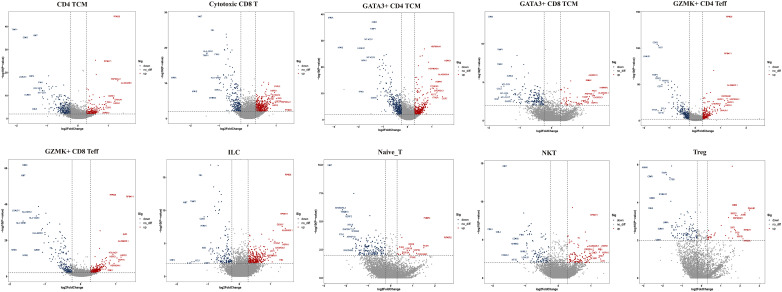
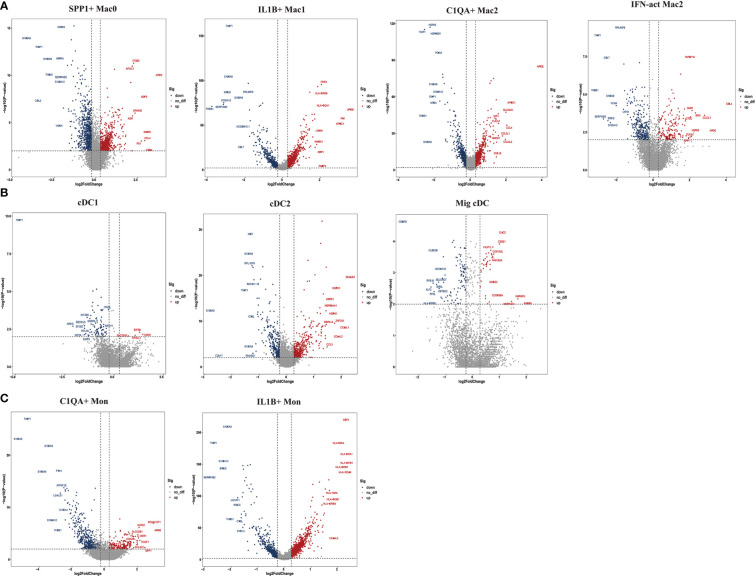
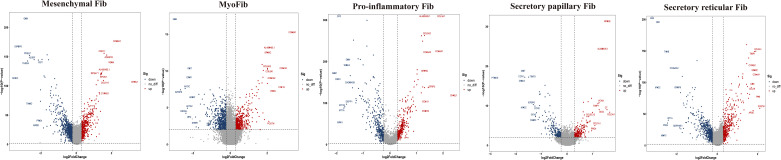
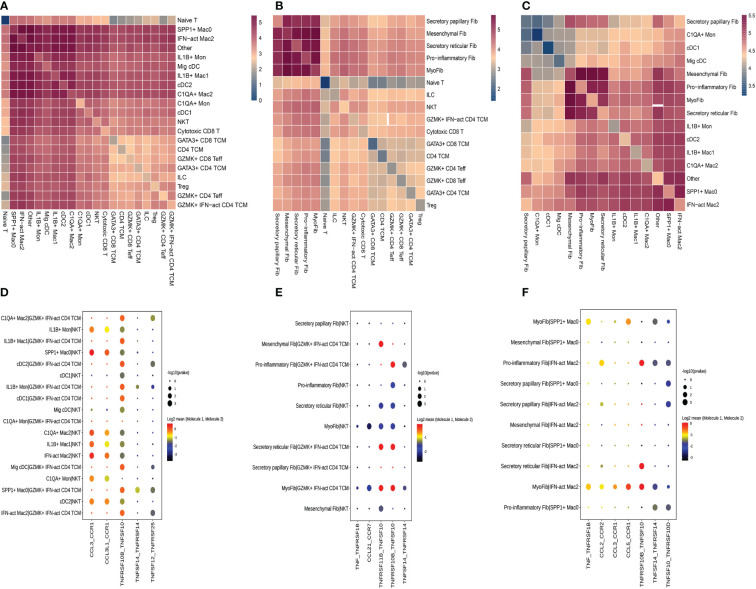
Results: Notably, we identified GZMK+interferon-act CD4 central memory T cells as a specific high-stress compartment subcluster expressing interferon-related genes. Additionally, the changes in the proportions of inflammation-related subclusters, such as the increased proportion of M2 macrophages and decreased proportion of M1 macrophages, may play crucial roles in the balance of pro-inflammatory and anti-inflammatory in the development of ACS. Furthermore, we found that heat shock protein genes were highly expressed but metal ion-related genes (S100 family and metallothionein family) were down-regulated in various subpopulations under high stress.
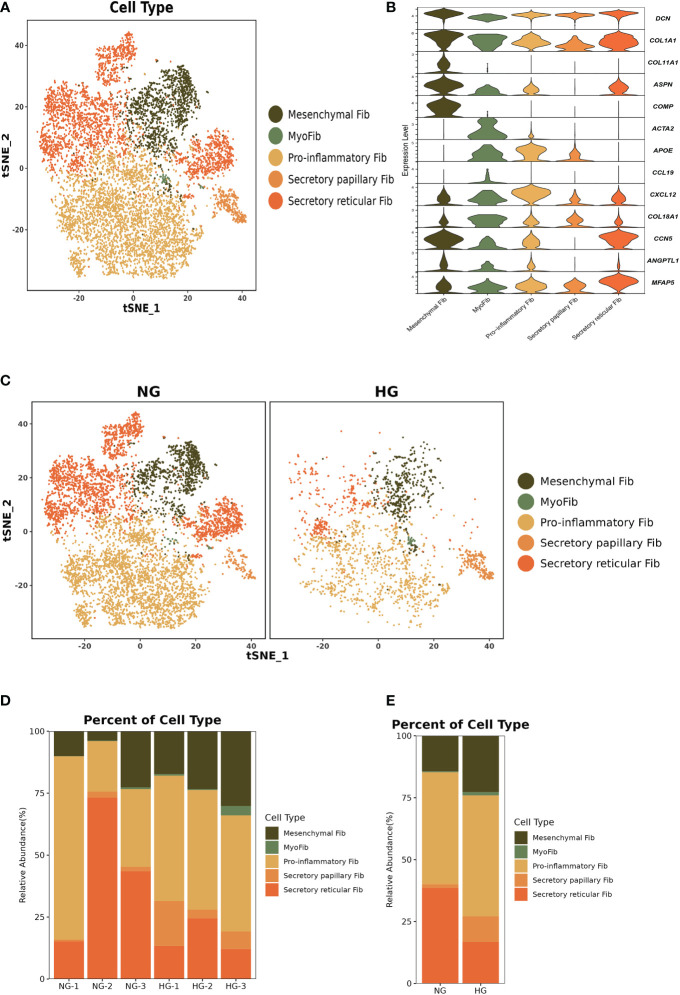
Conclusions: We identified a high stress-specific subcluster and variations in immune cells and fibroblast subclusters, as well as their differentially expressed genes, in ACS patients. Our findings reveal the functions of the deep fascia in the pathophysiology of ACS, providing new approaches for its treatment and prevention.
Keywords: acute compartment syndrome; fibroblast; heat shock protein; immune cell; single cell RNA seq.
Copyright © 2023 Wang, Long, Ma, Dong, Li, Guo, Jin, Di, Zhang, Wang and Hou.
Conflict of interest statement
The authors declare that the research was conducted in the absence of any commercial or financial relationships that could be construed as a potential conflict of interest.
Figures

Similar articles
-
Single-Cell RNA-Seq Uncovers Cellular Heterogeneity from Deep Fascia in Necrotizing Fasciitis Patients.J Inflamm Res. 2025 Jan 22;18:995-1012. doi: 10.2147/JIR.S496650. eCollection 2025. J Inflamm Res. 2025. PMID: 39867946 Free PMC article.
-
Proteomics analysis of deep fascia in acute compartment syndrome.PLoS One. 2024 Jul 1;19(7):e0305275. doi: 10.1371/journal.pone.0305275. eCollection 2024. PLoS One. 2024. PMID: 38950026 Free PMC article.
-
Identification of pro-fibrotic cellular subpopulations in fascia of gluteal muscle contracture using single-cell RNA sequencing.J Transl Med. 2025 Feb 17;23(1):192. doi: 10.1186/s12967-024-05889-y. J Transl Med. 2025. PMID: 39962491 Free PMC article.
-
Aetiology of trauma-related acute compartment syndrome of the leg: A systematic review.Injury. 2019 Jul;50 Suppl 2:S57-S64. doi: 10.1016/j.injury.2019.01.047. Epub 2019 Feb 2. Injury. 2019. PMID: 30772051
-
Acute and chronic compartment syndromes: know when to act fast.JAAPA. 2014 Jun;27(6):23-6. doi: 10.1097/01.JAA.0000446999.10176.13. JAAPA. 2014. PMID: 24819953 Review.
Cited by
-
Olink proteomics analysis uncovers the landscape of inflammation-related proteins in patients with acute compartment syndrome.Front Immunol. 2023 Nov 17;14:1293826. doi: 10.3389/fimmu.2023.1293826. eCollection 2023. Front Immunol. 2023. PMID: 38045696 Free PMC article.
-
Novel perspectives on early diagnosis of acute compartment syndrome: the role of admission blood tests.J Orthop Traumatol. 2024 Nov 13;25(1):54. doi: 10.1186/s10195-024-00800-3. J Orthop Traumatol. 2024. PMID: 39537953 Free PMC article.
-
Mechanism and implications of advanced glycation end products (AGE) and its receptor RAGE axis as crucial mediators linking inflammation and obesity.Mol Biol Rep. 2025 Jun 5;52(1):556. doi: 10.1007/s11033-025-10632-x. Mol Biol Rep. 2025. PMID: 40474023 Review.
-
Targeting high-mobility-group-box-1-mediated inflammation: a promising therapeutic approach for myocardial infarction.Inflammopharmacology. 2025 Feb;33(2):767-784. doi: 10.1007/s10787-024-01586-w. Epub 2024 Nov 2. Inflammopharmacology. 2025. PMID: 39487941 Review.
-
A New Player in the Mechanobiology of Deep Fascia: Yes-Associated Protein (YAP).Int J Mol Sci. 2023 Oct 20;24(20):15389. doi: 10.3390/ijms242015389. Int J Mol Sci. 2023. PMID: 37895068 Free PMC article.
References
Publication types
MeSH terms
Substances
LinkOut - more resources
Full Text Sources
Research Materials