

Identification of IRF-associated molecular subtypes in clear cell renal cell carcinoma to characterize immunological characteristics and guide therapy
- PMID: 36741716
- PMCID: PMC9892447
- DOI: 10.3389/fonc.2022.1118472
Identification of IRF-associated molecular subtypes in clear cell renal cell carcinoma to characterize immunological characteristics and guide therapy
Abstract
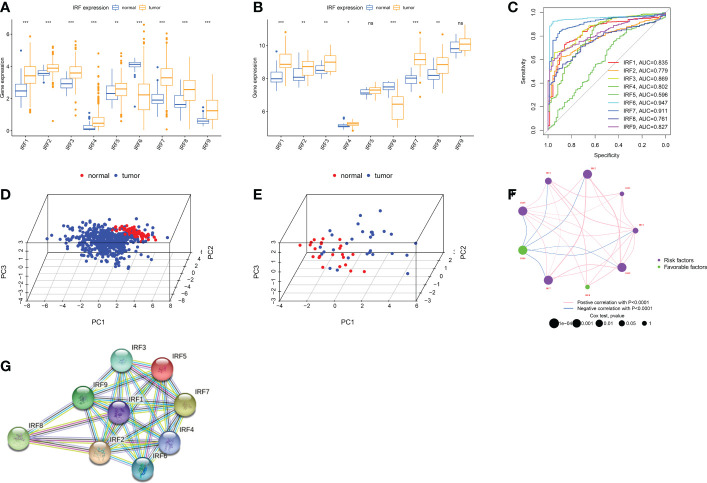
Background: Recently studies have identified a critical role for interferon regulatory factor (IRF) in modulating tumour immune microenvironment (TME) infiltration and tumorigenesis.
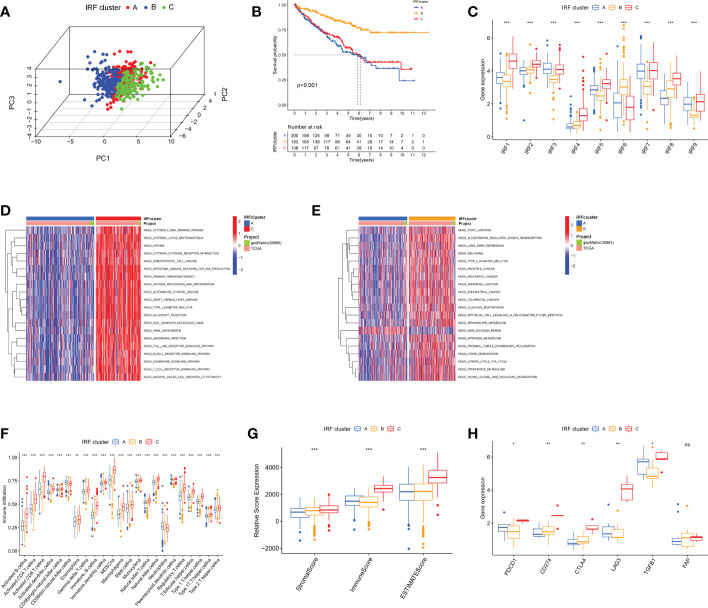
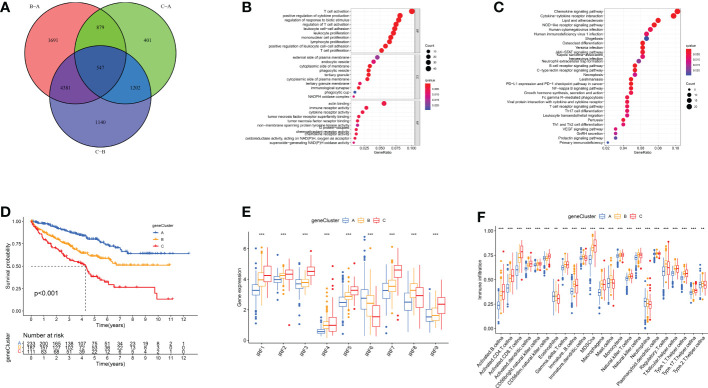
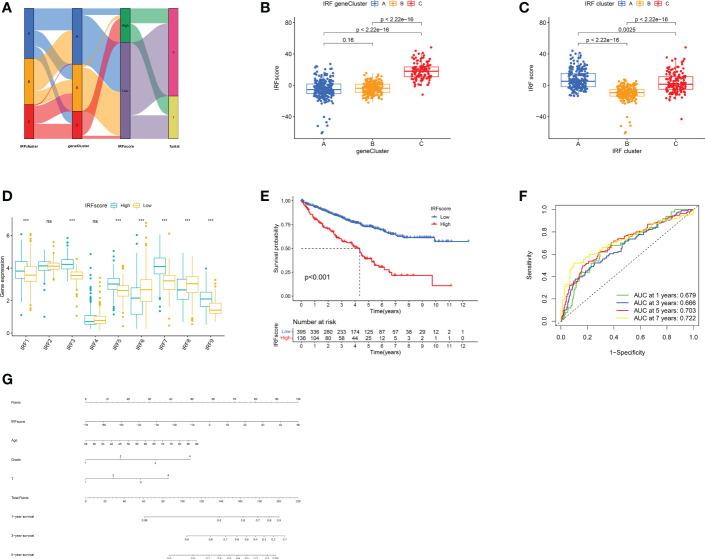
Methods: Based on IRF1-9 expression profiles, we classified all ccRCC samples into three molecular subtypes (clusters A-C) and characterized the prognosis and immune infiltration of these clusters. IRFscore constructed by principal component analysis was performed to quantify IRF-related subtypes in individual patients.
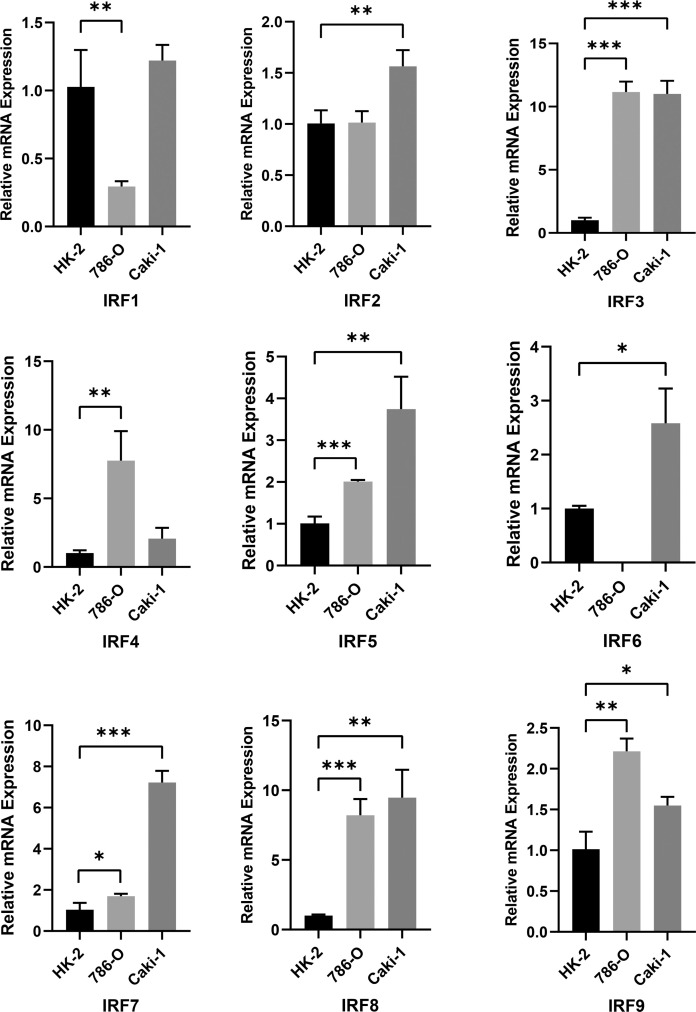
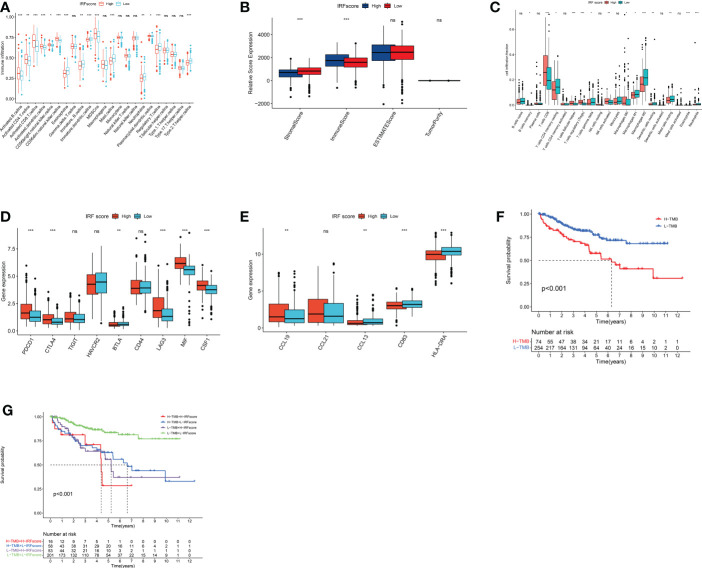
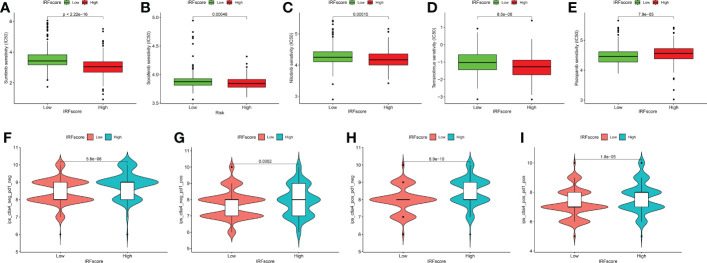
Results: We proved that IRFscore predicted multiple patient characteristics, with high IRFscore group having poorer prognosis, suppressed TME, increased T-cell exhaustion, increased TMB and greater sensitivity to anti- PD-1/CTLA-4 therapies. Furthermore, analysis of metastatic ccRCC (mccRCC) molecular subtypes and drug sensitivity proved that low IRFscore was more sensitive to targeted therapies. Moreover, IRFscore grouping can be well matched to the immunological and molecular typing of ccRCC. qRT-PCR showed differential expression of IRFs in different cell lines.
Conclusions: Evaluating IRF-related molecular subtypes in individual ccRCC patients not only facilitates our understanding of tumour immune infiltration, but also provides more effective clinical ideas for personalised treatment.
Keywords: IRF family; ccRCC; immunotherapy; t cell exhaustion; targeted therapy; tumour microenvironment.
Copyright © 2023 Chen, Chen, Yang, Zhang, Shao and Xu.
Conflict of interest statement
The authors declare that the research was conducted in the absence of any commercial or financial relationships that could be construed as a potential conflict of interest.
Figures
Similar articles
-
Construction of an interferon regulatory factors-related risk model for predicting prognosis, immune microenvironment and immunotherapy in clear cell renal cell carcinoma.Front Oncol. 2023 Apr 27;13:1131191. doi: 10.3389/fonc.2023.1131191. eCollection 2023. Front Oncol. 2023. PMID: 37182129 Free PMC article.
-
Neutrophil extracellular traps-associated modification patterns depict the tumor microenvironment, precision immunotherapy, and prognosis of clear cell renal cell carcinoma.Front Oncol. 2022 Dec 22;12:1094248. doi: 10.3389/fonc.2022.1094248. eCollection 2022. Front Oncol. 2022. PMID: 36620592 Free PMC article.
-
Computational construction of TME-related lncRNAs signature for predicting prognosis and immunotherapy response in clear cell renal cell carcinoma.J Clin Lab Anal. 2022 Aug;36(8):e24582. doi: 10.1002/jcla.24582. Epub 2022 Jul 8. J Clin Lab Anal. 2022. PMID: 35808868 Free PMC article.
-
A signature based on m6A pattern and tumor microenvironment infiltration in clear cell renal cell carcinoma.Am J Transl Res. 2022 Jul 15;14(7):4931-4947. eCollection 2022. Am J Transl Res. 2022. PMID: 35958449 Free PMC article.
-
The Tumor Immune Microenvironment in Clear Cell Renal Cell Carcinoma.Int J Mol Sci. 2023 Apr 27;24(9):7946. doi: 10.3390/ijms24097946. Int J Mol Sci. 2023. PMID: 37175653 Free PMC article. Review.
Cited by
-
Inflammation and Immunity Gene Expression Patterns and Machine Learning Approaches in Association with Response to Immune-Checkpoint Inhibitors-Based Treatments in Clear-Cell Renal Carcinoma.Cancers (Basel). 2023 Nov 29;15(23):5637. doi: 10.3390/cancers15235637. Cancers (Basel). 2023. PMID: 38067341 Free PMC article.
References
LinkOut - more resources
Full Text Sources