. 2022 May;2(5):379-388.
doi: 10.1038/s43587-022-00196-x. Epub 2022 Apr 11.

Limited Proteolysis-Mass Spectrometry Reveals Aging-Associated Changes in Cerebrospinal Fluid Protein Abundances and Structures

Affiliations

Limited Proteolysis-Mass Spectrometry Reveals Aging-Associated Changes in Cerebrospinal Fluid Protein Abundances and Structures

Steven R Shuken et al. Nat Aging. 2022 May.

Erratum in

Abstract

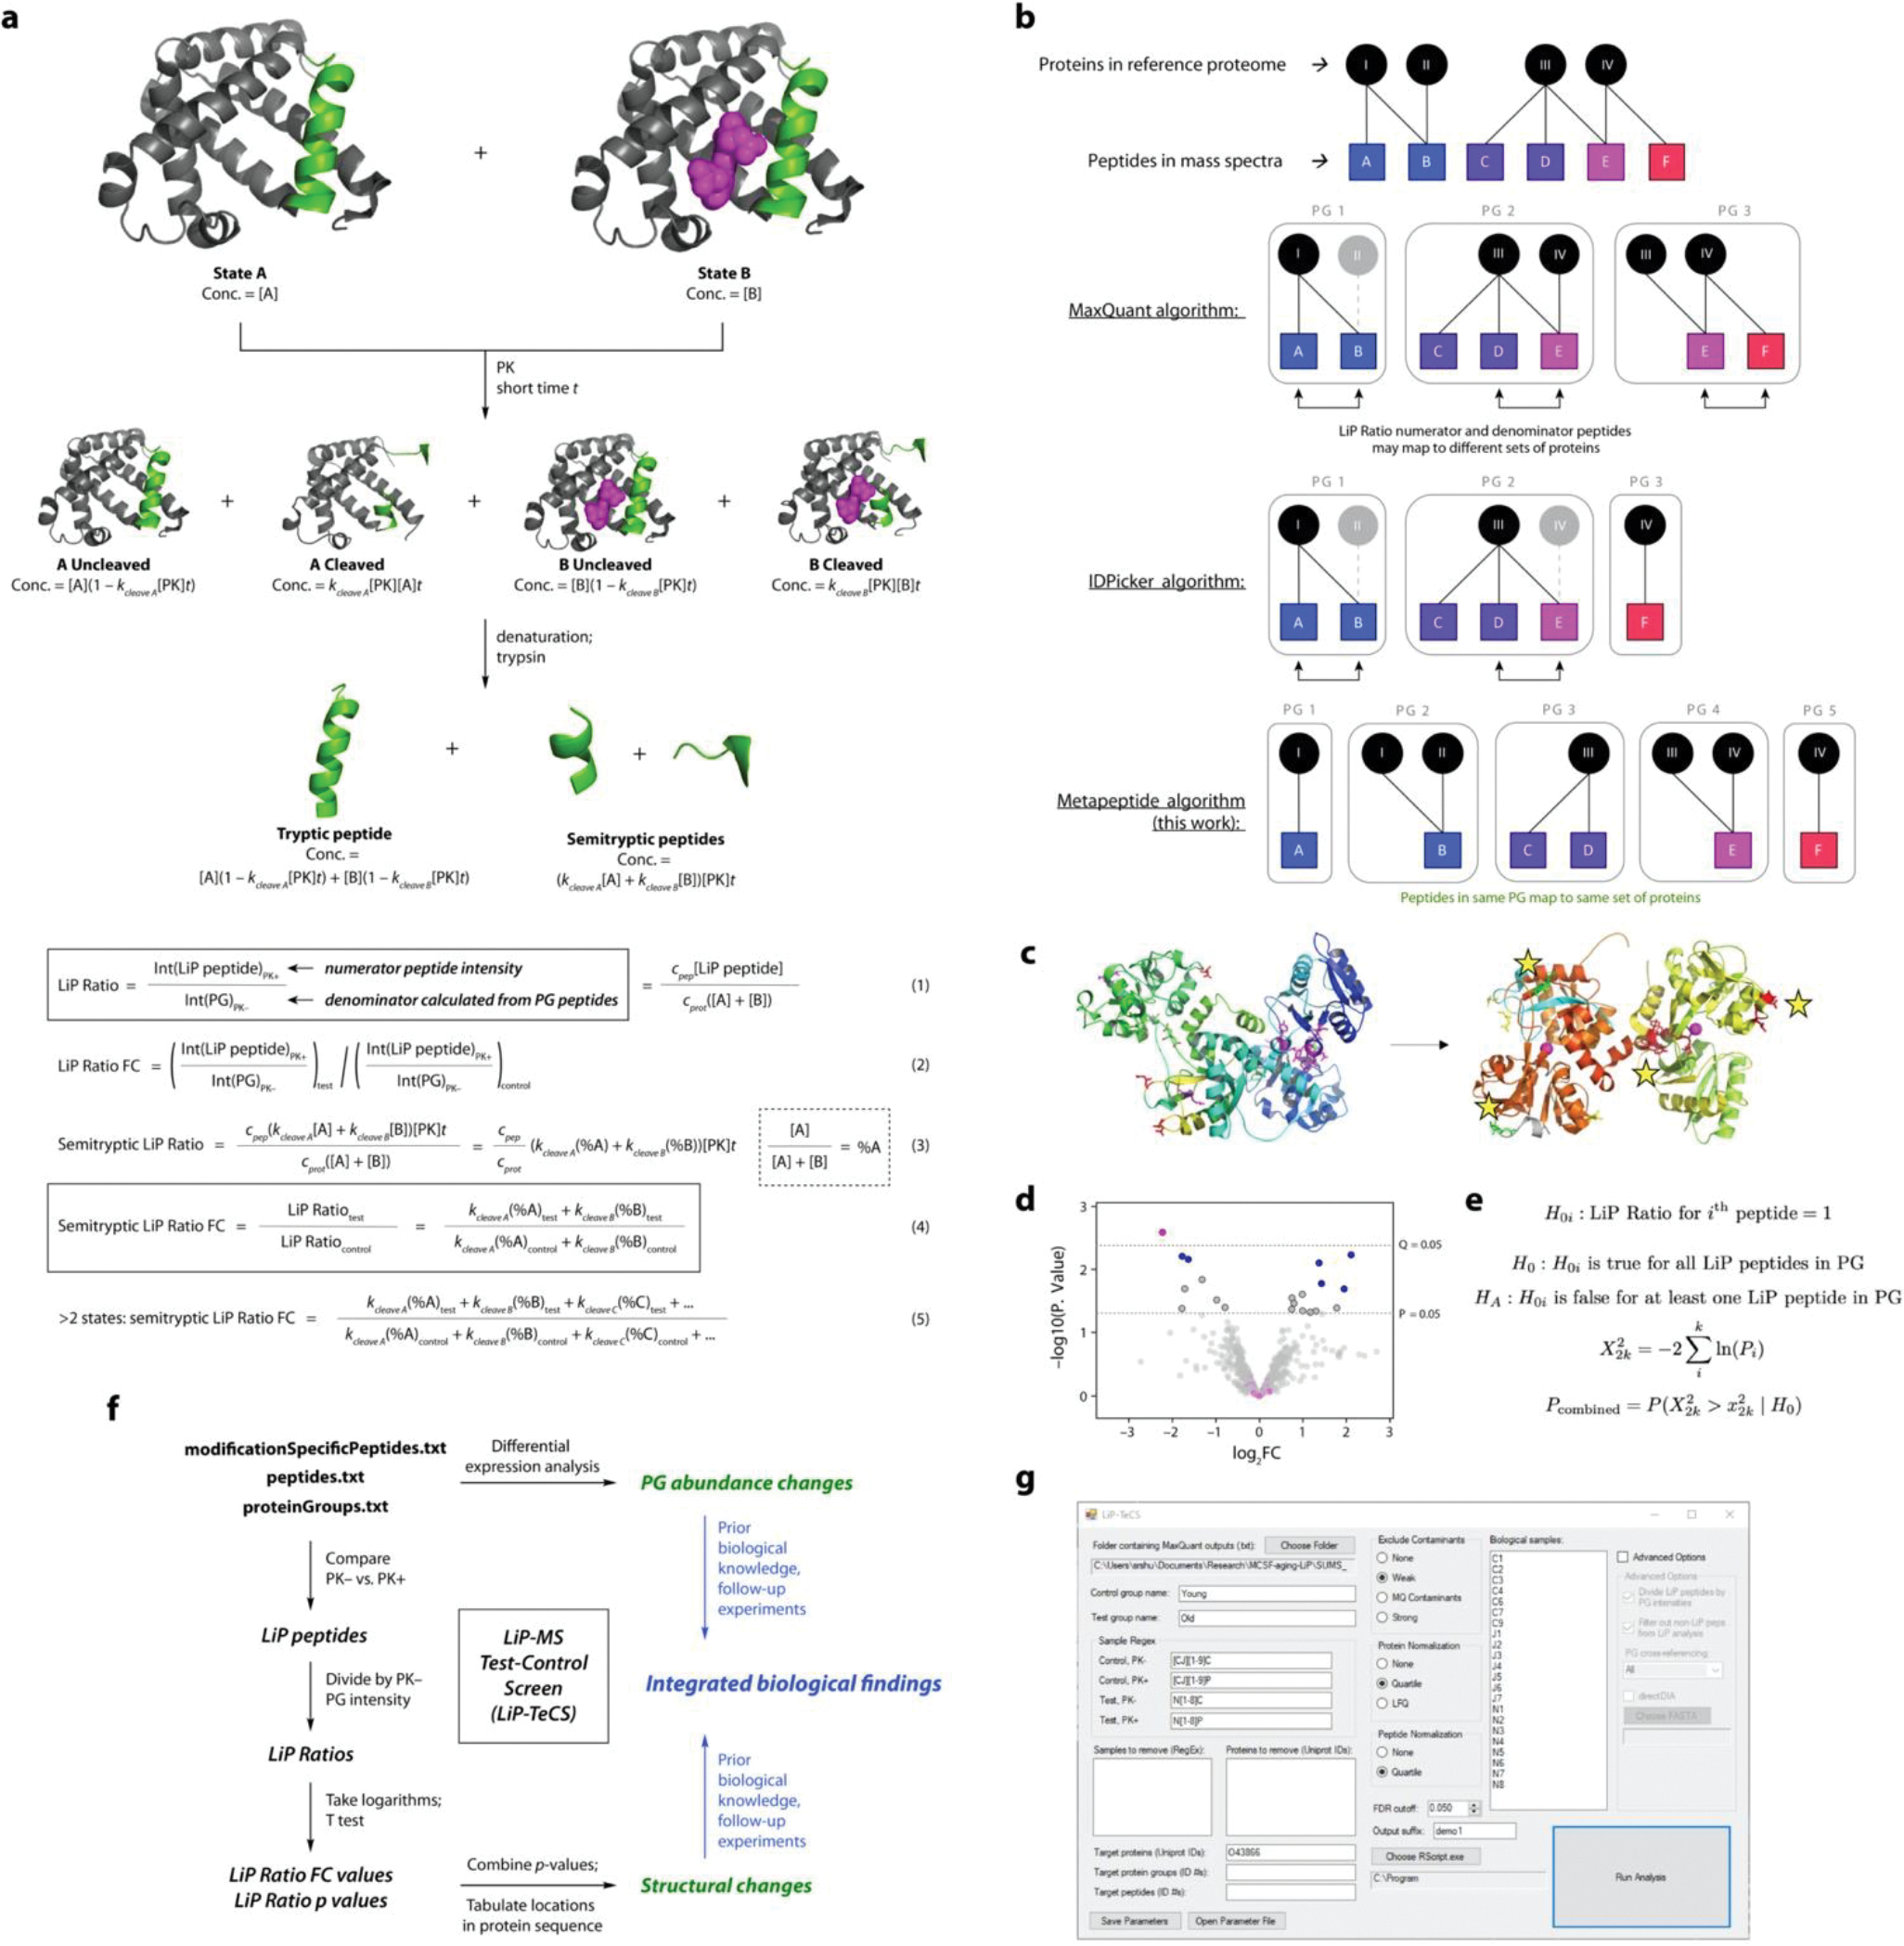
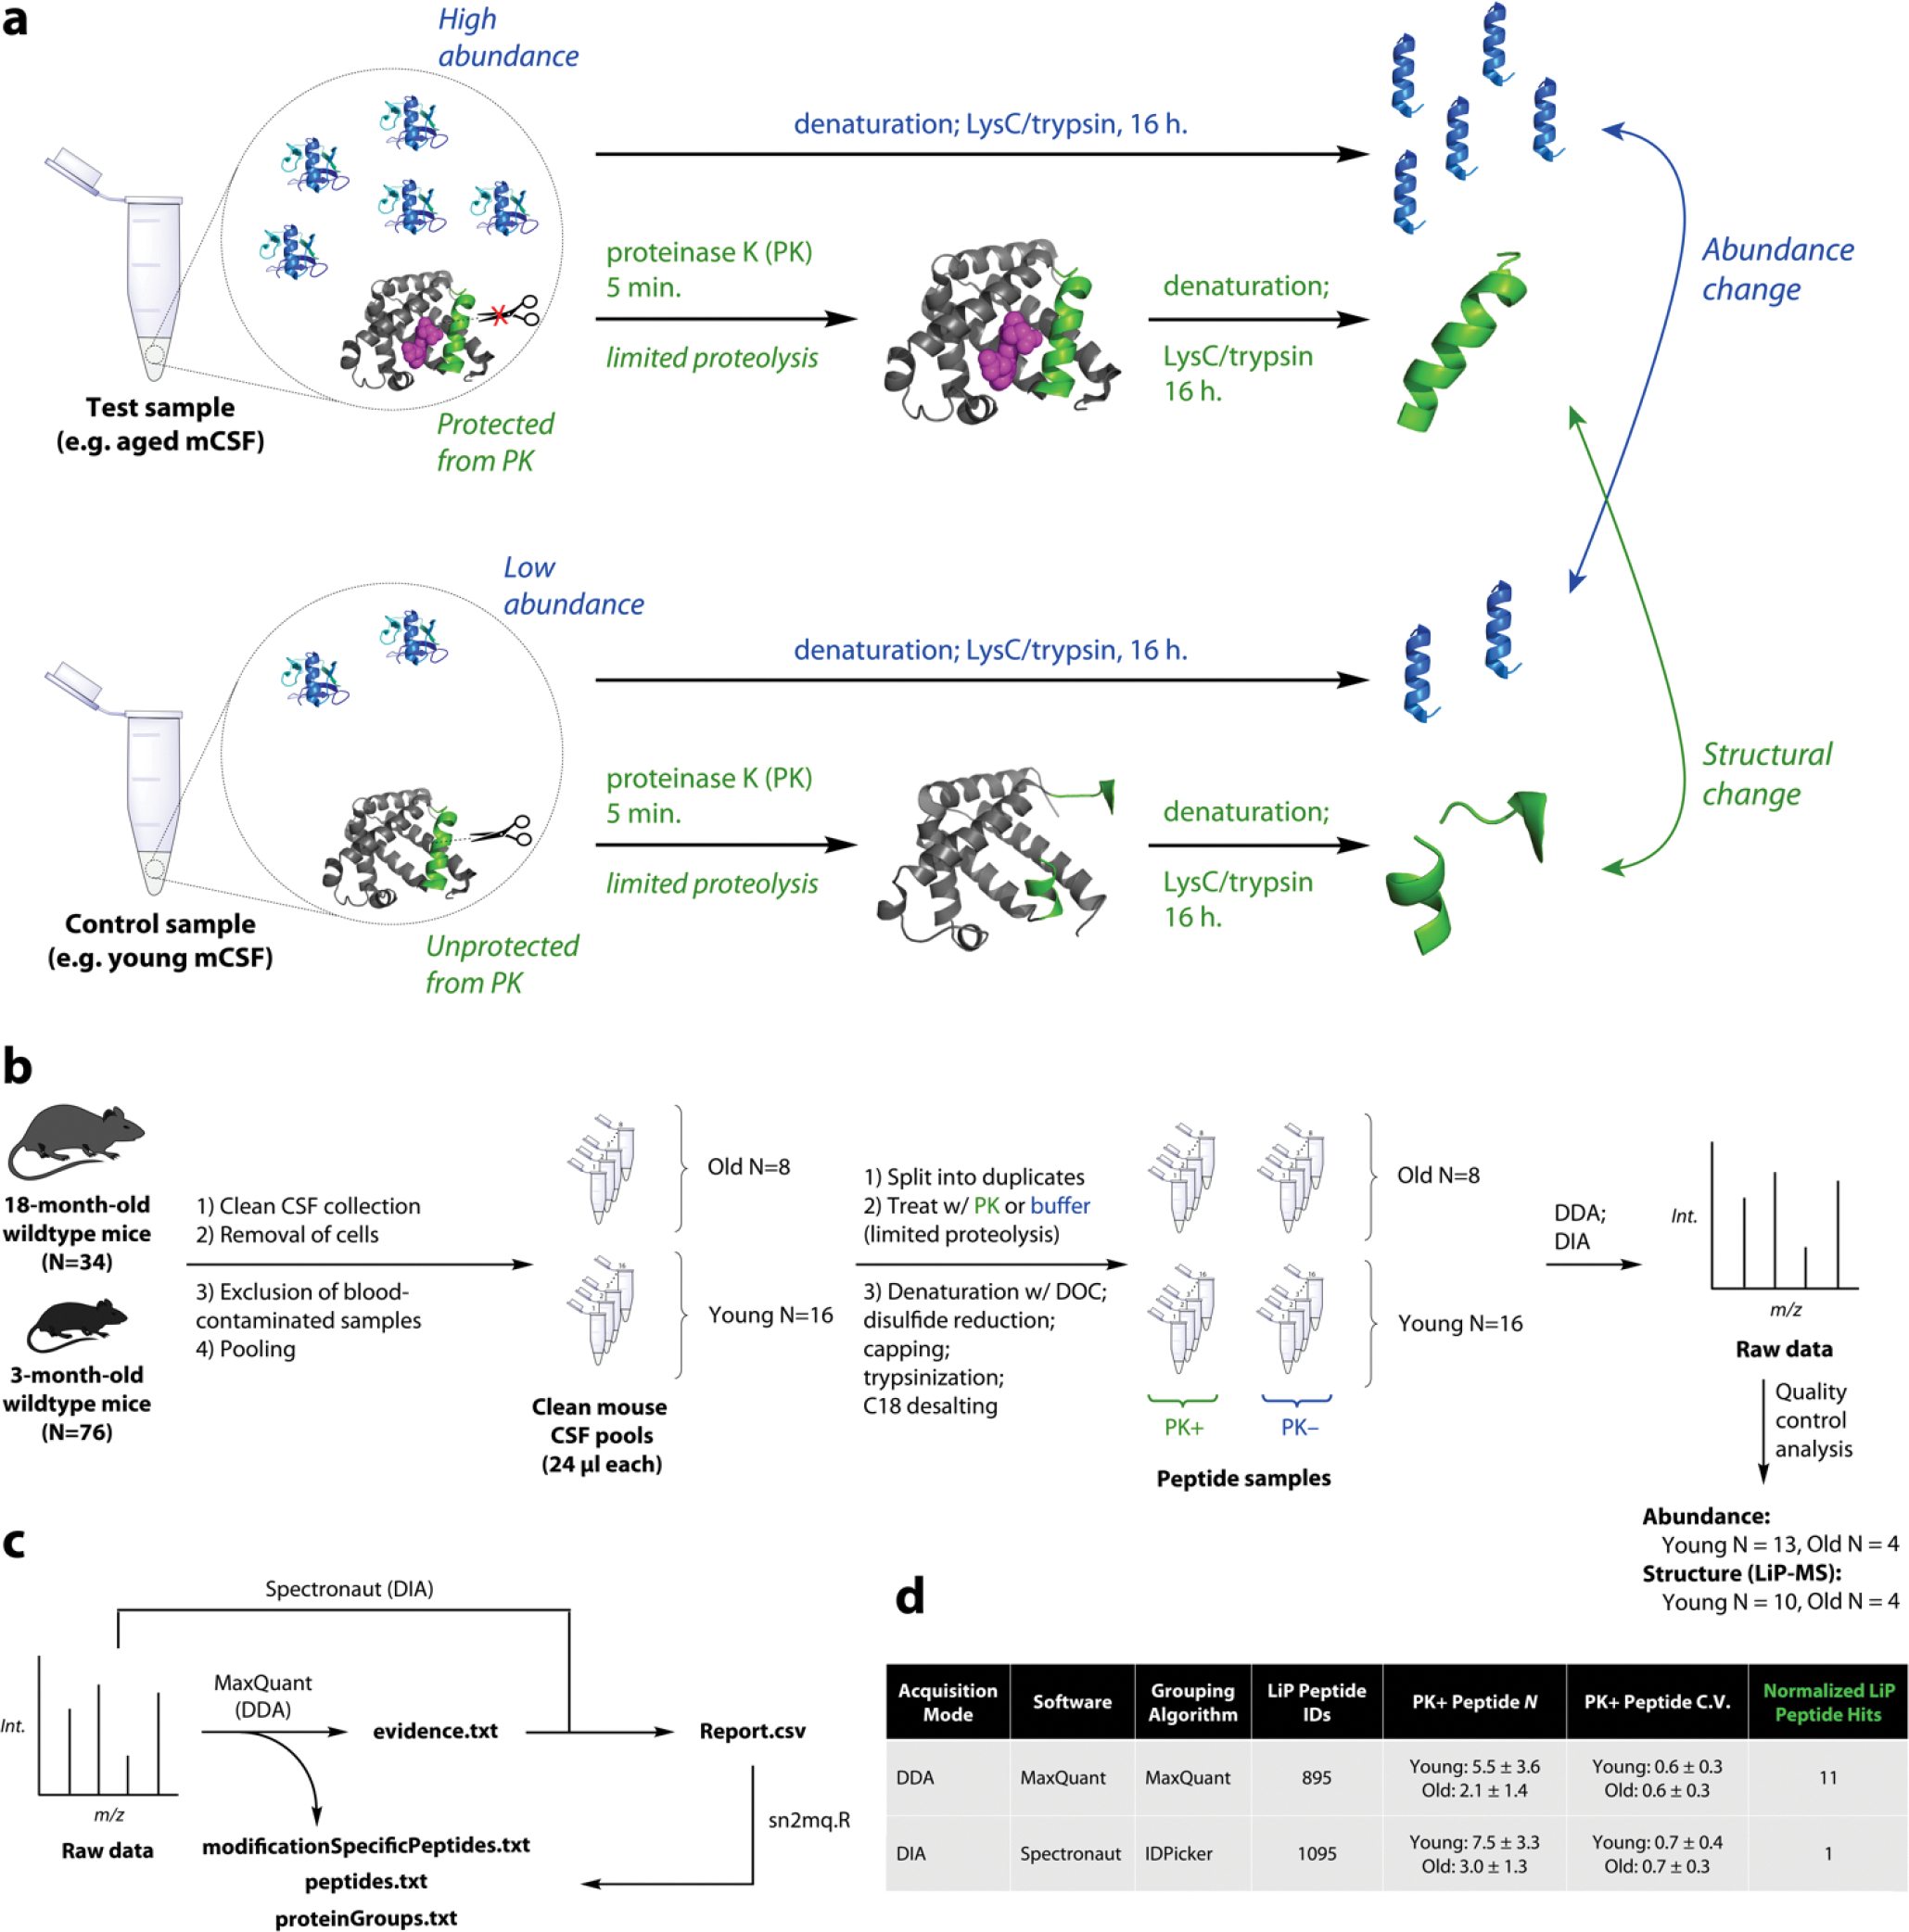
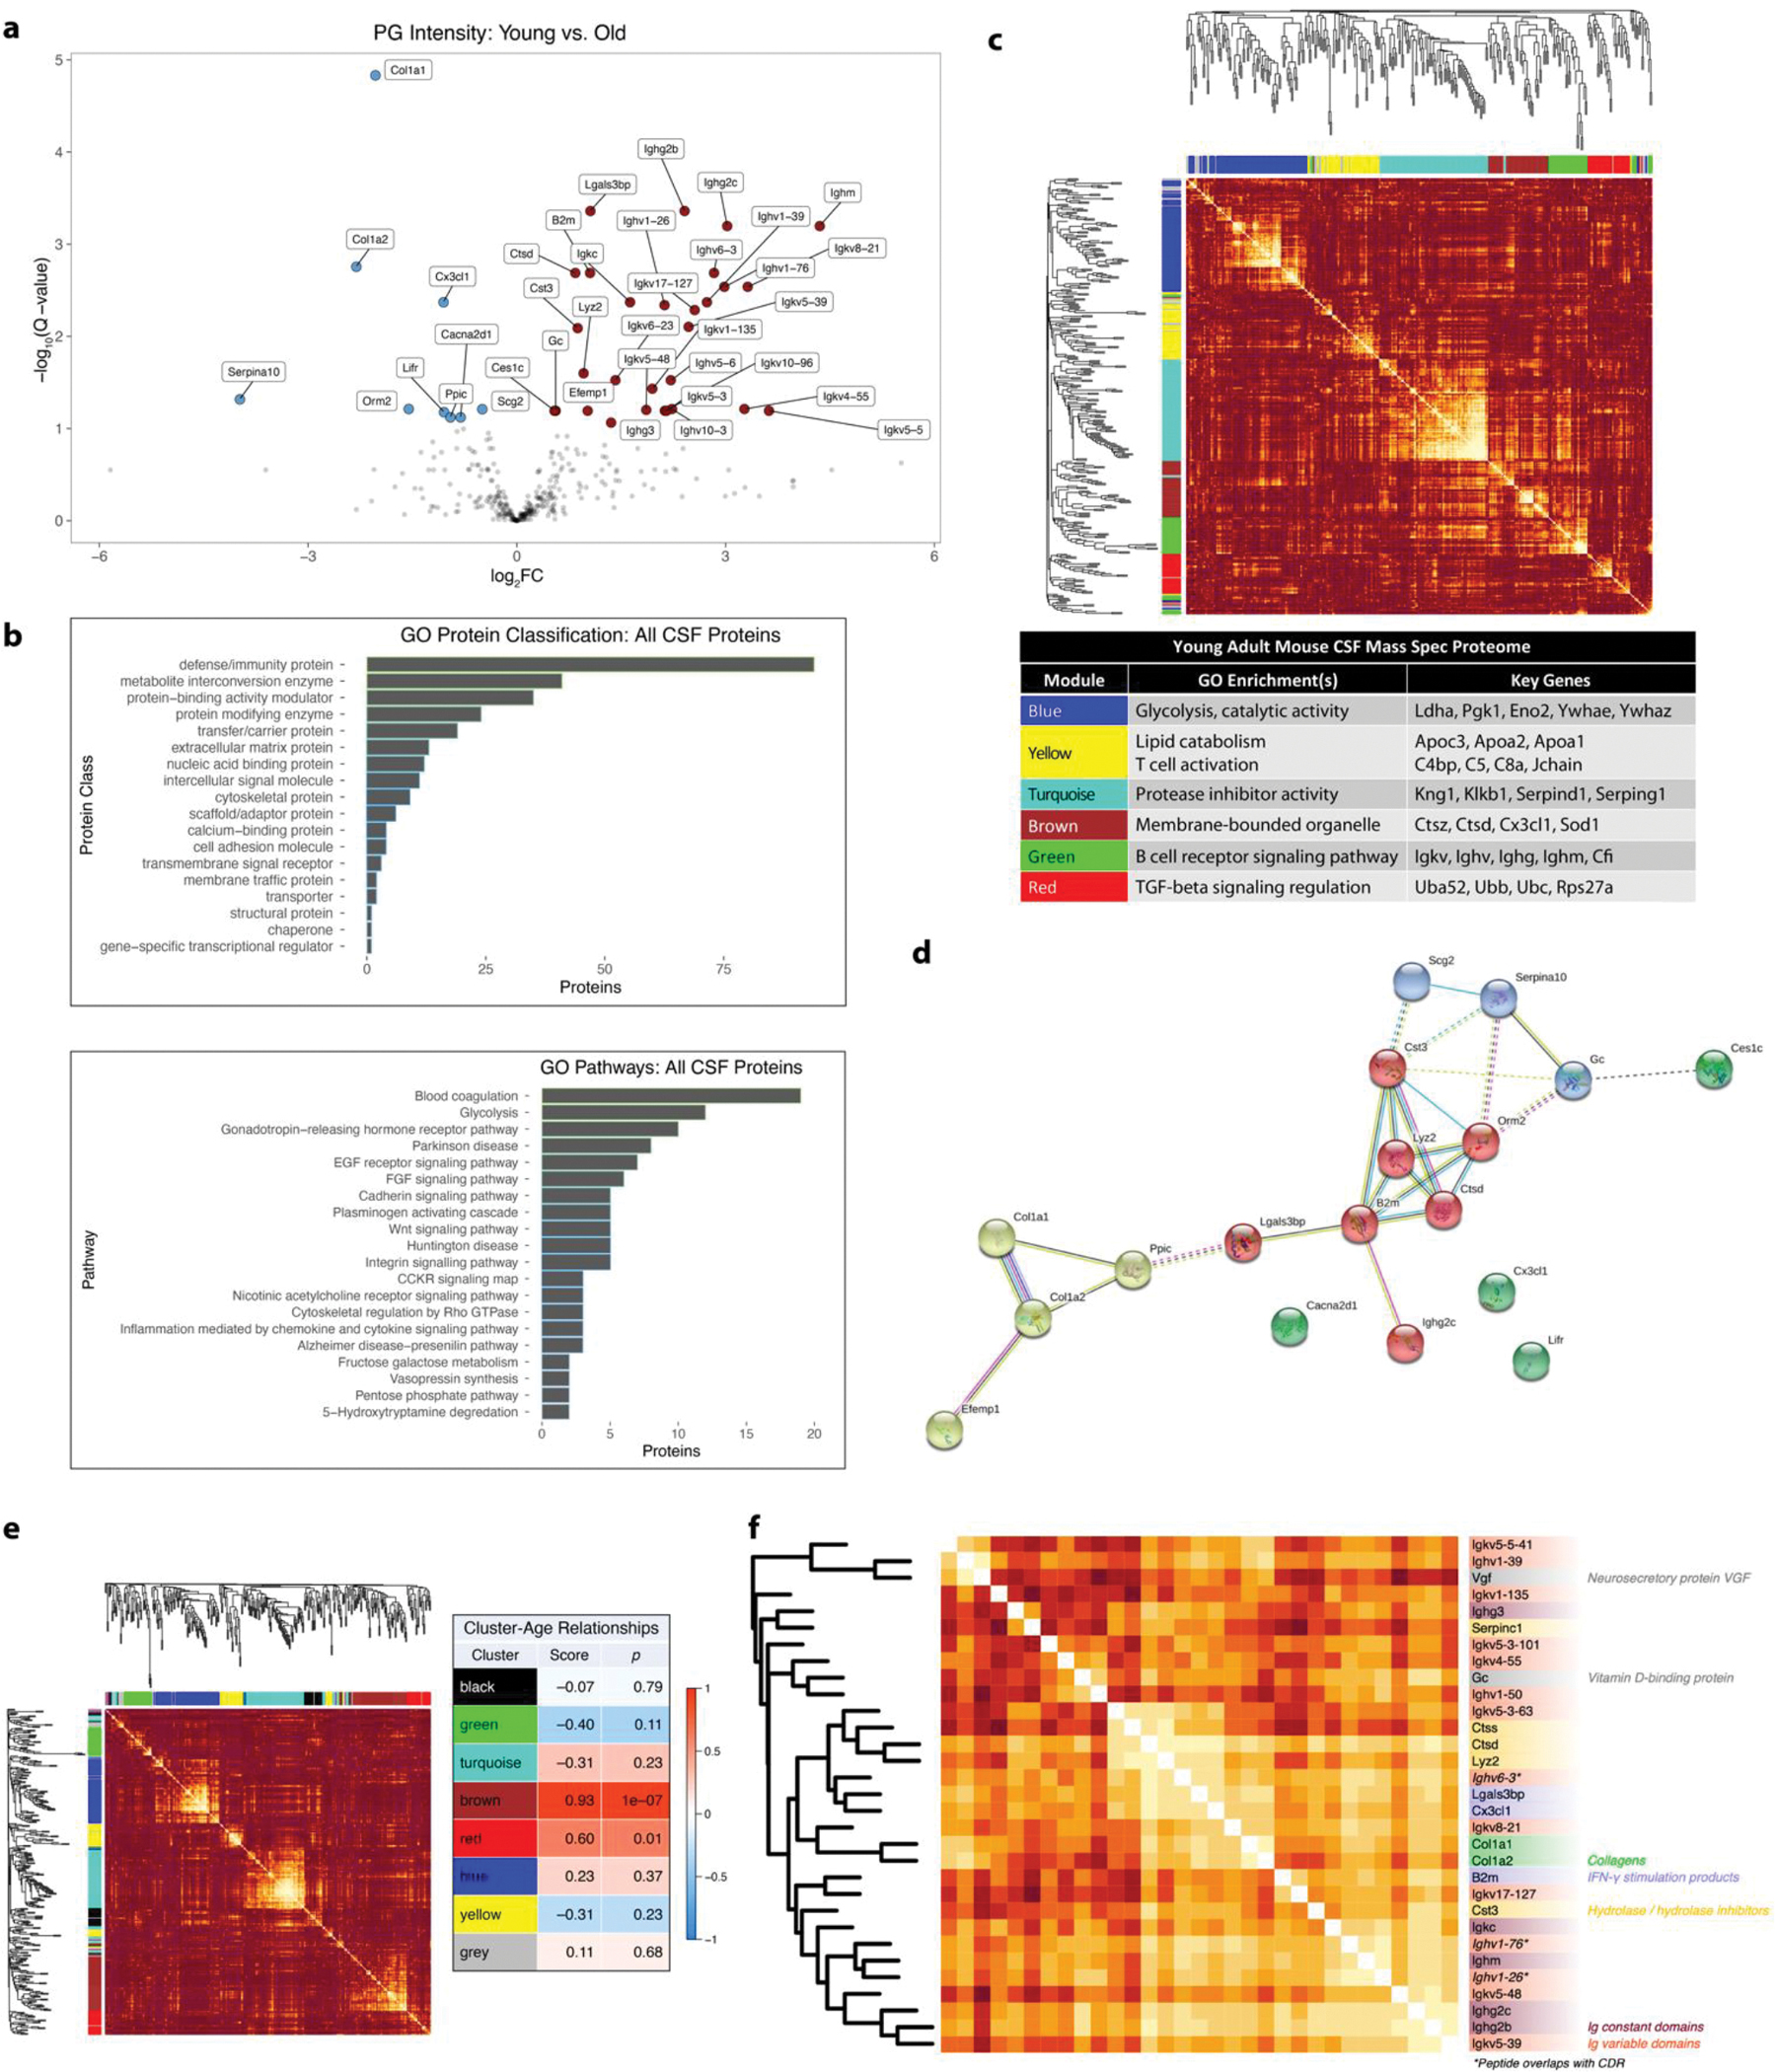
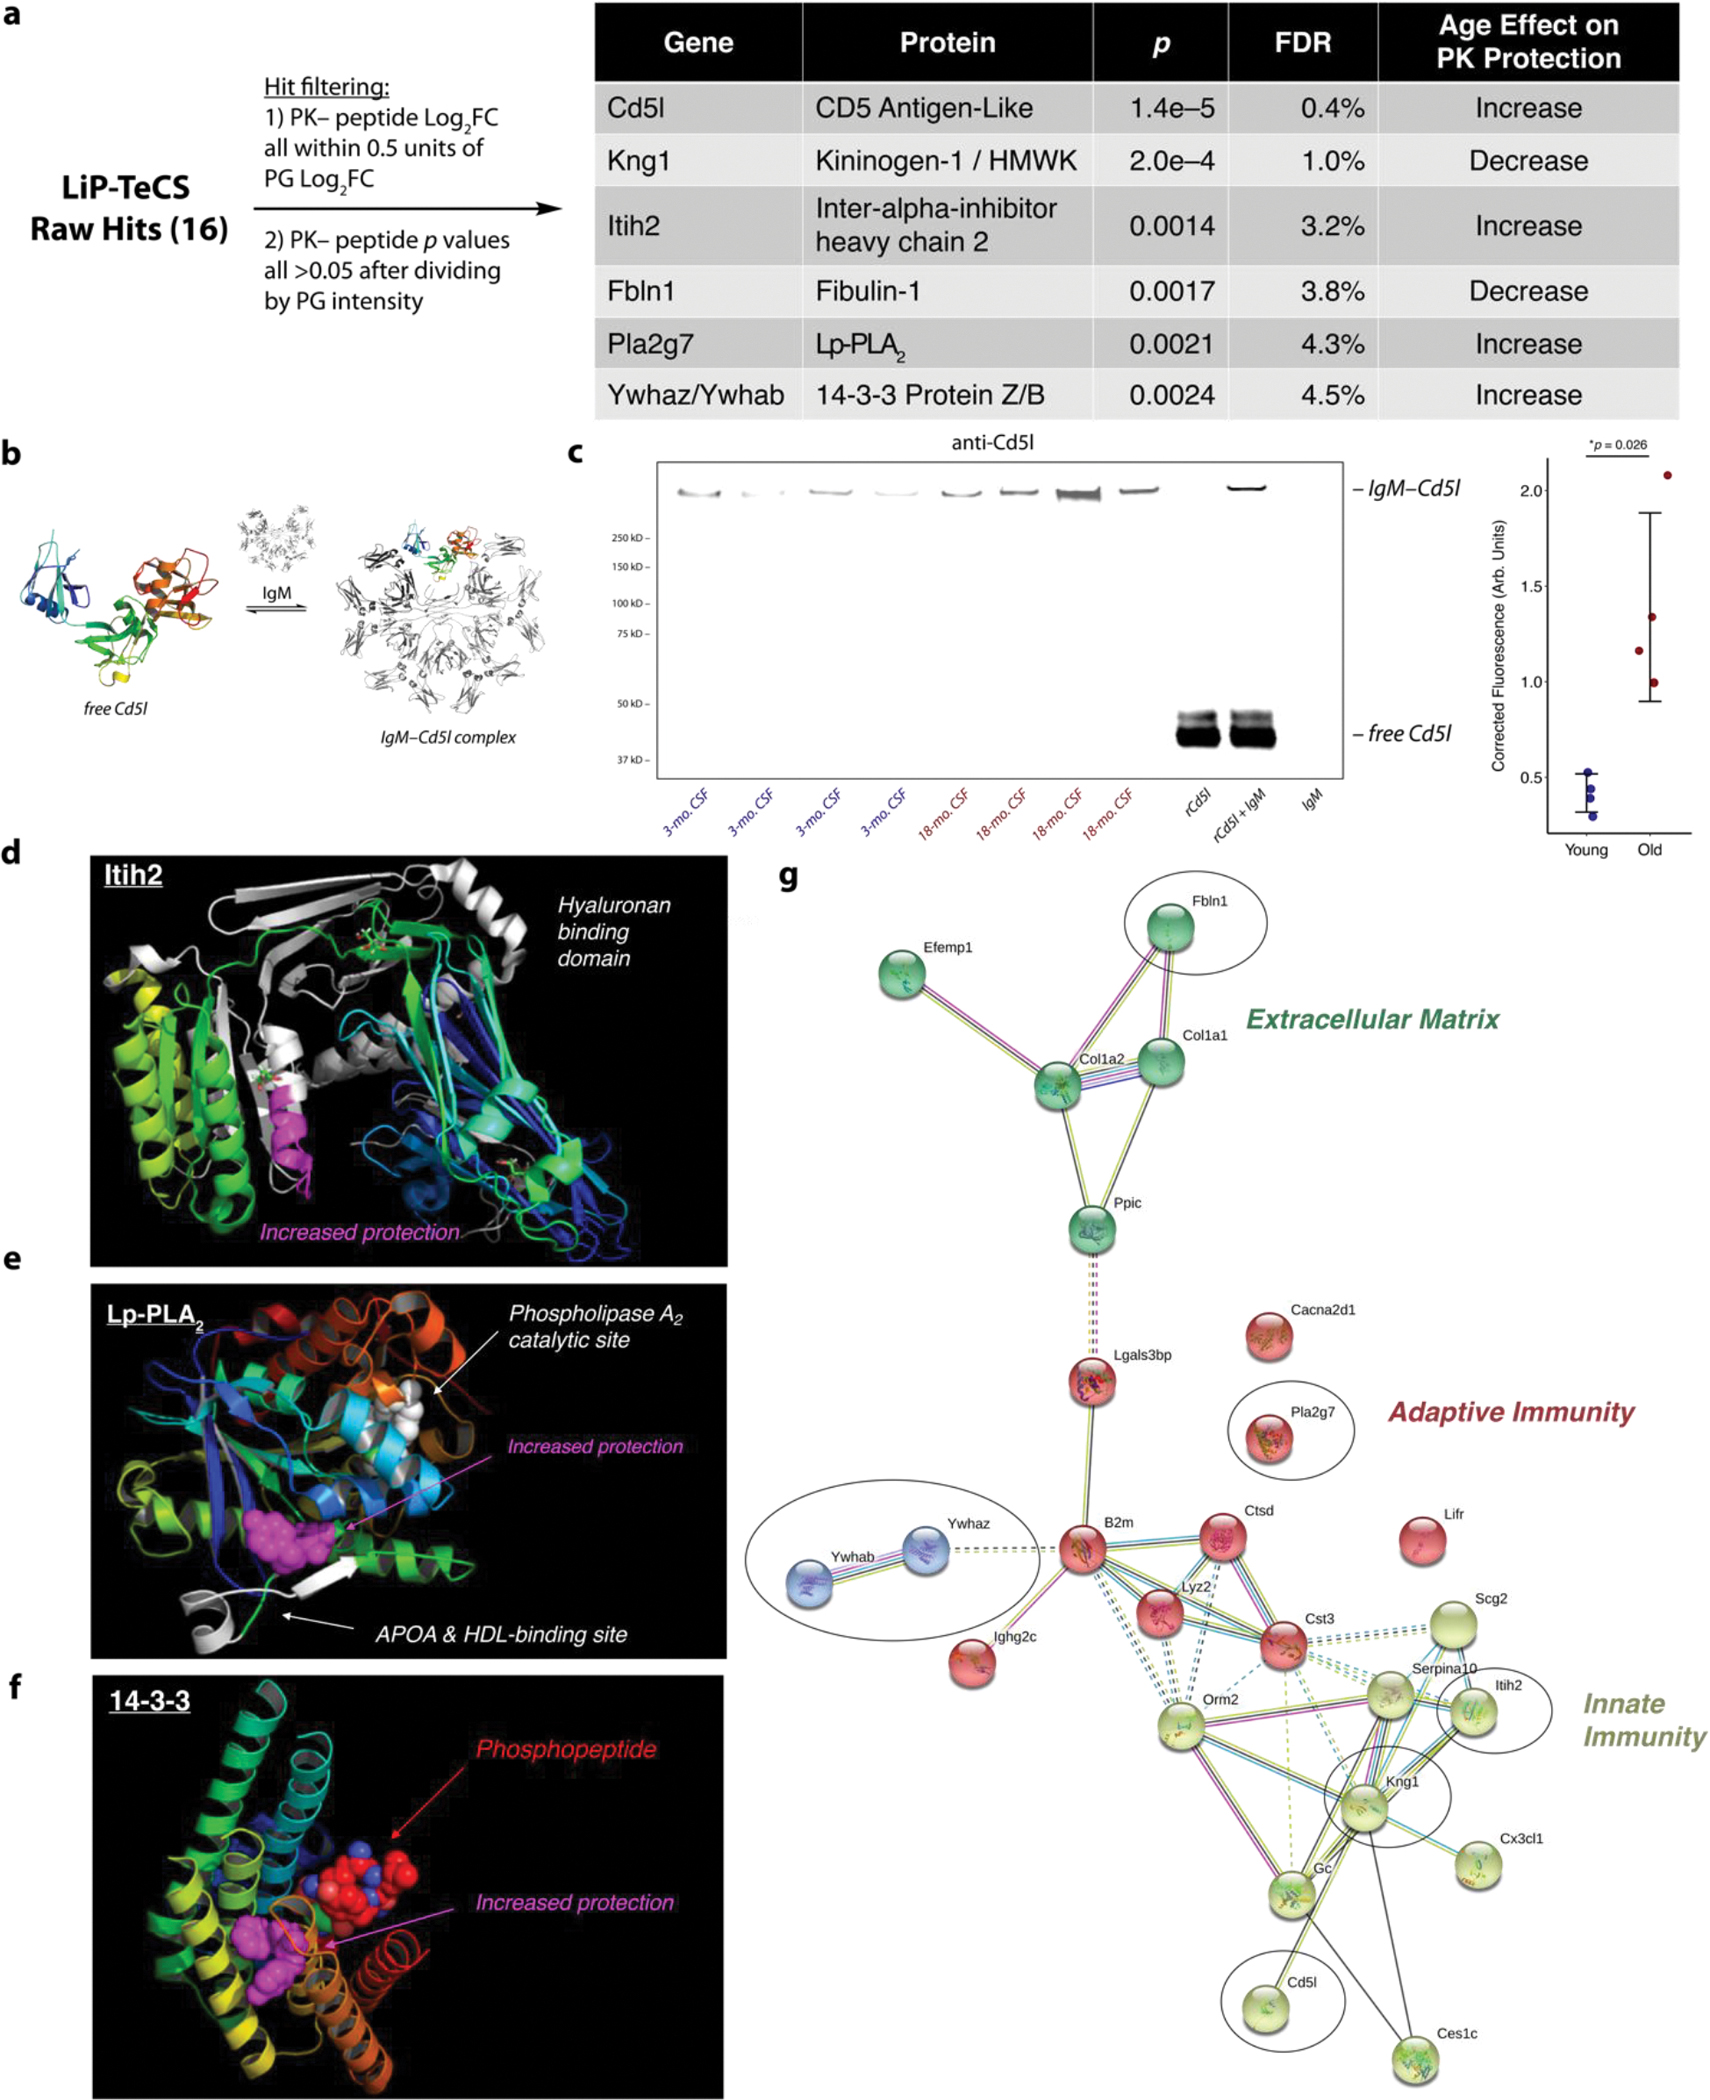
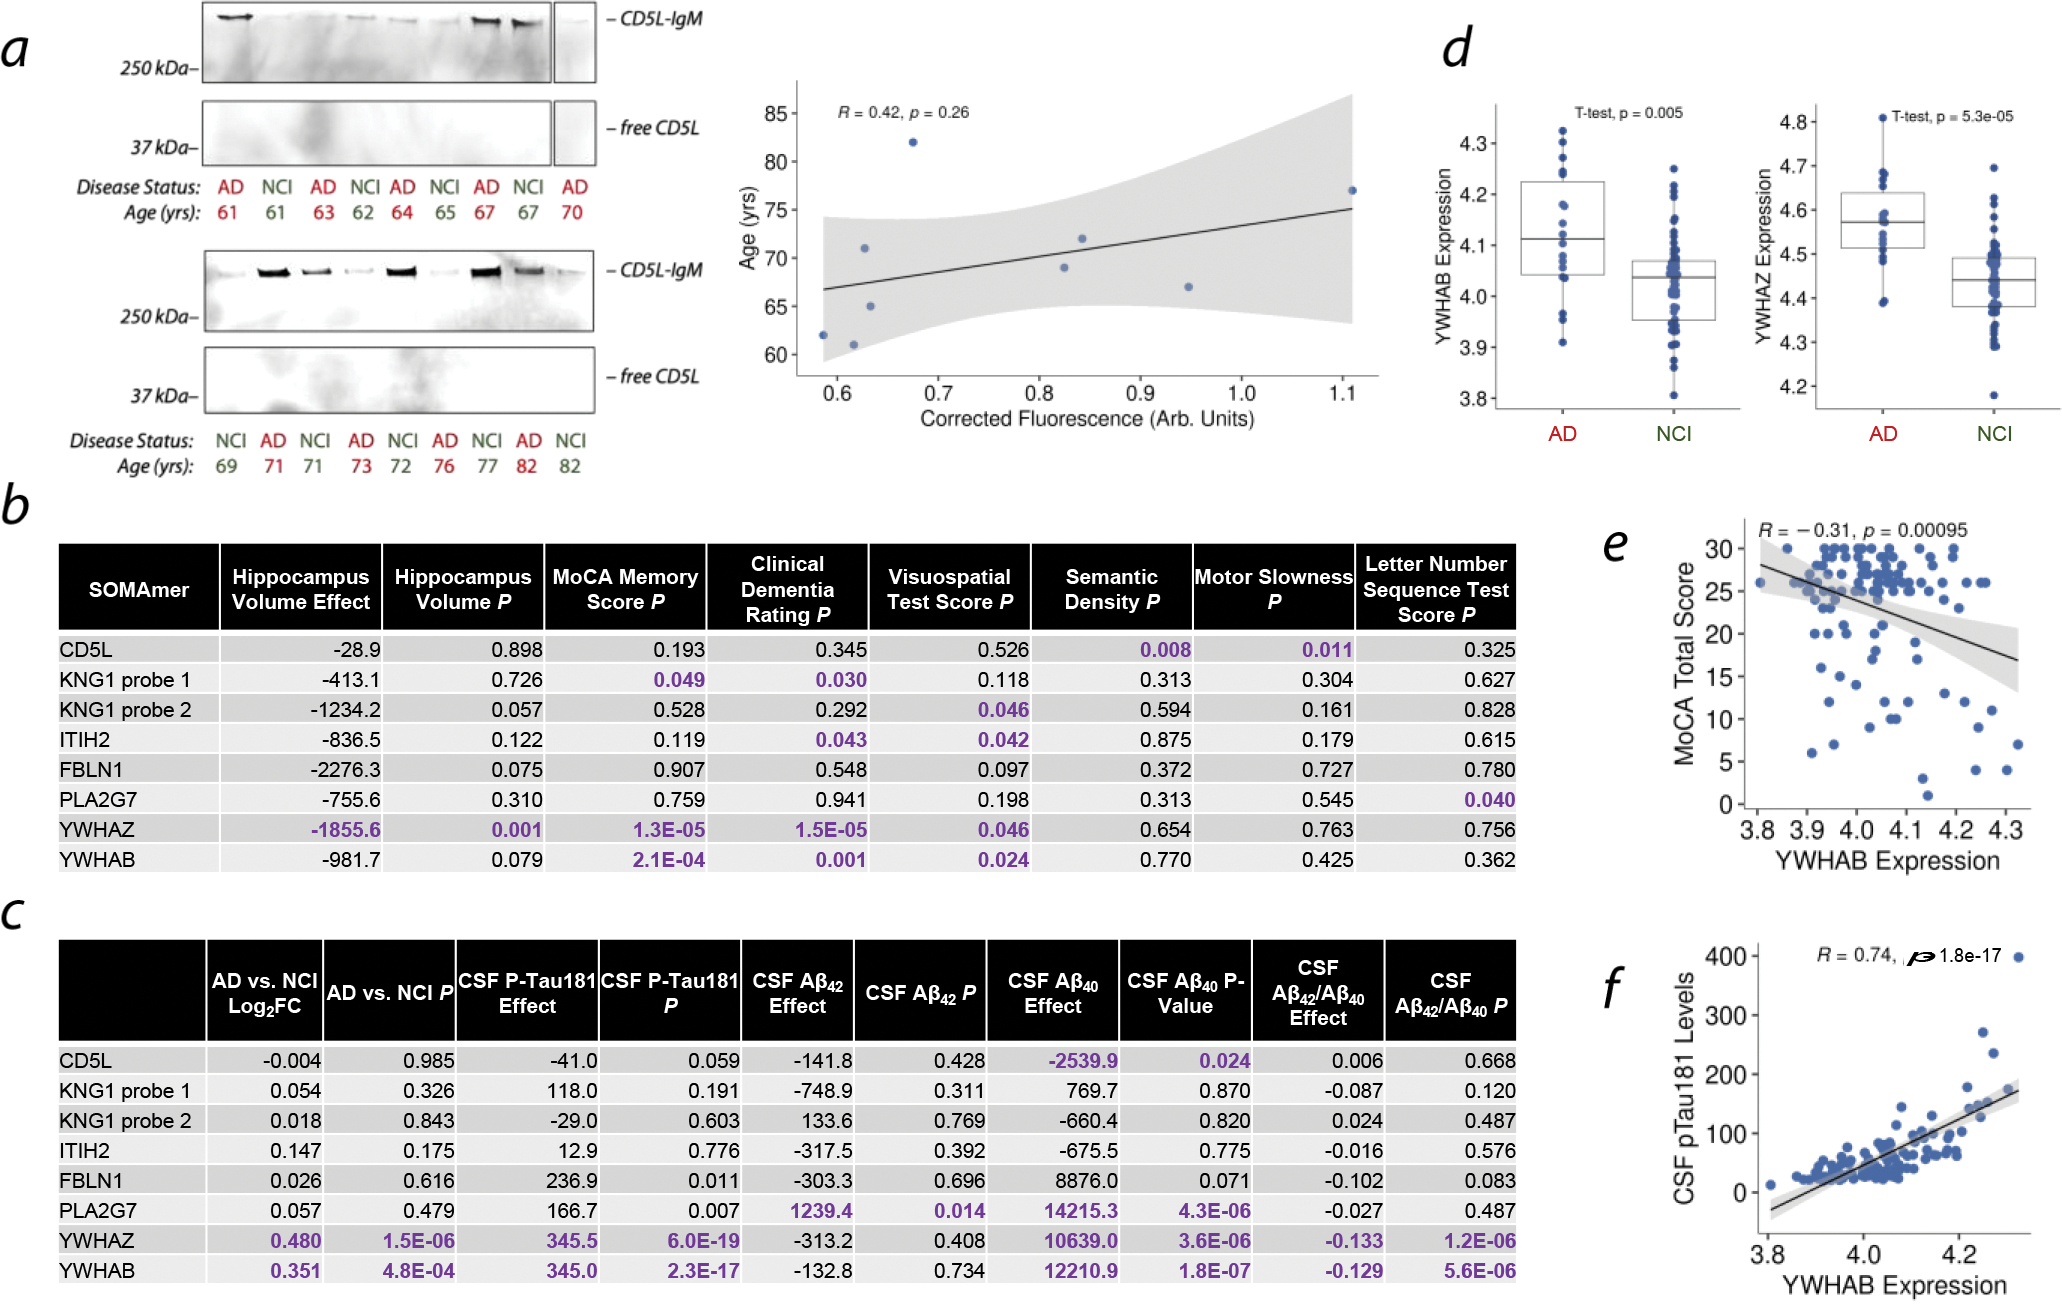
Cerebrospinal fluid (CSF) proteins and their structures have been implicated repeatedly in aging and neurodegenerative diseases. Limited proteolysis-mass spectrometry (LiP-MS) is a method that enables proteome-wide screening for changes in both protein abundance and structure. To screen for novel aging-associated changes in the CSF proteome, we performed LiP-MS on CSF from young and old mice with a modified analysis pipeline. We found 38 protein groups change in abundance with aging, most dominantly immunoglobulins of the IgM subclass. We discovered six high-confidence candidates that appeared to change in structure with aging, of which Kng1, Itih2, Lp-PLA2, and 14-3-3 proteins have binding partners or proteoforms known previously to change in the brain with Alzheimer's disease. Intriguingly, using orthogonal validation by Western blot we found the LiP-MS hit Cd5l forms a covalent complex with IgM in mouse and human CSF whose abundance increases with aging. SOMAmer probe signals for all six LiP-MS hits in human CSF, especially 14-3-3 proteins, significantly associate with several clinical features relevant to cognitive function and neurodegeneration. Together, our findings show that LiP-MS can uncover age-related structural changes in CSF with relevance to neurodegeneration.


Conflict of interest statement

Competing Interests The authors declare no competing interests.

Figures

Extended Data Figure 1.
Extended Data Figure 1.. Theoretical and Computational Development of the LiP-MS Test-Control Screen (LiP-TeCS) Platform.
a. Derivation of an expression for the LiP Ratio fold change (FC) in terms of concentrations and rate constants. Assumptions and details of the model are discussed in the Supplementary Information. For tryptic peptides, coefficients kcleave X are replaced by coefficients f(kcleave X) = (1 − kcleave X[PK]t) in Equations 4 and 5. b. Illustrations of protein grouping algorithms. In the indicated softwares, gray objects are omitted from the outputs to reduce redundancy and protein ID overestimation. The metapeptide method ensures that the LiP Ratio numerator peptide and all peptides in the denominator PG map to the same set of proteins and that all information is (matches are) reported. c. In transferrin (Tf), a single structural change (Fe binding) results in significant LiP Ratio FCs at multiple sites on the same protein, shown here with yellow stars. Structural change occurs at the protein level. d. Example peptide-level LiP-MS analysis. p-value from two-sided T test, q-value from Benjamini-Hochberg correction. A PG containing multiple significant peptides by p value but not q value (blue) would not be considered in the same dataset as a PG with one significant q value and numerous non-significant peptides (pink). e. Formulation of the Fisher method in this experiment. Assumptions are discussed in the Supplementary Information. f. Flow chart showing the implementation of these concepts, as well as the analysis described in Ref. , in a single workflow called LiP Test-Control Screen (LiP-TeCS) (black and green objects). Blue objects represent downstream interpretation. g. Screenshot of the LiP-TeCS desktop app.
Figure 1.
Figure 1.. Limited Proteolysis-Mass Spectrometry (LiP-MS) Experimental and Analytical Workflow.
a. Schematic of limited proteolysis-mass spectrometry (LiP-MS). In LiP-MS, proteins in their native state are treated briefly with a nonspecific protease such as proteinase K (PK) which induces non-tryptic cleavages. The resulting peptides’ intensities relative to protein abundances reflect changes in the chemical structures or states of proteins. b. Clean CSF was collected from 76 young and 34 old B6 wildtype mice. Cells were removed and samples were put through multiple quality control steps to remove contaminated samples. 24-μl pools were generated, each from a distinct combination of individuals, and LiP-MS was performed in both data-dependent acquisition (DDA) and data-independent acquisition (DIA) mode. Quality control analysis of raw and searched data resulted in final sample sizes 13, 10, and 4 for aging analysis. c. Raw DDA data were searched with MaxQuant in order to generate a quantitative DDA dataset (.txt files) and to generate a DIA library. Raw DIA data were analyzed with this library in Spectronaut and the output (Report.csv) was converted using an R script to match the format of the MaxQuant output. d. Although DIA performed better by fundamental metrics than DDA, DIA yielded fewer raw hits when the data were analyzed in the traditional manner, leading us to consider whether raw hits were genuine. Note: hardware malfunctions resulted in some unusable data files, resulting in lower N for processed data.
Figure 2.
Figure 2.. Mouse Cerebrospinal Fluid (CSF) Protein Abundance in Aging.
a. Volcano plot of 357 Spectronaut IDPicker PG intensities compared between young vs. old mouse CSF. Cutoff: FDR = 0.1. b. GO annotation for all mouse CSF proteins sequenced in this study. c. Weighted gene co-expression network analysis (WGCNA) of young adult mouse CSF (338 IDPicker PGs). d. STRING-DB network analysis of hits. Cluster coloring by STRING algorithm. Dotted lines represent links between clusters. e. WGCNA of 342 PG abundances from young and old mouse CSF, with the strength of relationship between each module and mouse age. Relationship score is Pearson coefficient of correlation between module eigengene and mouse age. f. Annotated heatmap of a sub-module of the brown module in Extended Data Figure 1E. Asterisks denote germline chains with partially or wholly sequenced complementarity-determining regions (CDRs). All heatmap colors range from |Pearson correlation coefficient| = 0 (dark orange) to |Pearson correlation coefficient| = 1 (white).
Figure 3.
Figure 3.. Aging-Associated Changes in Structure Revealed by LiP-TeCS.
a. High-confidence LiP-TeCS hits. b. Structures of free Cd5l and covalent Cd5l-IgM, known to coexist in plasma. c. Nonreducing Western blot (anti-mCd5l, R&D Systems AF2834) of N=4 young vs. N=4 old biologically distinct CSF pools. rCd5l = recombinant mouse Cd5l (R&D Systems 2834-CL). IgM = mouse IgM (ThermoFisher MGM00). Error bars: mean +/− standard deviation. P value: two-sided T test. d. Significant Itih2 LiP site is located in the hyaluronan binding domain. e. Significant LiP site in Pla2g7/Lp-PLA2 is located between the known binding site for apolipoprotein A (APOA) / high-density lipoprotein (HDL) and the catalytic site where phosphatidylcholine (PC) is converted to lysophosphatidylcholine (LPC). f. Significant LiP site on 14-3-3 protein Z/B is in the binding site of phosphoproteins involved in signaling. g. STRING network with abundance and LiP-TeCS hits. LiP-TeCS hits in black ovals. Cluster coloring by STRING algorithm.
Figure 4.
Figure 4.. Studies on LiP-TeCS Hits in Human CSF.
a. Nonreducing Western blot against human CD5L in older adults with no cognitive impairment (NCI) and age-matched patients with AD. Scatter plot shows Western blot intensity versus age in the NCI cohort. Error band: 95% CI for line slope. P value: linear regression. b. Associations between human CSF protein abundances measured by SOMAmer array and clinical measures of neurological health. c. Associations between human CSF protein abundances measured by SOMAmer array and disease state or AD biomarker. d. Comparisons of YWHAZ and YWHAB abundances between AD patients and NCI controls by SOMAmer array. e. Relationship between Montreal Cognitive Assessment (MoCA) Memory Score (MOCAREGI) and YWHAZ abundance. Error band: 95% CI for line slope. P value: linear regression. f. Relationship between CSF phospho-tau 181 and YWHAB abundance. Error band: 95% CI for line slope. P value: linear regression.

References

    1. Reitz C; Brayne C; Mayeux R “Epidemiology of Alzheimer disease.” Nature Rev. Neurol. 2011, 7, 137–152. - PMC - PubMed
    1. Smith LM; Kelleher NL “Proteoform: a single term describing protein complexity.” Nature Methods 2013, 10, 186–187. - PMC - PubMed
    1. Kelleher NL; et al. “How many human proteoforms are there?” Nature Chem. Biol. 2018, 14, 206–214. - PMC - PubMed
    1. Selkoe DJ; Hardy J “The amyloid hypothesis of Alzheimer’s disease at 25 years.” EMBO Mol. Med. 2016, 8, 595–608. - PMC - PubMed
    1. Sebastián-Serrano Á; de Diego-García L; Díaz-Hernández M “The Neurotoxic Role of Extracellular Tau Protein.” Int. J. Mol. Sci. 2018, 19, 998. - PMC - PubMed

Publication types