. 2023;138(1):100.
doi: 10.1140/epjp/s13360-023-03674-2. Epub 2023 Jan 30.

Towards an automated data cleaning with deep learning in CRESST

Affiliations

Towards an automated data cleaning with deep learning in CRESST

G Angloher et al. Eur Phys J Plus. 2023.

Abstract

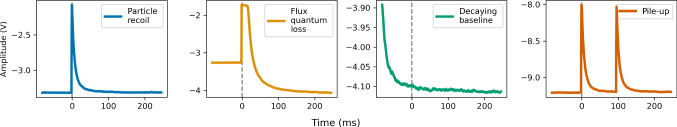
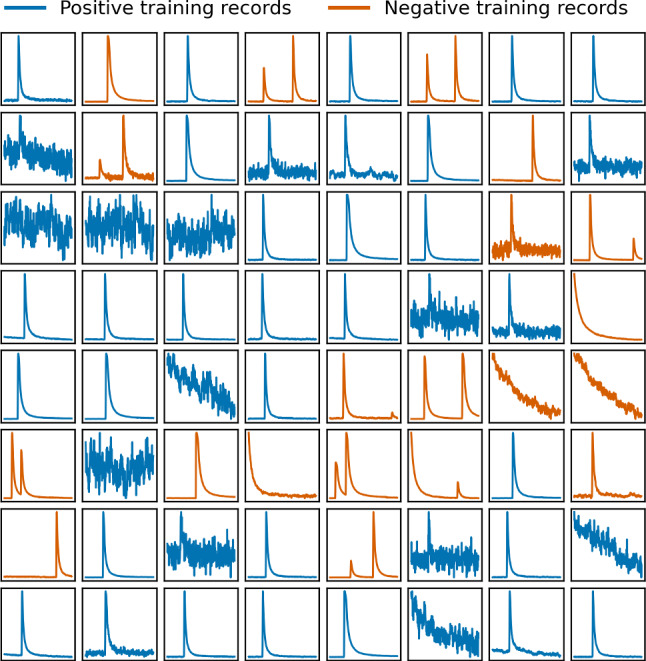
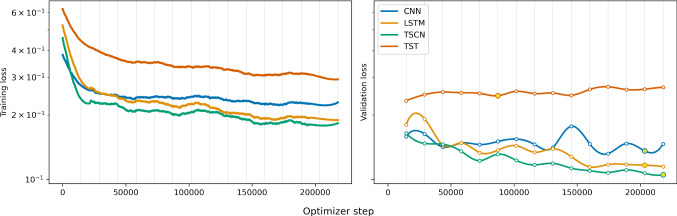
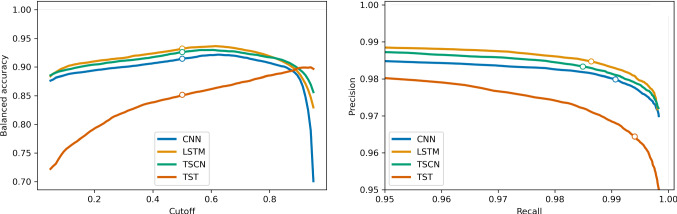
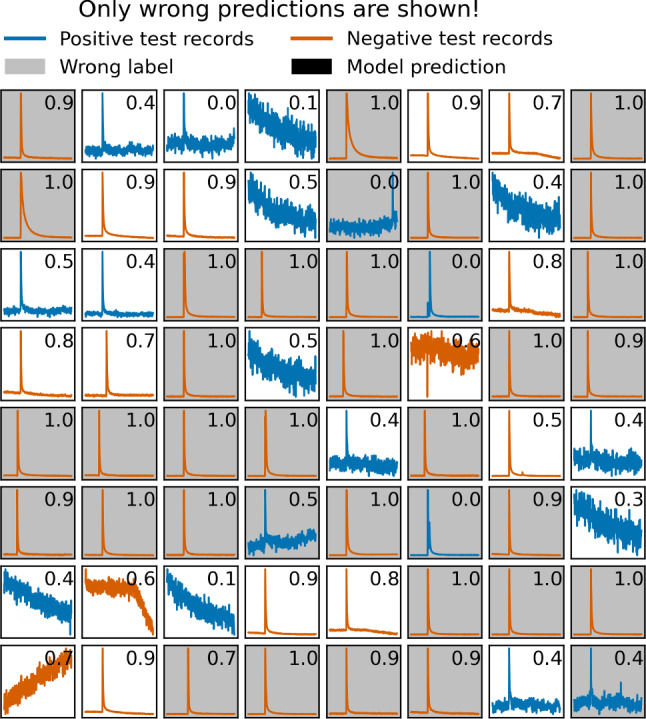
The CRESST experiment employs cryogenic calorimeters for the sensitive measurement of nuclear recoils induced by dark matter particles. The recorded signals need to undergo a careful cleaning process to avoid wrongly reconstructed recoil energies caused by pile-up and read-out artefacts. We frame this process as a time series classification task and propose to automate it with neural networks. With a data set of over one million labeled records from 68 detectors, recorded between 2013 and 2019 by CRESST, we test the capability of four commonly used neural network architectures to learn the data cleaning task. Our best performing model achieves a balanced accuracy of 0.932 on our test set. We show on an exemplary detector that about half of the wrongly predicted events are in fact wrongly labeled events, and a large share of the remaining ones have a context-dependent ground truth. We furthermore evaluate the recall and selectivity of our classifiers with simulated data. The results confirm that the trained classifiers are well suited for the data cleaning task.


Conflict of interest statement

Conflict of interestOn behalf of all authors, the corresponding author states that there is no conflict of interest.

Figures

Fig. 1
Fig. 1
Particle recoils produce a pulse-shaped record (blue). Flux quantum losses of the SQUID amplifier in the read-out circuit are caused by fast magnetic field changes, e.g. from high energy recoils (orange). Decaying BLs are residuals from earlier high energy pulses (green). Pile-up originates from multiple particle recoils within the same record window (red)
Fig. 2
Fig. 2
A mini-batch of 41 positive (blue) and 23 negative (red) records from the training set, all from the same detector. About half of the negative records are created from positive ones, with a data augmentation technique (see text). At least one record (first row, second column) is wrongly labeled as negative
Fig. 3
Fig. 3
Progression of loss values throughout the training process for the four considered models. (left) Loss on the training set, recorded for each optimizer step. (right) The loss on the validation set is evaluated at the end of each epoch. The spline interpolation is a guide for the eye. The yellow dots indicate the point in the training process, where the model reached the best agreement between labels and predictions (accuracy) on the validation set. The bumps in the validation loss, clearly visible for the CNN around 150k steps, are a typical artefact of stochastic optimizers
Fig. 4
Fig. 4
Metrics of all classifier models, under varying cutoff values, evaluated on the test set. The white dot marks the default cutoff value of 0.5. (left) The balanced accuracy w.r.t. the cutoff value. (right) The precision vs. recall curves, for cutoff values between 0.05 and 0.95
Fig. 5
Fig. 5
A batch of events from the test set that were wrongly predicted by the LSTM. The grey color indicates wrong labels. Some records, among them the tilted BLs, can hardly be flagged as positive or negative without additional context, namely the distribution of the remaining data of the corresponding detector
Fig. 6
Fig. 6
Metrics of the classifier models, evaluated on simulated data. (left) The recall values w.r.t. the SNR of simulated events. The recall drops towards lower values, but is still reasonably high around a typical trigger threshold value of 5 BL noise resolutions (grey, dashed). The reason for the local minimum of the CNN curve above 10 SNR is not cogently clearified. The most likely hypothesis is the absence of many low energy pulses in the training set, which can introduce a bias in models predictions. The simultaneous dip in the recall of multiple models around 80 SNR is a small sample effect of the simulation: it could be connected to two simulated events with similar energy, with relatively strongly tilted BLs. (right) The selectivity values for the LSTM model on simulate pile-up events, featuring two pulses, w.r.t. the difference in onset and relative difference in PH. Only pile-up events with large relative PH difference or very small onset difference are not rejected by the model. The area that is covered by the inset holds only selectivity values of one. (right, inset) An example of a simulated pile-up event
Fig. 7
Fig. 7
The data manifold visualized with the first first two principal components. (left) The raw data, without cleaning (black) and the cleaned data (orange), both projected to the first and second principal components of the raw data matrix. (right) The cleaned data projected to the first and second principal components of the cleaned data matrix. The lines corresponding to the individual event types are clearly visible. The PH spectrum of the target channel is shown in Fig. 8
Fig. 8
Fig. 8
The PH spectrum of an exemplary detector without cleaning (black), with the cut analysis that we used as labels (blue) and the LSTM predictions (LSTM). The blue and orange curves almost fully overlap due to the strong agreement between cuts and LSTM. The data manifold of the corresponding 3-channel detector module is visualized in Fig. 7

References

    1. N. Planck Collaboration, Y. Aghanim, Akrami et al., Planck 2018 results - vi. cosmological parameters. (2020) 10.1051/0004-6361/201833910
    1. G. Angloher, S. Banik, G. Benato et al., Latest observations on the low energy excess in CRESST-III,” (2022). arXiv:2207.09375
    1. Abdelhameed AH, Angloher G, Bauer P, et al. First results from the CRESST-III low-mass dark matter program. Phys. Rev. D. 2019;100:102002. doi: 10.1103/PhysRevD.100.102002. - DOI
    1. G. Angloher, S. Banik, G. Benato et al., Testing spin-dependent dark matter interactions with lithium aluminate targets in CRESST-III, (2022). arXiv:2207.07640
    1. Ismail Fawaz H, Forestier G, Weber J, et al. Deep learning for time series classification: a review. Data Mining and Knowle. Dis. 2019;33:917–963. doi: 10.1007/s10618-019-00619-1. - DOI

LinkOut - more resources