

High expression of TMEM200A is associated with a poor prognosis and immune infiltration in gastric cancer
- PMID: 36741965
- PMCID: PMC9892064
- DOI: 10.3389/pore.2023.1610893
High expression of TMEM200A is associated with a poor prognosis and immune infiltration in gastric cancer
Abstract
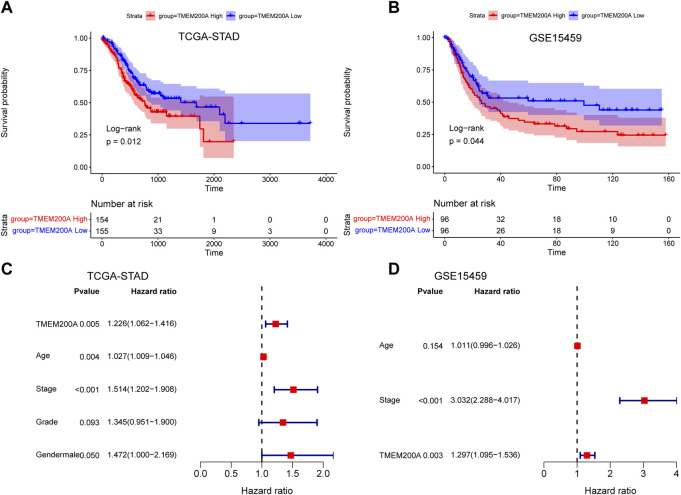
Background: Gastric cancer (GC) is one of the global malignant tumors with high incidence and poor prognosis. Exploring new GC molecular markers is important to improve GC prognosis. Transmembrane protein 200A (TMEM200A) is a member of the family of transmembrane proteins (TMEM). This study is the first to investigate the potential function of TMEM200A and its relationship with immune infiltration in GC. Methods: The differential expression of TMEM200A was determined through the Cancer Genome Atlas (TCGA) and Gene Expression Omnibus (GEO) databases. The receiver operating characteristic (ROC) curve was drawn to assess the diagnostic value of TMEM200A for GC. The relationship between TMEM200A and the clinical characteristics of patients with GC was investigated using the Wilcoxon test and the Kruskal-Wallis test. The effect of TMEM200A on overall survival (OS) was identified using the Kaplan-Meier method, the Log-rank test, the univariate/multivariate Cox regression analysis, and the nomogram prediction model. The co-expressed genes and gene set enrichment analysis (GSEA) were used to explore the potential biological functions of TMEM200A. We used the Tumor Immune Estimation Resource (TIMER) database and the ssGSEA algorithm to estimate the relationship between TMEM200A and immune cell infiltration. Furthermore, we investigated the correlation of TMEM200A with immune checkpoint/immune cell surface markers using the TCGA-STAD data set. Finally, we identified prognosis-related methylation sites in TMEM200A using MethSurv. Results: TMEM200A was highly expressed in GC tissues. TMEM200A had a good diagnostic value for GC. High expression of TMEM200A may shorten the OS of GC patients and may be an independent risk factor for OS in GC patients. TMEM200A participates in the construction of a predictive model with a good predictive effect on the survival rate of GC patients at 1, 3, and 5 years. Co-expressed genes and GSEA indicated that TMEM200A may be an adhesion molecule closely associated with tumor invasion and metastasis. In addition, TMEM200A may be significantly associated with immune cell infiltration and immune checkpoint expression. We also found that TMEM200A contains three methylation sites associated with a poor prognosis. Conclusion: Upregulated TMEM200A may be a promising prognostic marker for GC and is closely associated with the tumor microenvironment (TME).
Keywords: TMEM200A; bioinformatics; gastric cancer; immune infiltration; prognostic.
Copyright © 2023 Deng, Li, Wei, Han, Xu and Zhang.
Conflict of interest statement
The authors declare that the research was conducted in the absence of any commercial or financial relationships that could be construed as a potential conflict of interest.
Figures


Similar articles
-
TMEM200A is a potential prognostic biomarker and correlated with immune infiltrates in gastric cancer.PeerJ. 2023 Jun 29;11:e15613. doi: 10.7717/peerj.15613. eCollection 2023. PeerJ. 2023. PMID: 37404478 Free PMC article.
-
Identification and validation of the prognostic value of cyclic GMP-AMP synthase-stimulator of interferon (cGAS-STING) related genes in gastric cancer.Bioengineered. 2021 Dec;12(1):1238-1250. doi: 10.1080/21655979.2021.1911557. Bioengineered. 2021. PMID: 33843442 Free PMC article.
-
UBR1 is a prognostic biomarker and therapeutic target associated with immune cell infiltration in gastric cancer.Aging (Albany NY). 2024 Aug 23;16(16):12029-12049. doi: 10.18632/aging.206079. Epub 2024 Aug 23. Aging (Albany NY). 2024. PMID: 39181686 Free PMC article.
-
Regulatory T cells in gastric cancer: Key controllers from pathogenesis to therapy.Cancer Treat Rev. 2023 Nov;120:102629. doi: 10.1016/j.ctrv.2023.102629. Epub 2023 Sep 23. Cancer Treat Rev. 2023. PMID: 37769435 Review.
-
One stomach, two subtypes of carcinoma-the differences between distal and proximal gastric cancer.Gastroenterol Rep (Oxf). 2021 Nov 15;9(6):489-504. doi: 10.1093/gastro/goab050. eCollection 2021 Dec. Gastroenterol Rep (Oxf). 2021. PMID: 34925847 Free PMC article. Review.
Cited by
-
Aggregating single nucleotide polymorphisms improves filtering for false-positive associations postimputation.G3 (Bethesda). 2025 May 8;15(5):jkaf043. doi: 10.1093/g3journal/jkaf043. G3 (Bethesda). 2025. PMID: 40053832 Free PMC article.
-
TMEM200A is a potential prognostic biomarker and correlated with immune infiltrates in gastric cancer.PeerJ. 2023 Jun 29;11:e15613. doi: 10.7717/peerj.15613. eCollection 2023. PeerJ. 2023. PMID: 37404478 Free PMC article.
References
-
- Bang YJ, Van Cutsem E, Feyereislova A, Chung HC, Shen L, Sawaki A, et al. Trastuzumab in combination with chemotherapy versus chemotherapy alone for treatment of HER2-positive advanced gastric or gastro-oesophageal junction cancer (ToGA): A phase 3, open-label, randomised controlled trial. Lancet (2010) 376(9742):687–97. 10.1016/S0140-6736(10)61121-X - DOI - PubMed
MeSH terms
Substances
LinkOut - more resources
Full Text Sources
Medical
Miscellaneous