. 2022 Nov 9;2(11):100191.
doi: 10.1016/j.xgen.2022.100191. Epub 2022 Oct 5.

A cis-regulatory lexicon of DNA motif combinations mediating cell-type-specific gene regulation

Affiliations

A cis-regulatory lexicon of DNA motif combinations mediating cell-type-specific gene regulation

Laura K H Donohue et al. Cell Genom. .

Abstract

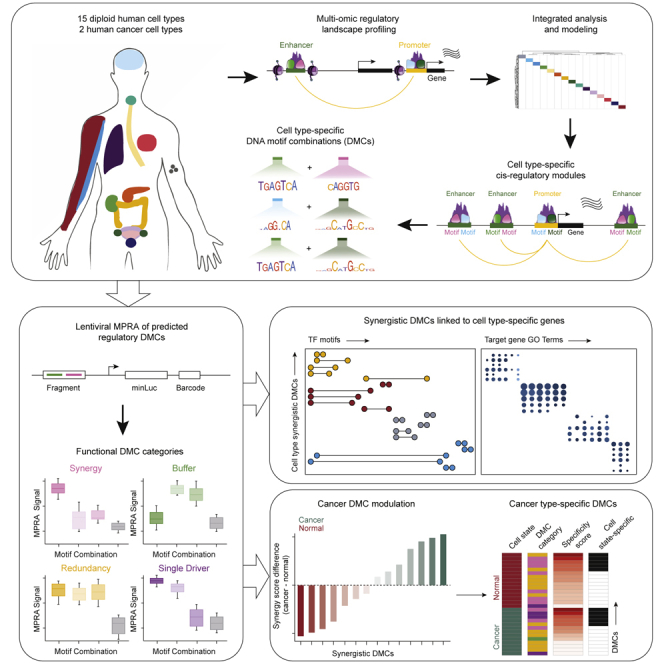
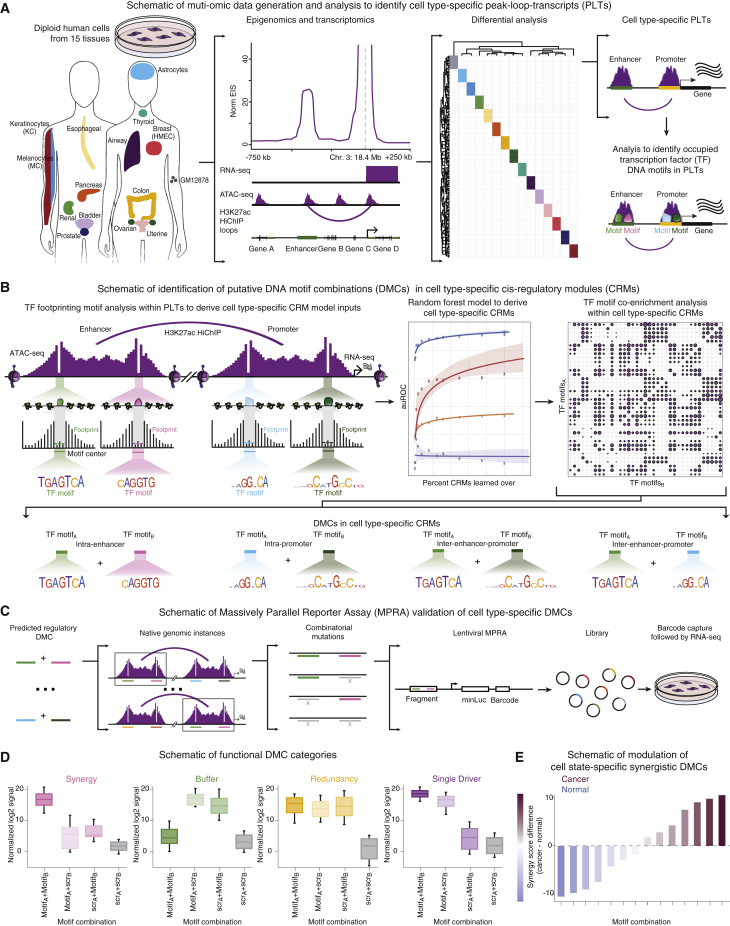
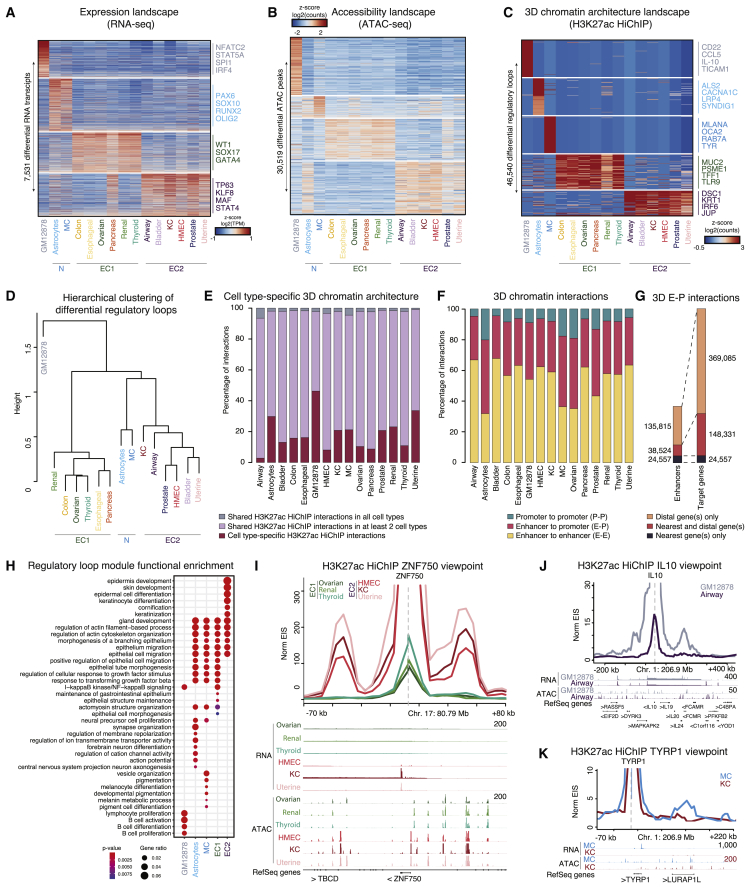
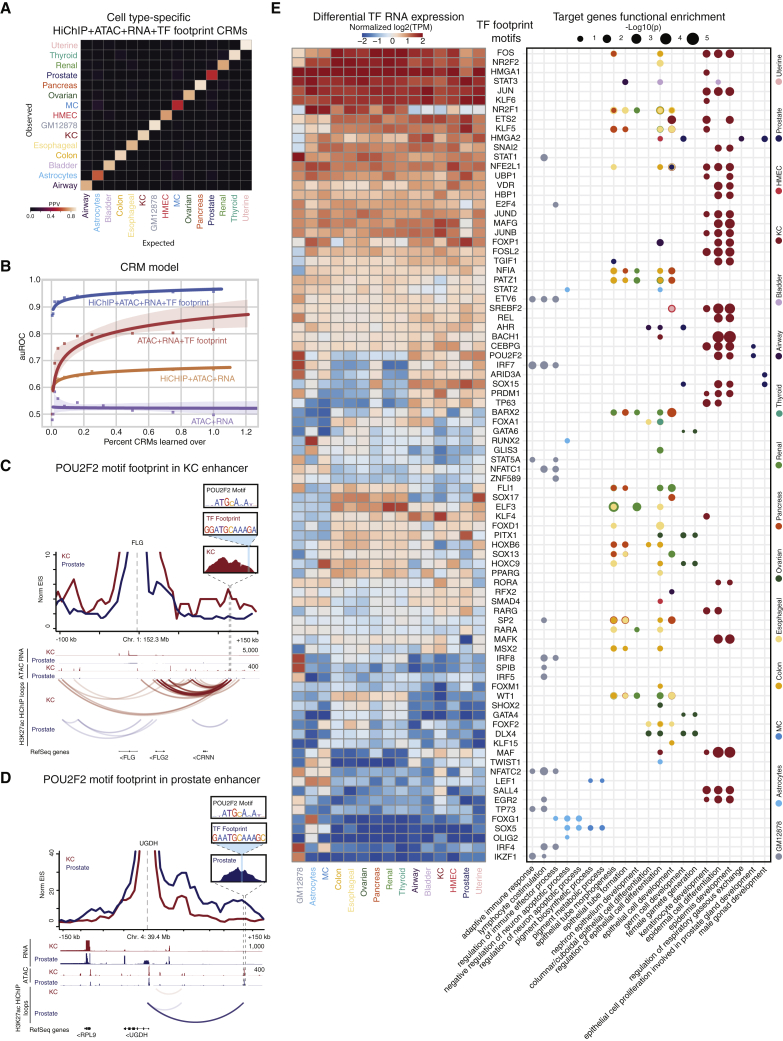
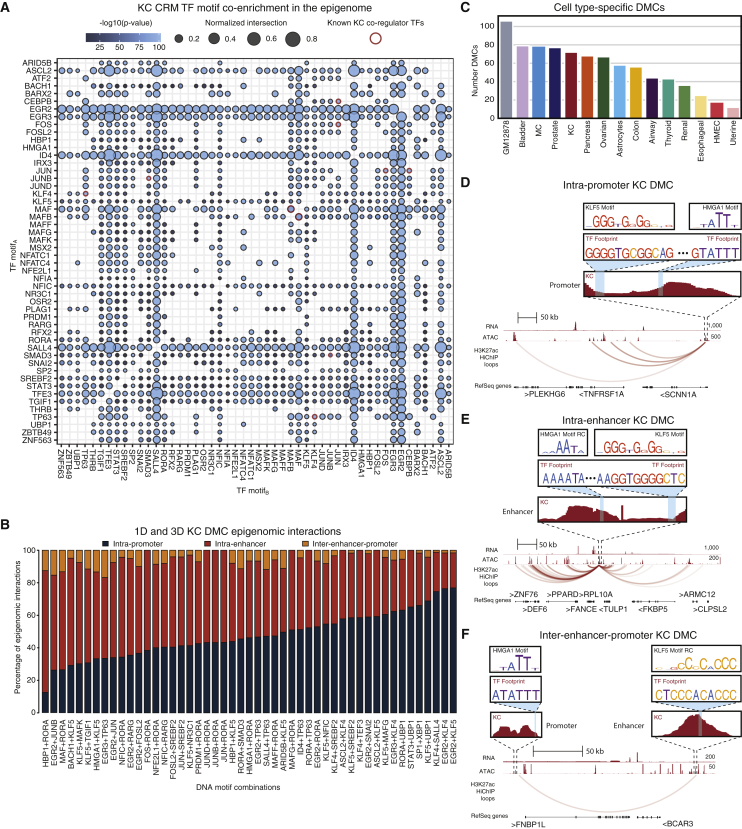
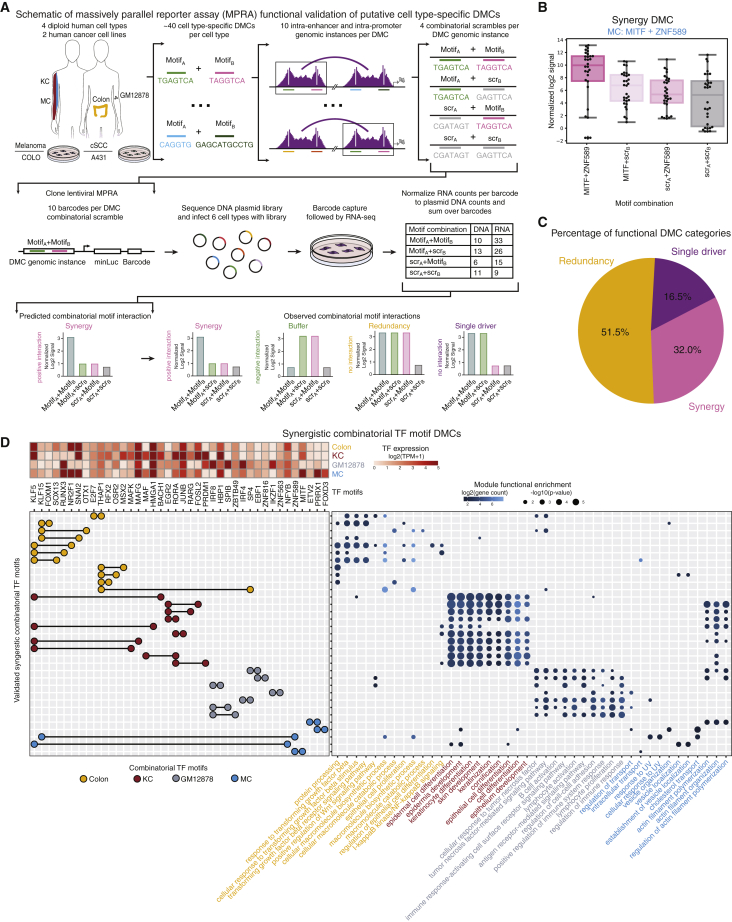
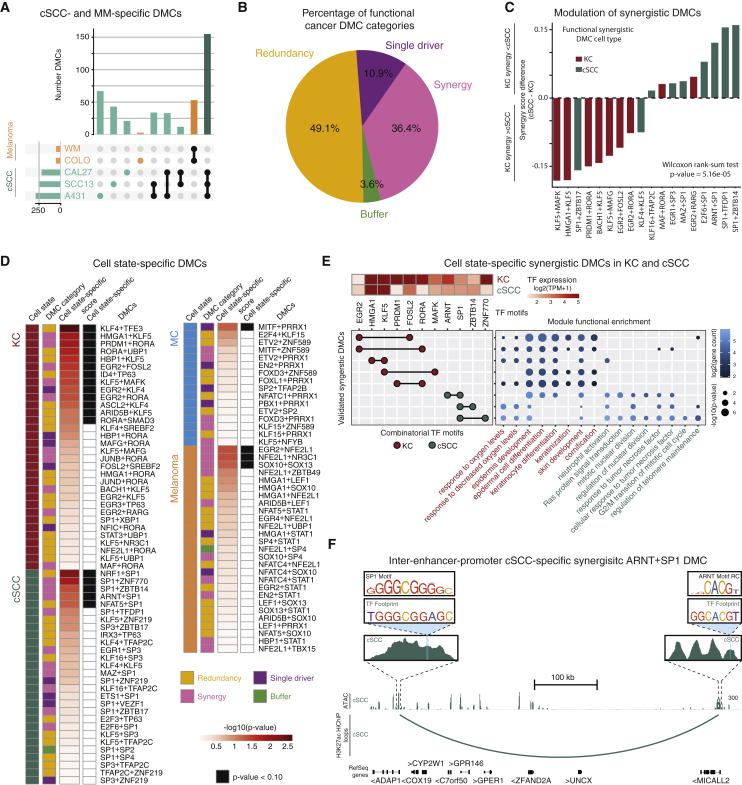
Gene expression is controlled by transcription factors (TFs) that bind cognate DNA motif sequences in cis-regulatory elements (CREs). The combinations of DNA motifs acting within homeostasis and disease, however, are unclear. Gene expression, chromatin accessibility, TF footprinting, and H3K27ac-dependent DNA looping data were generated and a random-forest-based model was applied to identify 7,531 cell-type-specific cis-regulatory modules (CRMs) across 15 diploid human cell types. A co-enrichment framework within CRMs nominated 838 cell-type-specific, recurrent heterotypic DNA motif combinations (DMCs), which were functionally validated using massively parallel reporter assays. Cancer cells engaged DMCs linked to neoplasia-enabling processes operative in normal cells while also activating new DMCs only seen in the neoplastic state. This integrative approach identifies cell-type-specific cis-regulatory combinatorial DNA motifs in diverse normal and diseased human cells and represents a general framework for deciphering cis-regulatory sequence logic in gene regulation.


Conflict of interest statement

DECLARATION OF INTERESTS The authors declare no competing interests.

Figures

None
Graphical abstract
Figure 1
Figure 1
An integrated multi-omic resource in 15 diploid human cell types (A) Workflow for cell-type-specific ATAC peaks, HiChIP loops, and target gene transcripts (PLTs) across 15 diploid human cell types. (B) Schematic of transcription factor (TF) footprinting analysis within PLTs to identify inputs for a random-forest model to derive cell type CRMs. Co-enrichment analysis within CRMs extracted DMCs. (C) Native genomic instances of putative intra-enhancer and intra-promoter DMCs were tested via MPRA. Combinatorial mutations were used to assess cooperativity of DMCs in a lentiviral setup. (D) Schematic of MPRA-validated functional categories of DMC interactions. (E) Schematic bar plot comparing synergistic DMC MPRA activity of normal and cancer-derived DMCs in corresponding cell types.
Figure 2
Figure 2
Epigenomic landscape reveals distinct molecular subtypes of human cells (A) RNA transcripts (rows) versus cell types (columns) of differential gene expression (log2 fold change >0.1, t test, FDR-adjusted p value <0.05). (B) Heatmap of accessible peaks (rows) versus cell types (columns) indicating differential ATAC peaks. ATAC peaks with the highest inter-group SD shown. (C) Heatmap of H3K27ac HiChIP loops (rows) versus cell types (columns) indicating differential loops. Differential loops with the highest inter-group SD shown. (D) Hierarchical clustering of differential H3K27ac HiChIP loops. (E) Bar plot depicting cell-type-specific 3D chromatin architecture and overlap between the 15 different cell types. (F) Bar plot depicting distribution of P-P, E-P, and E-E interactions by cell type. (G) Bar plot depicting putative enhancers and target genes identified in different E-P interaction types. (H) Regulatory loop module functional enrichment using GO biological processes. EC1 and EC2 are grouped together. Dot color corresponds to the p value of the GO enrichment (hypergeometric test). (I) Virtual 4C visualization at 5-kb resolution and RNA and ATAC-seq tracks centered at the ZNF750 TSS. > and < denote gene orientation on plus and minus DNA strand respectively. (J) Virtual 4C visualization for IL10. (K) Virtual 4C visualization for TYRP1. Related to Figures S1, S2, and Table S2.
Figure 3
Figure 3
TF motif enrichment via footprinting cell-type CRMs (A) Confusion matrix depicting the positive predictive value (PPV) for the cell type prediction model. (B) Scatterplot showing auROC versus percentage of CRMs learned in the random-forest-based cell-type prediction model. Lines are fitted to the points using logistic regression. (C) Virtual 4C visualization along with the POU2F2 position-weight matrix (PWM), TF footprint sequence, and surrounding ATAC peak centered at FLG. (D) Virtual 4C visualization along with the POU2F2 PWM, TF footprint sequence, and surrounding ATAC peak centered at UGDH. (E) Heatmap (left) depicts normalized log2(TPM) values for nominated TFs corresponding to motifs derived from TF footprinting analysis (rows) in the 15 cell types (columns). TFs are ordered by expression similarity. Dot plot (right) depicts GO enrichment for target genes (x axis) proximal or distally looped to TF footprint motifs in cell-type-specific CRMs (y axis). Dots are colored by cell type. Size corresponds to the −log10(p value) of the GO enrichment (hypergeometric test). Related to Figure S3.
Figure 4
Figure 4
Co-enrichment analysis reveals DMCs (A) Co-enrichment dot plot of TF motifs within KC CRMs depicting putative cooperativity (Fisher’s exact, Bonferroni-corrected p < 0.05). Dots are colored by −log10(p value). Size corresponds to normalized number of shared genes. Red outlined dots indicate known cooperative KC TFs. (B) Bar plot depicting the distribution of DMCs based on CRM epigenomic interactions for MPRA-tested KC DMCs. (C) Bar plot of number of cell-type-specific DMCs in the 15 cell types. (D) Genomic instance of intra-promoter KC DMC HMGA1+KLF5 at the SCNN1A TSS. (E) Genomic instance of putative intra-enhancer KC DMC HMGA1+KLF5 looping to PPARD. RC, reverse complement. (F) Genomic instance of putative inter-enhancer-promoter KC DMC HMGA1+KLF5 proximal to FNBP1L. Related to Figure S4 and Table S4.
Figure 5
Figure 5
MPRAs validate TF DMCs in human cells (A) Schematic representation of MPRA design and validated functional categories of DMC interactions. (B) Box-and-whisker plot showing the normalized log2 MPRA signal for the different motifA-motifB combinations in the synergy DMC MITF + ZNF589 in MC. Each point on the plot represents the signal value in one genomic instance in one replicate. ∗p < 0.05 (Mann-Whitney U test). (C) Pie chart depicting percentage of DMCs by functional category. (D) Top left: heatmap shows log2(TPM + 1) values for TFs involved in the functional synergistic DMC combinatorial motifs (columns) by cell type (rows). Left: combinatorial TFs of DMCs (rows). Motifs (columns) that make up the DMC are circles connected by a black line. Circles are colored based on DMC cell type. Right: dot plot shows the GO terms enriched for target genes (x axis) that utilize the DMC (y axis). Dots are colored by log2(target gene count). Dot sizes are the −log10(p value) of the GO enrichment. GO terms are colored by cell-type biological processes (hypergeometric test). Related to Figure S5 and Table S5.
Figure 6
Figure 6
MPRAs identify regulatory DMCs in cancer (A) Upset plot depicting number of DMCs determined from MM and cSCC cell lines and the size of their overlapping sets. (B) Pie chart depicting percentage of functional DMC categories by MPRA in cSCC and MM cells. (C) Bar plot showing the synergy score difference for KC- and cSCC-identified DMCs; p value based on a rank-sum Wilcoxon test. (D) Left to right: panel colored by cell type/state; panel colored by functional DMC category; heatmap panel of −log10(p value) cell-type-/state-specificity score (STAR Methods); panel colored by cell-type-/state-specific expression (Wilcoxon rank-sum test p value <0.10). (E) Top left: heatmap shows log2(TPM + 1) values for TFs in synergistic DMCs (columns) by normal KC- and cSCC-specific cell state (rows). Left: combinatorial TFs of the DMC (rows). Motifs that make up the DMC (columns) are circles with a black line connecting them. Circles are colored based on DMC cell state. Right: dot plot shows GO terms enriched for target genes (x axis) that utilize the DMC (y axis). Dots are colored by log2(target gene count). Dot sizes are the −log10(p value) of the GO enrichment. GO terms are colored by cell state biological processes. (F) Genomic instance of putative inter-enhancer-promoter cSCC-specific synergistic DMC SP1+ARNT at ADAP1. Related to Figure S6 and Table S5.

References

    1. Istrail S., Davidson E.H. Logic functions of the genomic cis-regulatory code. Proc. Natl. Acad. Sci. USA. 2005;102:4954–4959. - PMC - PubMed
    1. Banerji J., Rusconi S., Schaffner W. Expression of a β-globin gene is enhanced by remote SV40 DNA sequences. Cell. 1981;27:299–308. doi: 10.1016/0092-8674(81)90413-x. - DOI - PubMed
    1. Calo E., Wysocka J. Modification of enhancer chromatin: what, how, and why? Mol. Cell. 2013;49:825–837. - PMC - PubMed
    1. Ong C.-T., Corces V.G. Enhancer function: new insights into the regulation of tissue-specific gene expression. Nat. Rev. Genet. 2011;12:283–293. - PMC - PubMed
    1. Dao L.T.M., Galindo-Albarrán A.O., Castro-Mondragon J.A., Andrieu-Soler C., Medina-Rivera A., Souaid C., Charbonnier G., Griffon A., Vanhille L., Stephen T., et al. Genome-wide characterization of mammalian promoters with distal enhancer functions. Nat. Genet. 2017;49:1073–1081. - PubMed