

Quantitative omics analyses of NCOA4 deficiency reveal an integral role of ferritinophagy in iron homeostasis of hippocampal neuronal HT22 cells
- PMID: 36742433
- PMCID: PMC9892431
- DOI: 10.3389/fnut.2023.1054852
Quantitative omics analyses of NCOA4 deficiency reveal an integral role of ferritinophagy in iron homeostasis of hippocampal neuronal HT22 cells
Abstract
Introduction: Neurons require iron to support their metabolism, growth, and differentiation, but are also susceptible to iron-induced oxidative stress and cytotoxicity. Ferritin, a cytosolic iron storage unit, mediates cellular adaptation to fluctuations in iron delivery. NCOA4 has been characterized as a selective autophagic cargo receptor facilitating the mobilization of intracellular iron from ferritin. This process named ferritinophagy results in the degradation of ferritin and the consequent release of iron into the cytosol.
Methods: Here we demonstrate that NCOA4 is important for the adaptation of the HT22 mouse hippocampal neuronal cell line to cellular iron restriction. Additionally, we determined the pathophysiological implications of impaired ferritinophagy via functional analysis of the omics profile of HT22 cells deficient in NCOA4.
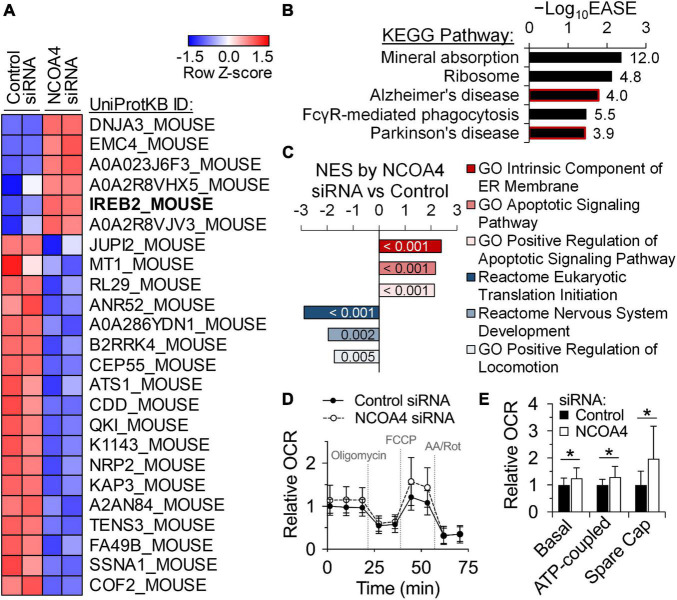
Results: NCOA4 silencing impaired ferritin turnover and was cytotoxic when cells were restricted of iron. Quantitative proteomics identified IRP2 accumulation among the most prominent protein responses produced by NCOA4 depletion in HT22 cells, which is indicative of functional iron deficiency. Additionally, proteins of apoptotic signaling pathway were enriched by those responsive to NCOA4 deficiency. Transcriptome profiles of NCOA4 depletion revealed neuronal cell death, differentiation of neurons, and development of neurons as potential diseases and bio functions affected by impaired ferritinophagy, particularly, when iron was restricted.
Discussion: These findings identify an integral role of NCOA4-mediated ferritinophagy in the maintenance of iron homeostasis by HT22 cells, and its potential implications in controlling genetic pathways of neurodevelopment and neurodegenerative diseases.
Keywords: IRP2; RNA-seq; ferritin; ferritinophagy; iron deficiency; proteomics.
Copyright © 2023 Bengson, Guggisberg, Bastian, Georgieff and Ryu.
Conflict of interest statement
The authors declare that the research was conducted in the absence of any commercial or financial relationships that could be construed as a potential conflict of interest.
Figures


Similar articles
-
Ferritinophagy in cardiovascular diseases: mechanisms and potential therapy.Mol Cell Biochem. 2025 Jun 20. doi: 10.1007/s11010-025-05301-3. Online ahead of print. Mol Cell Biochem. 2025. PMID: 40540145 Review.
-
Dimethyl malonate preserves brain and neurobehavioral phenotype following neonatal hypoxia-ischemia by inhibiting FTH1-mediated ferritinophagy.Redox Biol. 2025 Jul 29;86:103792. doi: 10.1016/j.redox.2025.103792. Online ahead of print. Redox Biol. 2025. PMID: 40749519 Free PMC article.
-
NCOA4-Mediated Ferritinophagy Induces Ferroptosis and Enriches Ferritin-Containing EVs via Ferritin Phase Separation to Promote Mechanical Ventilation-Induced Pulmonary Fibrosis.J Adv Res. 2025 Jul 28:S2090-1232(25)00571-5. doi: 10.1016/j.jare.2025.07.043. Online ahead of print. J Adv Res. 2025. PMID: 40738474
-
Toosendanin induces ferroptosis in gastrointestinal stromal tumor cells through the regulation of the NCOA4 ferritinophagy pathway: implications for tumor proliferation, migration, and invasion.J Gastrointest Oncol. 2025 Jun 30;16(3):853-864. doi: 10.21037/jgo-2024-1002. Epub 2025 Jun 26. J Gastrointest Oncol. 2025. PMID: 40672075 Free PMC article.
-
The Black Book of Psychotropic Dosing and Monitoring.Psychopharmacol Bull. 2024 Jul 8;54(3):8-59. Psychopharmacol Bull. 2024. PMID: 38993656 Free PMC article. Review.
Cited by
-
Ferroptosis in central nervous system injuries: molecular mechanisms, diagnostic approaches, and therapeutic strategies.Front Cell Neurosci. 2025 Jul 22;19:1593963. doi: 10.3389/fncel.2025.1593963. eCollection 2025. Front Cell Neurosci. 2025. PMID: 40766185 Free PMC article. Review.
-
Ferroptosis: a new mechanism of traditional Chinese medicine for treating ulcerative colitis.Front Pharmacol. 2024 Jun 4;15:1379058. doi: 10.3389/fphar.2024.1379058. eCollection 2024. Front Pharmacol. 2024. PMID: 38895617 Free PMC article. Review.
-
Role of ferroptosis in the pathogenesis of heart disease.Front Physiol. 2024 Sep 10;15:1450656. doi: 10.3389/fphys.2024.1450656. eCollection 2024. Front Physiol. 2024. PMID: 39318361 Free PMC article. Review.
-
Regulating NCOA4-Mediated Ferritinophagy for Therapeutic Intervention in Cerebral Ischemia-Reperfusion Injury.Neurochem Res. 2024 Jul;49(7):1806-1822. doi: 10.1007/s11064-024-04146-4. Epub 2024 May 7. Neurochem Res. 2024. PMID: 38713437
-
Melatonin Attenuates Ferritinophagy/Ferroptosis by Acting on Autophagy in the Liver of an Autistic Mouse Model BTBR T+Itpr3tf/J.Int J Mol Sci. 2024 Nov 23;25(23):12598. doi: 10.3390/ijms252312598. Int J Mol Sci. 2024. PMID: 39684310 Free PMC article.
References
Grants and funding
LinkOut - more resources
Full Text Sources
Molecular Biology Databases