. 2023 Feb 1;5(1):dlad004.
doi: 10.1093/jacamr/dlad004. eCollection 2023 Feb.

Identification and characterization of plasmids carrying the mobile colistin resistance gene mcr-1 using optical DNA mapping

Affiliations

Identification and characterization of plasmids carrying the mobile colistin resistance gene mcr-1 using optical DNA mapping

Sriram Kk et al. JAC Antimicrob Resist. .

Abstract

Objectives: Colistin is a last-resort antibiotic, but there has been a rapid increase in colistin resistance, threatening its use in the treatment of infections with carbapenem-resistant Enterobacterales (CRE). Plasmid-mediated colistin resistance, in particular the mcr-1 gene, has been identified and WGS is the go-to method in identifying plasmids carrying mcr-1 genes. The goal of this study is to demonstrate the use of optical DNA mapping (ODM), a fast, efficient and amplification-free technique, to characterize plasmids carrying mcr-1.

Methods: ODM is a single-molecule technique, which we have demonstrated can be used for identifying plasmids harbouring antibiotic resistance genes. We here applied the technique to plasmids isolated from 12 clinical Enterobacterales isolates from patients at a major hospital in Thailand and verified our results using Nanopore long-read sequencing.

Results: We successfully identified plasmids encoding the mcr-1 gene and, for the first time, demonstrated the ability of ODM to identify resistance gene sites in small (∼30 kb) plasmids. We further identified bla CTX-M genes in different plasmids than the ones encoding mcr-1 in three of the isolates studied. Finally, we propose a cut-and-stretch assay, based on similar principles, but performed using surface-functionalized cover slips for DNA immobilization and an inexpensive microscope with basic functionalities, to identify the mcr-1 gene in a plasmid sample.

Conclusions: Both ODM and the cut-and-stretch assay developed could be very useful in identifying plasmids encoding antibiotic resistance in hospitals and healthcare facilities. The cut-and-stretch assay is particularly useful in low- and middle-income countries, where existing techniques are limited.


Figures

Figure 1.
Figure 1.
Schematics of ODM. (a) CRISPR-Cas9-based targeted restriction of antibiotic resistance gene site in a plasmid, followed by single-step YOYO-netropsin labelling. (b) DNA sample is added to the loading reservoir of the nanofluidic device and pushed into the nanochannels using pressure-driven flow. Fluorescence imaging of single DNA molecules in nanochannels is then used to obtain kymographs. Inset shows DNA molecules stretched in nanochannels. (c) Concentric plot and intensity versus length plot from tens of individual plasmids (thin lines) to obtain the consensus intensity profile (barcode, dotted thick line) and identify the location of the resistance gene. The consensus intensity profile is aligned with the Cas9-restricted resistance gene site at the ends, represented by black rectangles.
Figure 2.
Figure 2.
Comparison between barcode from long-read Nanopore sequencing (grey) and ODM experimental barcodes (black) for isolates (a) T4F_1 (116 kb) and (b) T6F_1 (68 kb). The x-axis is the length of the plasmids in kb and the y-axis is the normalized intensity in arbitrary units, where the intensity plots are shifted five units vertically for clarity. Black squares within the shaded regions represent the location of the mcr-1 gene.
Figure 3.
Figure 3.
ODM barcodes of 34 kb plasmids with the mcr-1 gene (black) compared with barcodes from Nanopore sequencing (grey) for sample T1S_1 (a), T3F_1 (b), T4F_2 (c) and T6F_2 (d). For T3F_1 and T6F_2, the Nanopore barcode is for T1S_1. The x-axis shows the length of plasmids in kb and the y-axis is the normalized intensity in arbitrary units, where the intensity plots are shifted five units vertically for clarity. Black squares represent the location of the mcr-1 gene and the shaded regions indicate when the gene location is similar for the two tecniques.
Figure 4.
Figure 4.
Barcodes of plasmids with the mcr-1 gene in. (a) Isolates T2F_1 (34 kb) and T2F_2 (34 kb) showing identical plasmids and mcr-1 gene site in both isolates, compared with the theoretical barcode generated from long-read Nanopore sequencing of T2F_1 (Nanopore). (b) Isolates T7F_1 (116 kb) and T7F_2 (116 kb) showing identical plasmids and mcr-1 gene site in both isolates, compared with the theoretical barcode generated from long-read Nanopore sequencing of T7F_1 (Nanopore). The x-axis shows the length of plasmids in kb and the y-axis is the normalized intensity in arbitrary units, where the intensity plots are shifted five units vertically for clarity. Black squares within the shaded regions represent the location of the mcr-1 gene.
Figure 5.
Figure 5.
Barcodes of plasmids with other antibiotic resistance genes. The x-axis shows the length of the plasmids in kb and the y-axis is the normalized intensity in arbitrary units, where the intensity plots are shifted five units vertically for clarity. Black squares in the shaded regions represent the location of the blaCTX-M gene. (a) T5F_1 (125 kb plasmid) carrying the blaCTX-M-55 gene, compared with the Nanopore barcode. (b) T6F_1 (125 kb plasmid) carrying the blaCTX-M-55 gene, compared with the Nanopore barcode. (c) T5F_1 versus T6F_1, showing identical barcodes and blaCTX-M-55 gene site. (d) Isolate T1S_1 with a 112 kb plasmid carrying the blaCTX-M-15 gene, compared with the Nanopore barcode.
Figure 6.
Figure 6.
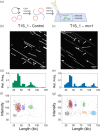
(a) Schematics of the cut-and-stretch microscopy assay. Plasmids isolated from patient samples are treated with CRISPR/Cas9 for targeted restriction of the plasmid with the antibiotic resistance gene of interest. The DNA molecules are then stained with YOYO-1 and stretched on a silanized coverslip for single molecule fluorescence imaging. (b) Fluorescence image from control experiment on plasmids from isolate T1S_1, showing uncut circular plasmids (white arrows). (c) Fluorescence image from experiment using Cas9 targeting the mcr-1 gene on plasmids from isolate T1S_1, showing linearized plasmids (white arrows). (d–e) Relative frequency versus length plot for the control experiment (d) and for the experiment using Cas9 targeting the mcr-1 gene (e) for isolate T1S_1. (f–g) Intensity versus length plot for the control experiment (f) and for the experiment using Cas9 targeting the mcr-1 gene (g) for isolate T1S_1 where coloured regions represent the different clusters identified.

Similar articles

Cited by

References

    1. Allegranzi B, Nejad SB, Combescure Cet al. . Burden of endemic health-care-associated infection in developing countries: systematic review and meta-analysis. Lancet 2011; 377: 228–41. 10.1016/S0140-6736(10)61458-4 - DOI - PubMed
    1. Actis LA. Bacterial plasmids: replication of extrachromosomal genetic elements encoding resistance to antimicrobial compounds. Front Biosci 1999; 4: d43. 10.2741/Actis - DOI - PubMed
    1. Millan AS. Evolution of plasmid-mediated antibiotic resistance in the clinical context. Trends Microbiol 2018; 26: 978–85. 10.1016/j.tim.2018.06.007 - DOI - PubMed
    1. Karaiskos I, Lagou S, Pontikis Ket al. . The “old” and the “new” antibiotics for MDR Gram-negative pathogens: for whom, when, and how. Front Public Health 2019; 7: 151. 10.3389/fpubh.2019.00151 - DOI - PMC - PubMed
    1. Mohapatra SS, Dwibedy SK, Padhy I. Polymyxins, the last-resort antibiotics: mode of action, resistance emergence, and potential solutions. J Biosci 2021; 46: 85. 10.1007/s12038-021-00209-8 - DOI - PMC - PubMed

LinkOut - more resources