

Non-destructive detection of kiwifruit soluble solid content based on hyperspectral and fluorescence spectral imaging
- PMID: 36743568
- PMCID: PMC9889828
- DOI: 10.3389/fpls.2022.1075929
Non-destructive detection of kiwifruit soluble solid content based on hyperspectral and fluorescence spectral imaging
Abstract
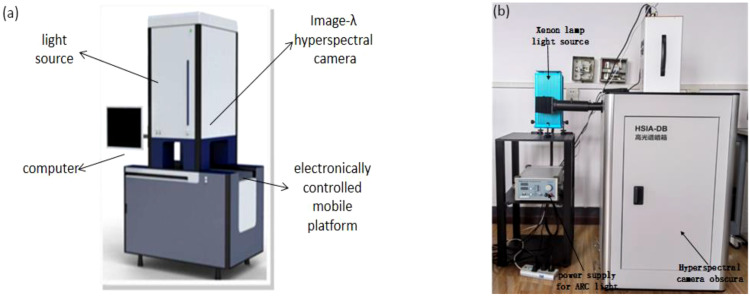
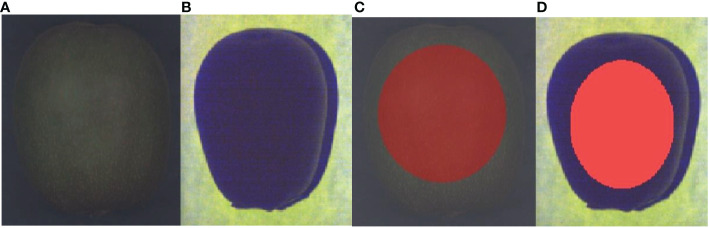
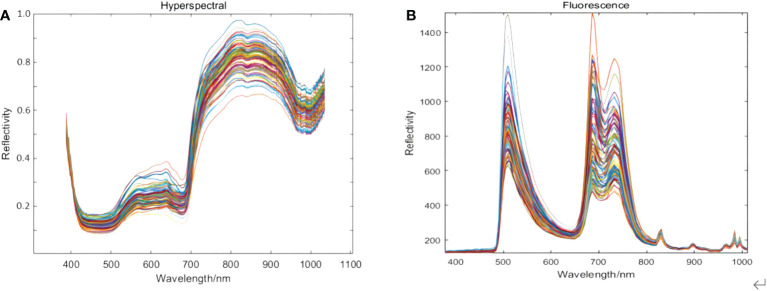
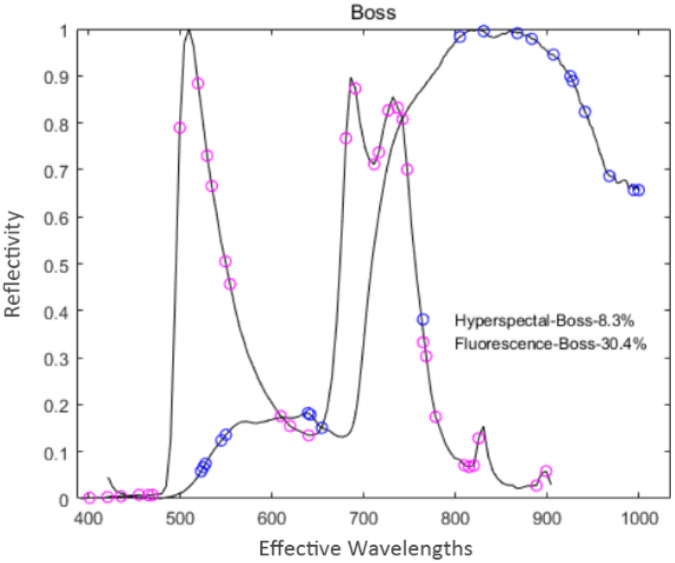
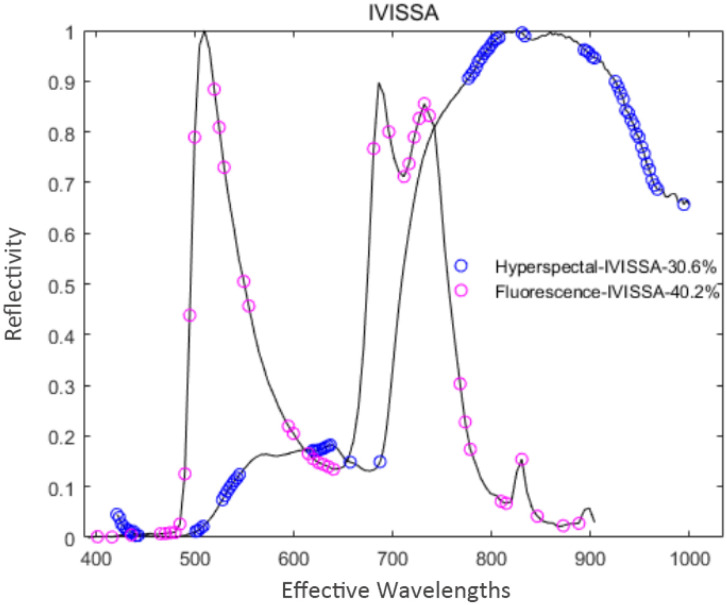
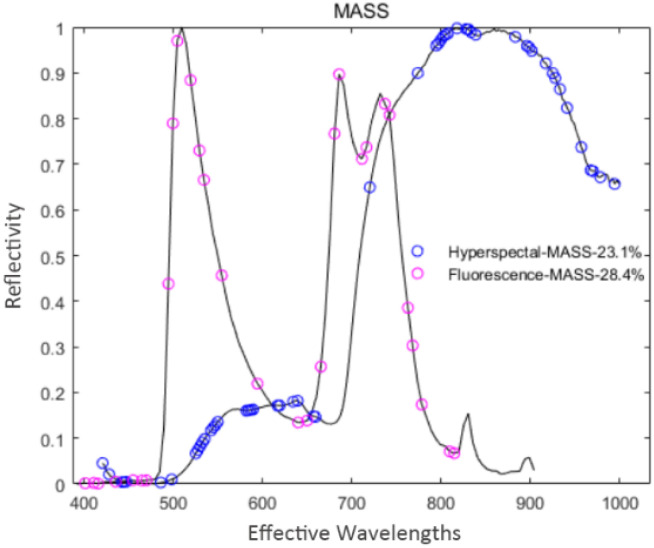
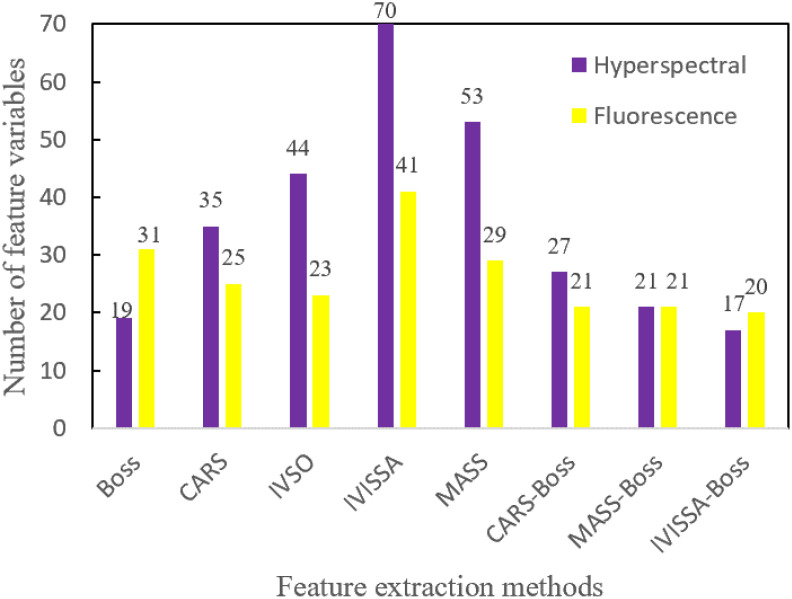
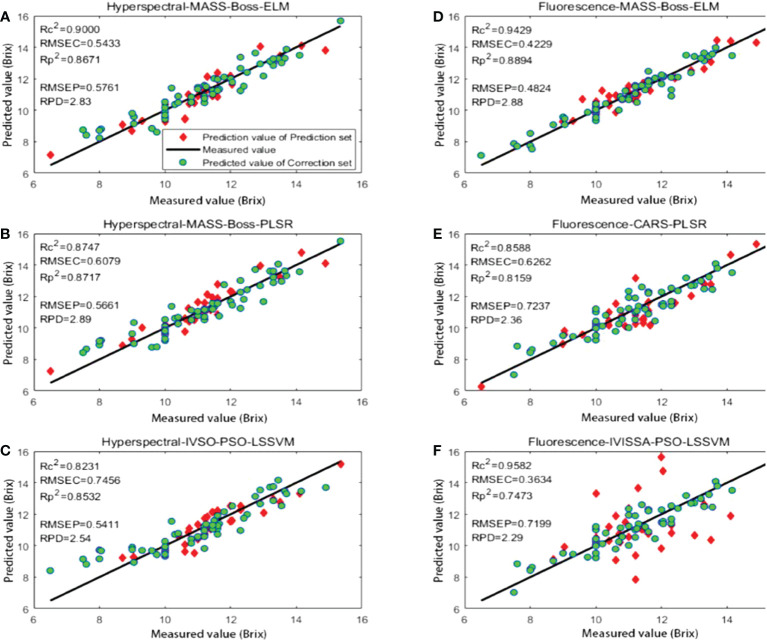
The soluble solid content (SSC) is one of the important parameters depicting the quality, maturity and taste of fruits. This study explored hyperspectral imaging (HSI) and fluorescence spectral imaging (FSI) techniques, as well as suitable chemometric techniques to predict the SSC in kiwifruit. 90 kiwifruit samples were divided into 70 calibration sets and 20 prediction sets. The hyperspectral images of samples in the spectral range of 387 nm~1034 nm and the fluorescence spectral images in the spectral range of 400 nm~1000 nm were collected, and their regions of interest were extracted. Six spectral pre-processing techniques were used to pre-process the two spectral data, and the best pre-processing method was selected after comparing it with the predicted results. Then, five primary and three secondary feature extraction algorithms were used to extract feature variables from the pre-processed spectral data. Subsequently, three regression prediction models, i.e., the extreme learning machines (ELM), the partial least squares regression (PLSR) and the particle swarm optimization - least square support vector machine (PSO-LSSVM), were established. The prediction results were analyzed and compared further. MASS-Boss-ELM, based on fluorescence spectral imaging technique, exhibited the best prediction performance for the kiwifruit SSC, with the , and RPD of 0.8894, 0.9429 and 2.88, respectively. MASS-Boss-PLSR based on the hyperspectral imaging technique showed a slightly lower prediction performance, with the , , and RPD of 0.8717, 0.8747, and 2.89, respectively. The outcome presents that the two spectral imaging techniques are suitable for the non-destructive prediction of fruit quality. Among them, the FSI technology illustrates better prediction, providing technical support for the non-destructive detection of intrinsic fruit quality.
Keywords: fluorescence spectral; hyperspectral; kiwifruit; non-destructive detection; ssc.
Copyright © 2023 Xu, Chen, Wang, Chen, Tang, Shi, Chen, Wang, Kang, Zou, Huang, He, Yang and Zhao.
Conflict of interest statement
The authors declare that the research was conducted in the absence of any commercial or financial relationships that could be construed as a potential conflict of interest. The reviewer ZG declared a shared affiliation with the author NY to the handling editor at the time of review. The handling editor JP declared a shared affiliation with the author YH at the time of review.
Figures
References
-
- Benelli A., Cevoli C., Fabbri A., Ragni L. (2022). Ripeness evaluation of kiwifruit by hyperspectral imaging. Biosyst. Eng. 223, 42–52. doi: 10.1016/j.biosystemseng.2021.08.009 - DOI
-
- Bhandari A. K., Kumar A., Singh G. K. (2015). Modified artificial bee colony based computationally efficient multilevel thresholding for satellite image segmentation using kapur’s, otsu and tsallis functions. Expert Syst. Appl. 42, 1573–1601. doi: 10.1016/j.eswa.2014.09.049 - DOI
-
- Bonah E., Huang X., Yi R., Aheto J. H., Yu S. (2020). Vis-NIR hyperspectral imaging for the classification of bacterial foodborne pathogens based on pixel-wise analysis and a novel CARS-PSO-SVM model. Infrared Phys. Technol. 105. doi: 10.1016/j.infrared.2020.103220 - DOI
LinkOut - more resources
Full Text Sources