. 2023 Jan 27:2023:1261039.
doi: 10.1155/2023/1261039. eCollection 2023.

Oxidative Stress Response Biomarkers of Ovarian Cancer Based on Single-Cell and Bulk RNA Sequencing

Affiliations

Oxidative Stress Response Biomarkers of Ovarian Cancer Based on Single-Cell and Bulk RNA Sequencing

Mingjun Zheng et al. Oxid Med Cell Longev. .

Abstract

Background: The occurrence and development of ovarian cancer (OV) are significantly influenced by increased levels of oxidative stress (OS) byproducts and the lack of an antioxidant stress repair system. Hence, it is necessary to explore the markers related to OS in OV, which can aid in predicting the prognosis and immunotherapeutic response in patients with OV.

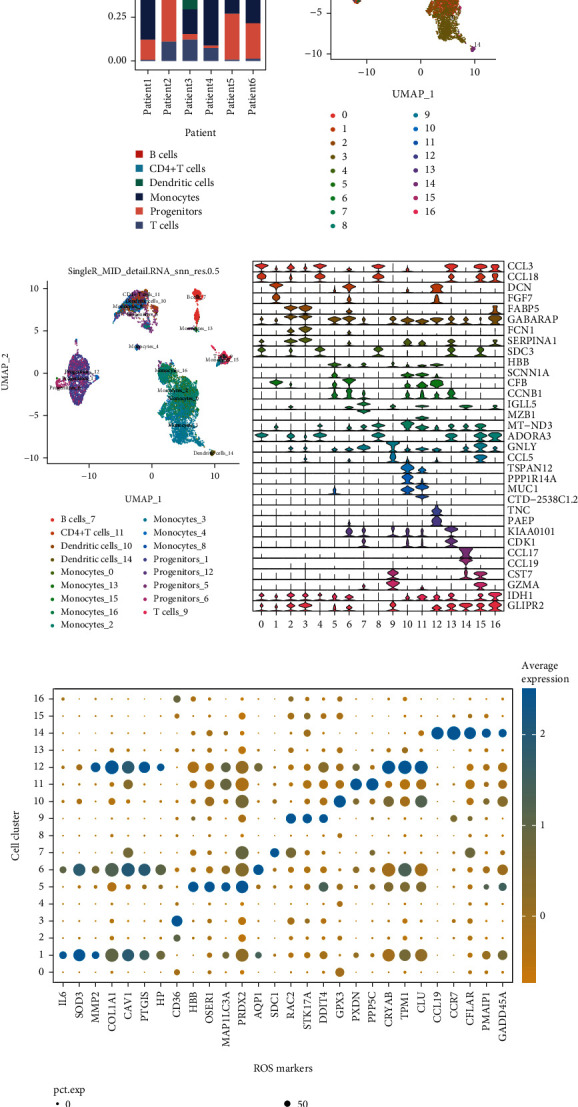
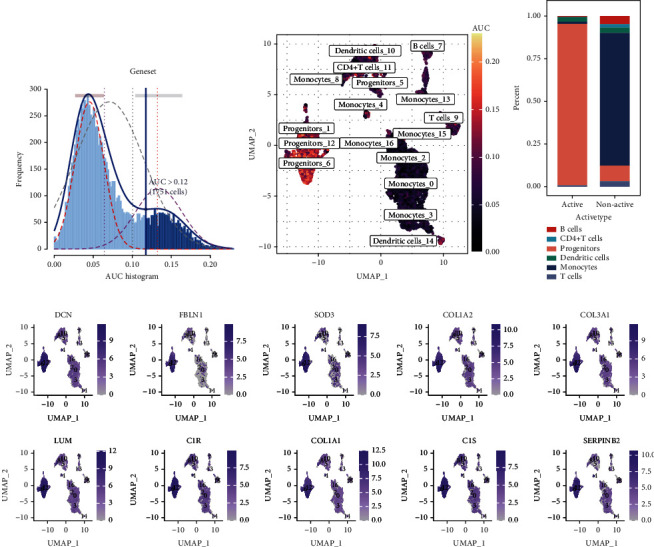
Methods: The single-cell RNA-sequencing (scRNA-seq) dataset GSE146026 was retrieved from the Gene Expression Omnibus (GEO) database, and Bulk RNA-seq data were obtained from TCGA and GTEx databases. The Seurat R package and SingleR package were used to analyze scRNA-seq and to identify OS response-related clusters based on ROS markers. The "limma" R package was used to identify the differentially expressed genes (DEGs) between normal and ovarian samples. The risk model was constructed using the least absolute shrinkage and selection operator (LASSO) regression analysis. The immune cell infiltration, genomic mutation, and drug sensitivity of the model were analyzed using the CIBERSORT algorithm, the "maftools," and the "pRRophetic" R packages, respectively.

Results: Based on scRNA-seq data, we identified 12 clusters; OS response-related genes had the strongest specificity for cluster 12. A total of 151 genes were identified from 2928 DEGs to be significantly correlated with OS response. Finally, nine prognostic genes were used to construct the risk score (RS) model. The risk score model was an independent prognostic factor for OV. The gene mutation frequency and tumor immune microenvironment in the high- and low-risk score groups were significantly different. The value of the risk score model in predicting immunotherapeutic outcomes was confirmed.

Conclusions: OS response-related RS model could predict the prognosis and immune responses in patients with OV and provide new strategies for cancer treatment.


Conflict of interest statement

The authors declare that the research was conducted in the absence of any commercial or financial relationships that could be construed as a potential conflict of interest.

Figures

Figure 1
Figure 1
Identification of cell subgroups and expression of marker genes from single-cell RNA-sequencing database. (a) Cumulative histogram shows the distribution of cell types in patients with OV. (b) UMAP map shows the distribution of ovarian cancer (OV) cell subgroups. (c) UMAP map shows annotation results of OV cell subgroups. (d) Violin diagram shows the expression of genes specific to cell subgroups. (e) The bubble diagram shows the expression of genes related to oxidative stress (OS) responses in each cell subgroup. The darker the color blue, the higher the average expression, and the size of the dot represents the number of expressed cells.
Figure 2
Figure 2
Identification of active cell subgroups. (a) AUC score of the oxidative stress marker genes, the threshold value was 0.12. (b) UMAP colorogram shows the score of cell activity. The brighter the color, the higher the activity. (c) Histogram shows the cumulative distribution of active and inactive cell population. (d) The FeaturePlot shows the active cell population.
Figure 3
Figure 3
Cox and LASSO regression analysis of the TCGA-OV dataset. (a) Change trajectory of LASSO regression independent variable, the abscissa represents the logarithm of the independent variable lambda, and the ordinate represents the coefficient of the independent variable. (b) Confidence interval under each lambda in LASSO regression. (c) LASSO regression coefficient of key prognostic genes. (d–k) KM survival curve of prognostic gene signature obtained using Cox regression analysis (with significant differences), yellow represents the high-risk group, and blue represents the low-risk group.
Figure 4
Figure 4
The performance of the model in different cohorts. (a, c, e, g) The survival curve of patients in high- and low-risk groups from TCGA training cohort, the entire TCGA, the GSE17260, and the GSE26712 cohorts, respectively. Yellow represents the high-risk group, and blue represents the low-risk group. (b, d, f, h) 1-, 3-, and 5-year time-dependent ROC curves of models for TCGA training, the entire TCGA, GSE17260, the GSE26712 cohorts.
Figure 5
Figure 5
RS is an independent prognostic factor for clinical characteristics. (a, b) Forest map shows the results of Cox regression analysis performed on clinical characteristics of TCGA cohort. (c) The nomogram of the prediction model. The line segment represents the contribution of the clinical factor to the outcome events, total points represent the total score of the sum of the corresponding individual scores of the value of all variables, and the bottom three lines represent the prognosis of 1-, 3-, and 5-year survival corresponding to each value point. (d–g) The prognosis prediction was based on clinical characteristics like age < 60, age ≥ 60, grade 3/4, and FIGO stage III/IV, respectively. Yellow represents the high-risk group, and blue represents the low-risk group.
Figure 6
Figure 6
Single nucleotide variant (SNV) between model groups. (a, b) SNV waterfall of top 20 (mutation frequency) genes in the patients in the high- and low-risk groups. (c) KM survival curve in patients in high- and low-TMB groups. Yellow indicates the high-TMB group; blue indicates the low-TMB group. (d) The scatter diagram shows a correlation between RS and TMB. Red represents the high-risk group, and blue represents the low-risk group.
Figure 7
Figure 7
Analysis of immune cell infiltration characteristics of the model. (a) The box diagram shows the difference in the proportion of 22 infiltrating immune cells in the patients in the high- and low-risk groups. Yellow represents the high-risk group, and blue represents the low-risk group. (b, c) Cumulative histogram shows the proportion of immune cell infiltration in the high- and low-risk groups. Different colors represent different cell types. (b) The high-risk group and (c) the low-risk group. (d) The correlation heat map shows an expression of nine model genes and immune checkpoints, and the color of the dot represents the correlation.
Figure 8
Figure 8
Differences in the pathway enrichment between high- and low-risk groups. (a) The heat map shows the enrichment score of differentially enriched pathways. The asterisks represent the significant differences in enrichment scores. (b) The heat map shows the correlation between the enrichment score of the differentially enriched KEGG pathway and RS. (c) The heat map shows the correlation between the enrichment score of the differentially enriched HALLMARK pathway and RS.
Figure 9
Figure 9
The RS model predicts the treatment outcomes of patients with OV. (a–h) The difference in the distribution of IC50 values of eight chemotherapeutic drugs between the high-risk and low-risk groups. Red represents the high-risk group, and blue represents the low-risk group. (i) The heat map shows the correlation between the expression of model genes and the IC50 values of chemotherapeutic drugs. The color of the dot represents the high and low correlation; represents the significance. (j) Histogram shows the cumulative distribution of immunotherapy response in patients in the high-risk and low-risk groups. (k) The violin diagram shows the distribution of RS in different immunotherapy response groups; the value is the significant difference in response between the two groups. Based on the effectiveness of immunotherapy, it is divided into complete response (CR), partial response (PR), stable disease (SD), or progressive disease (PD).

Similar articles

Cited by

References

    1. Lheureux S., Gourley C., Vergote I., Oza A. M. Epithelial ovarian cancer. The Lancet . 2019;393(10177):1240–1253. doi: 10.1016/S0140-6736(18)32552-2. - DOI - PubMed
    1. Sung H., Ferlay J., Siegel R. L., et al. Global cancer statistics 2020: GLOBOCAN estimates of incidence and mortality worldwide for 36 cancers in 185 countries. CA: a Cancer Journal for Clinicians . 2021;71(3):209–249. doi: 10.3322/caac.21660. - DOI - PubMed
    1. Siegel R. L., Miller K. D., Fuchs H. E., Jemal A. Cancer statistics, 2021. CA: a Cancer Journal for Clinicians . 2021;71(1):7–33. doi: 10.3322/caac.21654. - DOI - PubMed
    1. Dafni U., Martín-Lluesma S., Balint K., et al. Efficacy of cancer vaccines in selected gynaecological breast and ovarian cancers: a 20-year systematic review and meta-analysis. European Journal of Cancer . 2021;142:63–82. doi: 10.1016/j.ejca.2020.10.014. - DOI - PubMed
    1. Zeng H., Zheng R., Guo Y., et al. Cancer survival in China, 2003–2005: a population-based study. International Journal of Cancer . 2015;136(8):1921–1930. doi: 10.1002/ijc.29227. - DOI - PubMed