. 2023 Jan 20:13:1029270.
doi: 10.3389/fgene.2022.1029270. eCollection 2022.

The new oncogene transmembrane protein 60 is a potential therapeutic target in glioma

Affiliations

The new oncogene transmembrane protein 60 is a potential therapeutic target in glioma

Fengdong Yang et al. Front Genet. .

Abstract

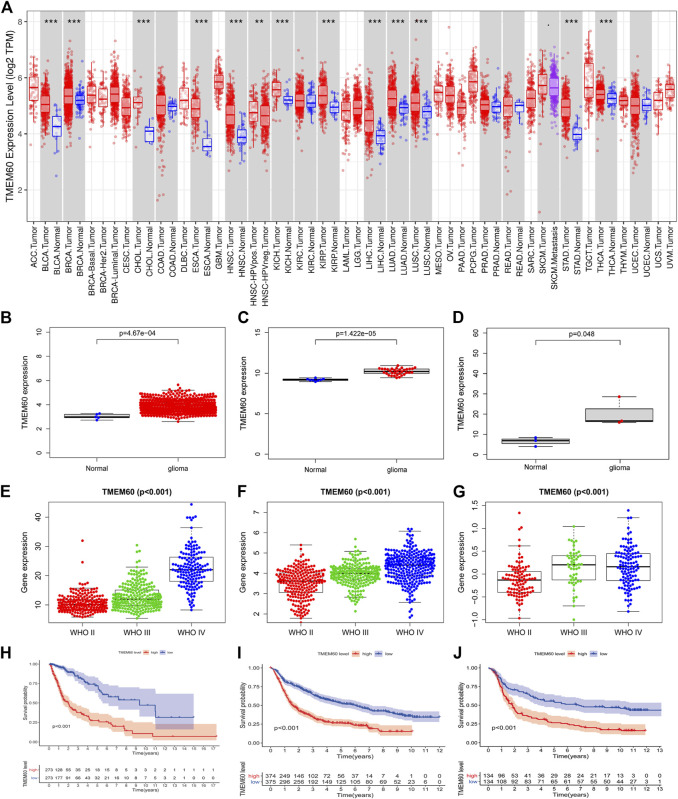
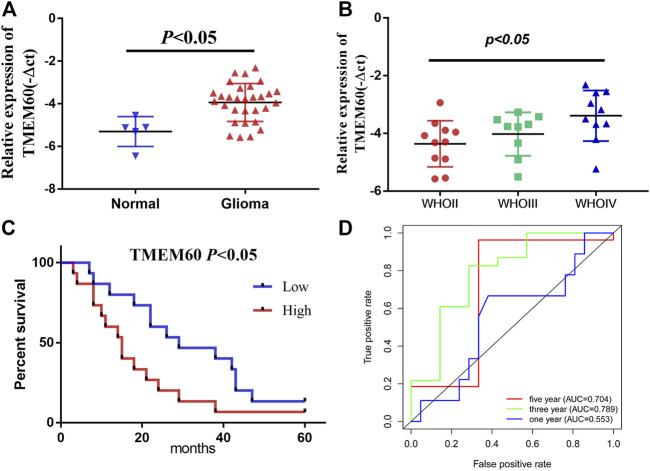
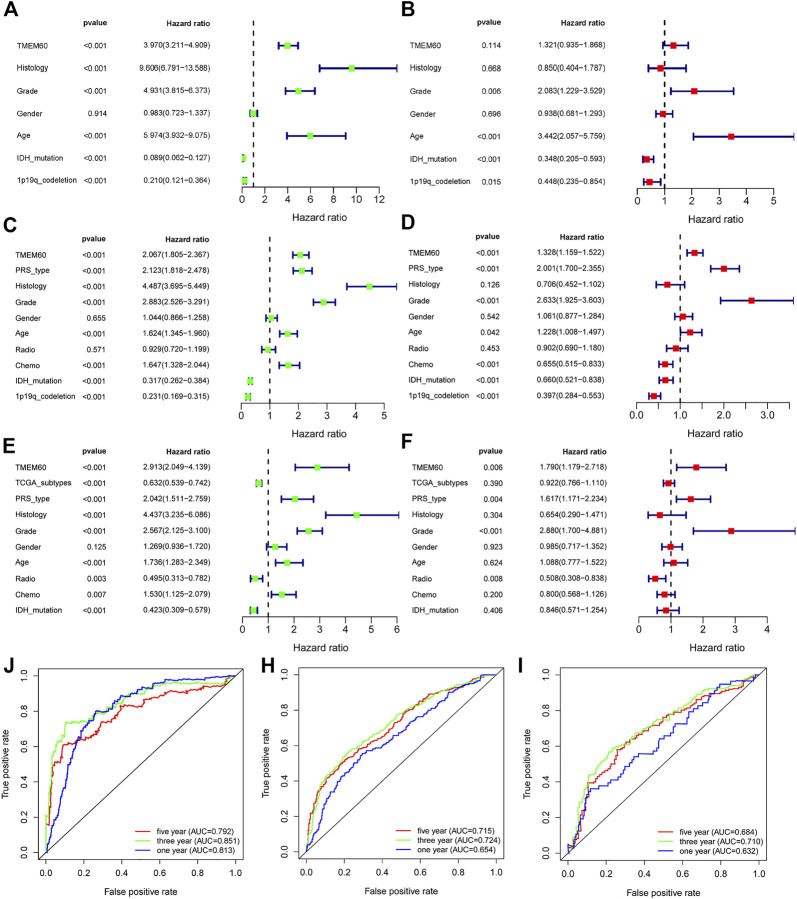
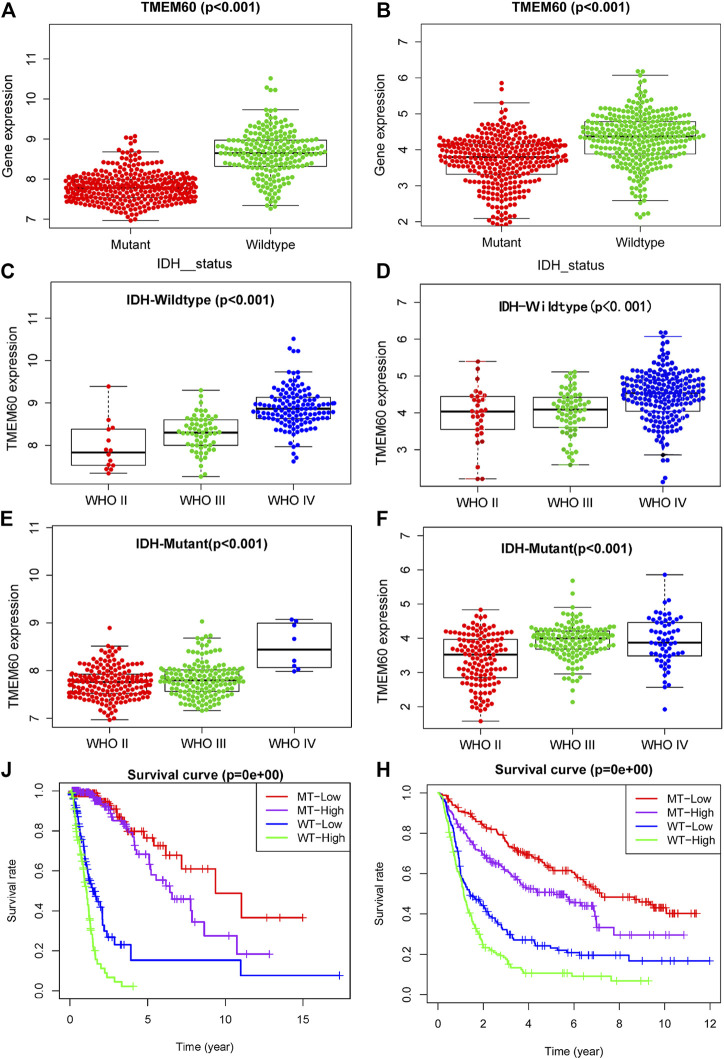
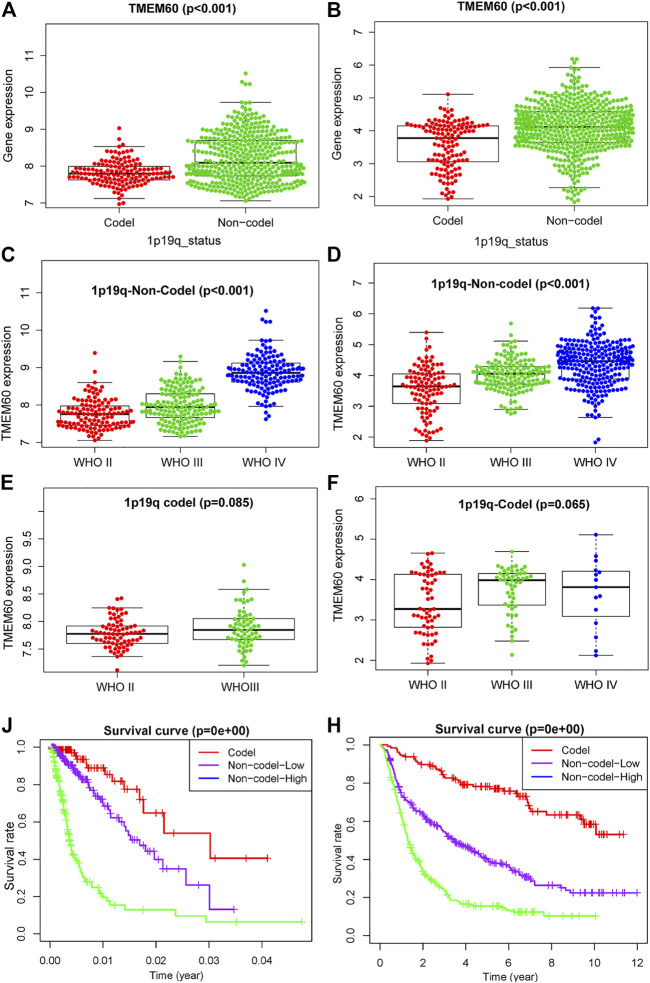
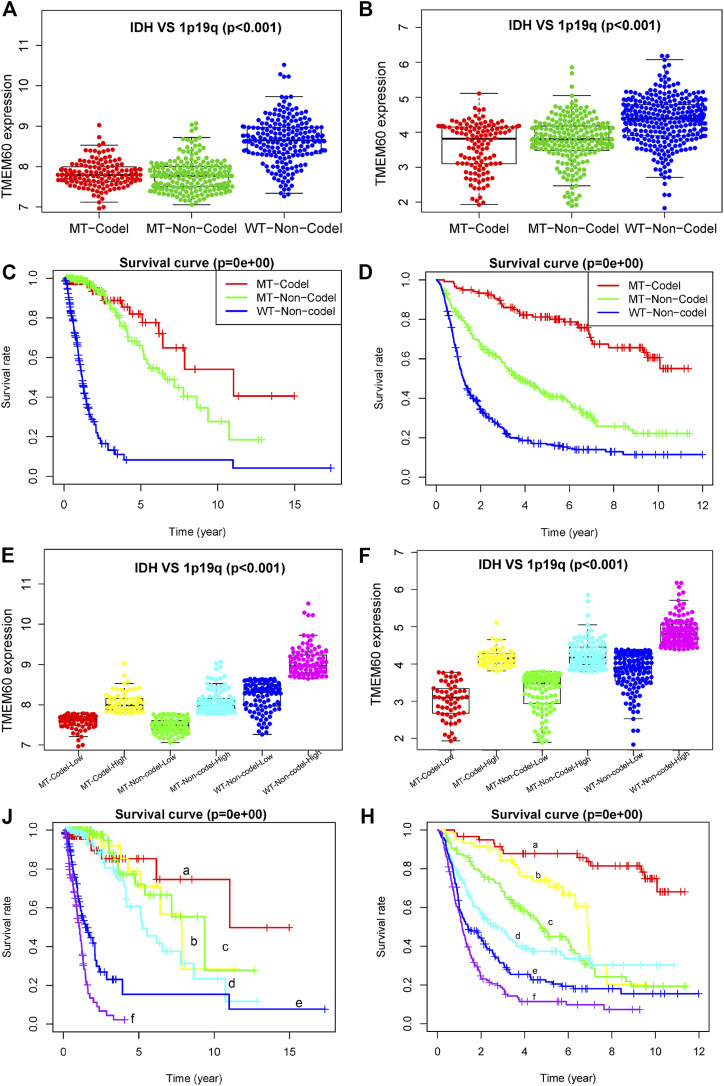
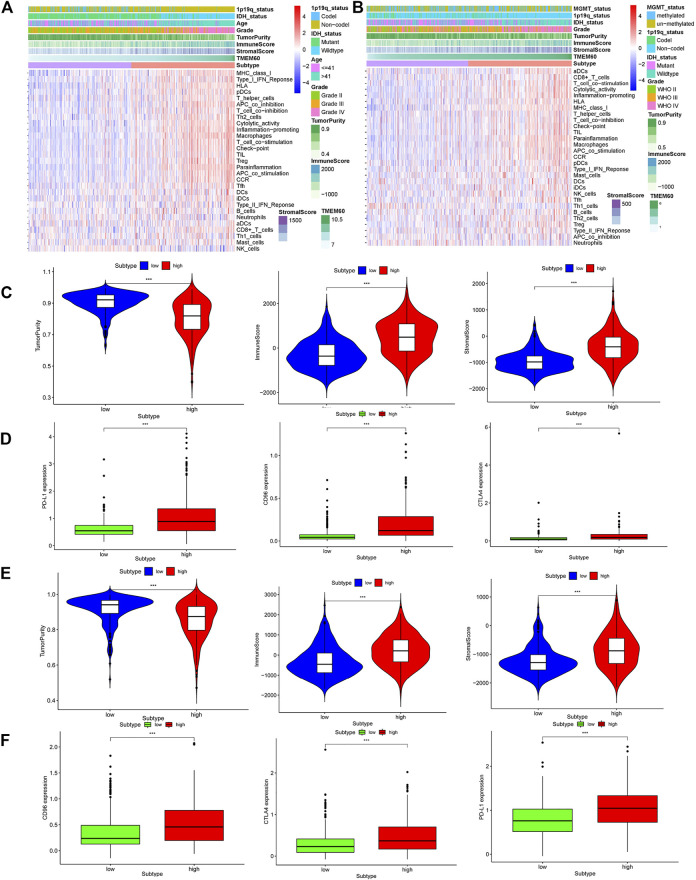
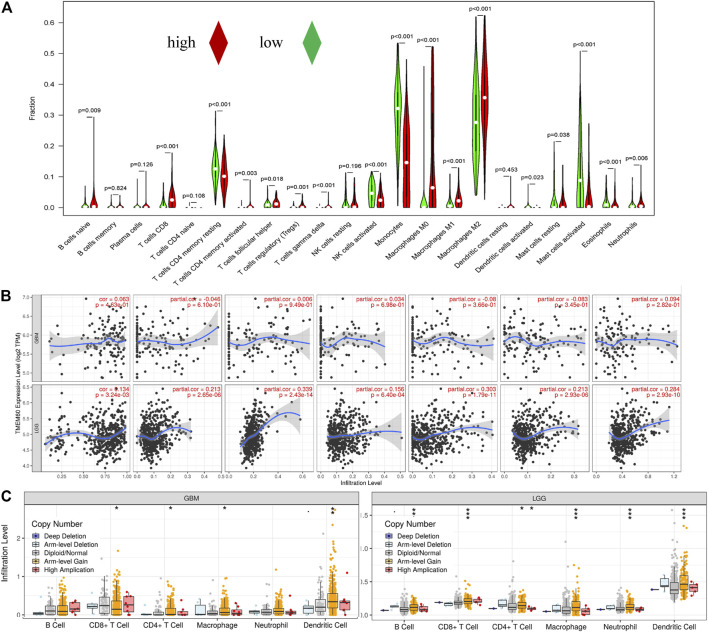
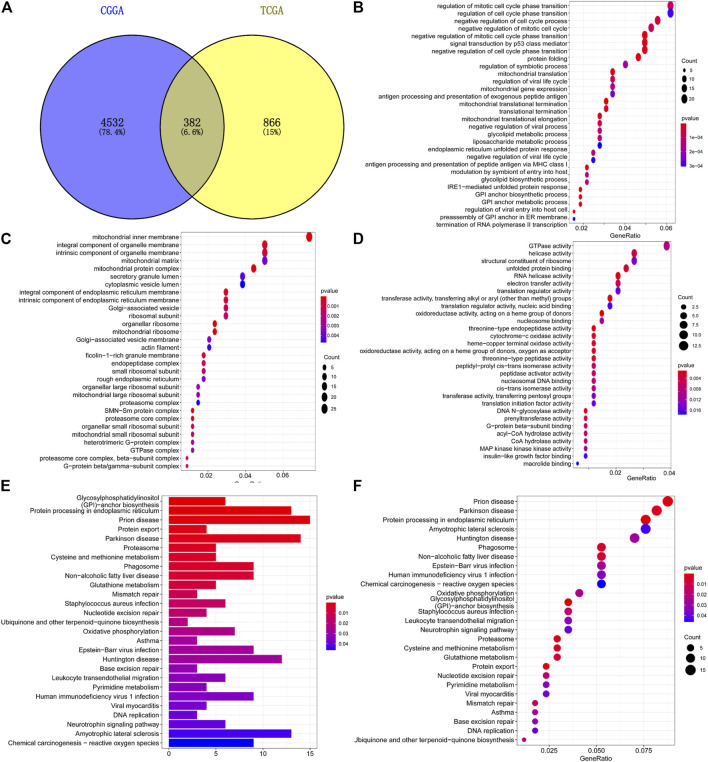
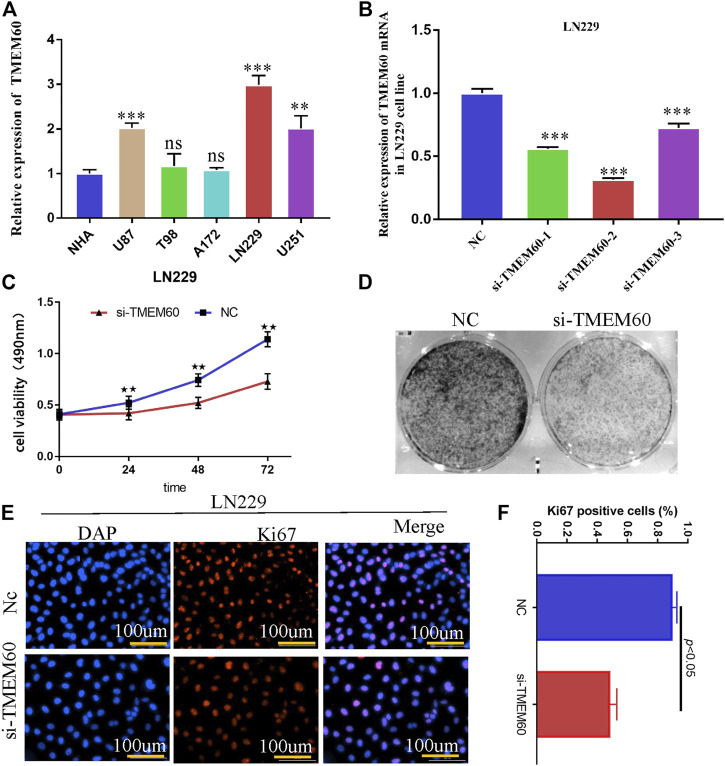
Glioma is a malignant tumor with a high fatality rate, originating in the central nervous system. Even after standard treatment, the prognosis remains unsatisfactory, probably due to the lack of effective therapeutic targets. The family of transmembrane proteins (TMEM) is a large family of genes that encode proteins closely related to the malicious behavior of tumors. Thus, it is necessary to explore the molecular and clinical characteristics of newly identified oncogenes, such as transmembrane protein 60 (TMEM60), to develop effective treating options for glioma. We used bioinformatic methods and basic experiments to verify the expression of transmembrane protein 60 in gliomas and its relationship with 1p and 19q (1p19q) status, isocitrate dehydrogenase (IDH) status, patient prognosis, and immune cell infiltration using public databases and clinical samples. In addition, Gene Ontology (GO) and Kyoto Encyclopedia of Genes and Genomes (KEGG) enrichment analyses were performed to detect co-expressed genes. Thus, we inhibited the expression of transmembrane protein 60 to observe the proliferation and activity of glioma LN229 cells. We found transmembrane protein 60 was significantly upregulated in glioma compared with that in normal brain tissue at the mRNA. In the subgroups of World Health Organization high grade, isocitrate dehydrogenase wildtype, 1p and 19q non-codeletion, or isocitrate dehydrogenase wild combined with 1p and 19q non-codeletion, the expression of transmembrane protein 60 increased, and the prognosis of glioma patients worsened. In the transmembrane protein 60 high expression group, infiltration of immune cells and stromal cells in the tumor microenvironment increased, tumor purity decreased, and immune cells and pathways were activated. The immune cells mainly included regulatory T-cell, gamma delta T-cell, macrophages M0, neutrophils, and CD8+ T-cells. Overexpression of co-inhibitory receptors (CTLA4, PDL1 and CD96) may promote the increase of depletion of T-cell, thus losing the anti-tumor function in the transmembrane protein 60 high expression group. Finally, we found that transmembrane protein 60 silencing weakened the viability, proliferation, and colony formation of glioma LN229 cells. This is the 0 report on the abnormally high expression of transmembrane protein 60 in glioma and its related clinical features, such as tumor microenvironment, immune response, tumor heterogeneity, and patient prognosis. We also found that transmembrane protein 60 silencing weakened the proliferation and colony formation of glioma LN229 cells. Thus, the new oncogene transmembrane protein 60 might be an effective therapeutic target for the clinical treatment of glioma.

Keywords: 1p19q; biomarker; glioma; isocitrate dehydrogenase 1; transmembrane protein 60; tumor microenvironment.


Conflict of interest statement

The authors declare that the research was conducted in the absence of any commercial or financial relationships that could be construed as a potential conflict of interest.

Figures

FIGURE 1
FIGURE 1
High expression of transmembrane protein 60 (TMEM60) indicates poor prognosis in glioma patients. (A) Relative expression of TMEM60 in various tumors based on the TIMRE database. Expression levels of TMEM60 in all gliomas and normal brain tissues based on (B) The Cancer Genome Atlas (TCGA), (C) GSE116520, and (D) GSE153692. Relationship between the expression levels of TMEM60 and the World Health Organization (WHO) grades based on (E) TCGA mRNA sequencing (mRNA-seq), (F) Chinese Glioma Genome Atlas (CGGA) mRNA-seq, and (G) CGGA microarray. Survival curve of glioma patients related to TMEM60 expression based on (H) TCGA mRNA-seq, (I) CGGA mRNA-seq, and (J) CGGA microarray.
FIGURE 2
FIGURE 2
Relative expression and clinical significance of TMEM60 in clinical samples. (A) TMEM60 expression in different tissues and (B) different WHO grades. (C) Correlation between TMEM60 expression and prognosis of glioma patients. (D) Receiver operating characteristic (ROC) curve of TMEM60 and prognosis of glioma patients.
FIGURE 3
FIGURE 3
TMEM60 is an independent prognostic factor for glioma patients. Univariate analysis, multivariate analysis, and ROC curve analysis related to clinical indicators of glioma patients and TMEM60 expression in (A,B and J) TCGA, (C,D and H) CGGA-325, and (E,F and I) CGGA-693.
FIGURE 4
FIGURE 4
Effect of TMEM60 expression combined with isocitrate dehydrogenase (IDH) status on the survival time of glioma patients. Relationship between TMEM60 expression and IDH status based on (A) TCGA and (B) CGGA. Relationship between TMEM60 expression and the WHO grade in the subgroups of IDH mutants in (C) TCGA and (D) CGGA and the subgroups of IDH wild type in (E) TCGA and (F) CGGA. Relationship between TMEM60 expression and patient survival time in the subgroups of different IDH status in (J) TCGA and (H) CGGA. MT-low: IDH mutant and TMEM60 low expression; MT-High: IDH mutant and TMEM60 High expression; WT-low: IDH wildtype and TMEM60 low expression; WT-High: IDH wildtype and TMEM60 high expression.
FIGURE 5
FIGURE 5
Effect of TMEM60 expression combined with 1p19q status on the survival time of glioma patients. Relationship between TMEM60 expression and 1p19q status in (A) TCGA and (B) CGGA. Relationship between TMEM60 expression and the WHO grade in the subgroups of 1p19q non-codel in (C) TCGA and (D) CGGA and the subgroups of 1p19q codel in (E) TCGA and (F) CGGA. Relationship between TMEM60 expression and patient survival time in the subgroups of different 1p19q status in (J) TCGA and (H) CGGA. Codel: 1p19q codeletion, Non-codel-Low: 1p19q non-codeletion and TMEM60 low expression, Non-codel-High:1p19q non-codeletion and TMEM60 high expression.
FIGURE 6
FIGURE 6
Influence of TMEM60, 1p19q status, and IDH status on the survival time of glioma patients. Expression level of TMEM60 in different subgroups of 1p19q status and IDH status in (A) TCGA and (B) CGGA. Survival curves of glioma patients in different subgroups of 1p19q status and IDH status in (C) TCGA and (D) CGGA. Six subgroups according to TMEM60 expression, 1p19q status, and IDH status in (E) TCGA and (F) CGGA. Survival curves of glioma patients in different subgroups of (J) TCGA and (H) CGGA. a, IDH MT-1p19q codel-low TMEM60: IDH mutant and 1p19q codeletion and TMEM60 low expression; b, IDH MT-1p19q codel-high TMEM60: IDH mutant and 1p19q codeletion and TMEM60 high expression; c, IDH MT-1p19q non-codel-low TMEM60: IDH mutant and 1p19q non-codeletion and TMEM60 low expression; d, IDH MT-1p19q non-codel-high TMEM60: IDH mutant and 1p19q non-codeletion and TMEM60 high expression; e, IDH WT-1p19q non-codel-low TMEM60: IDH wildtype and 1p19q non-codeletion and TMEM60 low expression; f, IDH WT-1p19q non-codel-high TMEM60: IDH wildtype and 1p19q non-codeletion and TMEM60 high expression.
FIGURE 7
FIGURE 7
Relationship between TMEM60 and tumor microenvironment. Immune microenvironment heatmaps related to TMEM60 expression in (A) TCGA and (B) CGGA. Correlation between microenvironment-related indicators and TMEM60 in (C) TCGA and (E) CGGA. Correlation between TMEM60 and tumor immune checkpoint expression (CD96, PD-L1, CTLA4) in (D) TCGA and (F) CGGA.
FIGURE 8
FIGURE 8
Correlation between TMEM60 and tumor immune cell infiltration. (A) Correlation between TMEM60 expression and immune cell infiltration in TCGA. (B) Correlation between TMEM60 expression and immune cell infiltration in the TIMRE database. (C) Infiltration levels among tumors with different somatic copy number alterations for TMEM60 in the TIMRE database.
FIGURE 9
FIGURE 9
Enrichment analysis of co-expressed genes with TMEM60. (A) Intersection of TMEM60 co-expressed genes in TCGA and CGGA. (B) Cellular component analysis of co-expressed genes. (C) Biological process analysis of co-expressed genes. (D) Molecular function analysis of co-expressed genes. (E,F) Co-expressed gene enrichment pathways.
FIGURE 10
FIGURE 10
Silencing TMEM60 inhibits the viability and proliferation of glioma cells. (A) Relative expression of TMEM60 in various glioma and normal human astrocytes (NHA) cells. (B) Silencing efficiency of different TMEM60 inhibitors. (C) Activity of LN229 cells at different time points after TMEM60 silencing. (D) Clone formation ability of LN229 cells after TMEM60 silencing. (E) Expression of nuclear protein Ki67 in LN229 after TMEM60 silencing. (F) Quantification of nuclear protein Ki67 expression after TMEM60 silencing.

References

    1. Balkwill F. R., Capasso M., Hagemann T. (2012). The tumor microenvironment at a glance. J. Cell Sci. 125 (23), 5591–5596. 10.1242/jcs.116392 - DOI - PubMed
    1. Bao Z. S., Chen H. M., Yang M. Y., Zhang C. B., Yu K., Ye W. L., et al. (2014). RNA-seq of 272 gliomas revealed a novel, recurrent PTPRZ1-MET fusion transcript in secondary glioblastomas. Genome Res. 24 (11), 1765–1773. 10.1101/gr.165126.113 - DOI - PMC - PubMed
    1. Cancer Genome Atlas Research Network Brat D. J., Verhaak R. G., Aldape K. D., Yung W. K., Salama S. R., Cooper L. A., et al. (2015). Comprehensive, integrative genomic analysis of diffuse lower-grade gliomas. N. Engl. J. Med. 372 (26), 2481–2498. 10.1056/NEJMoa1402121 - DOI - PMC - PubMed
    1. Bray F., Ferlay J., Soerjomataram I., Siegel R. L., Torre L. A., Jemal A. (2020). Global cancer statistics 2018: GLOBOCAN estimates of incidence and mortality worldwide for 36 cancers in 185 countries. CA Cancer J. Clin. 7068 (46), 313394–313424. 10.3322/caac.21492 - DOI - PubMed
    1. Catalano V., Turdo A., Di Franco S., Dieli F., Todaro M., Stassi G. (2013). Tumor and its microenvironment: A synergistic interplay. Semin. Cancer Biol. 23 (6), 522–532. 10.1016/j.semcancer.2013.08.007 - DOI - PubMed