. 2023 Mar 3;132(5):545-564.
doi: 10.1161/CIRCRESAHA.121.320541. Epub 2023 Feb 6.

Dysregulated Smooth Muscle Cell BMPR2-ARRB2 Axis Causes Pulmonary Hypertension

Affiliations

Dysregulated Smooth Muscle Cell BMPR2-ARRB2 Axis Causes Pulmonary Hypertension

Lingli Wang et al. Circ Res. .

Abstract

Objective: Mutations in BMPR2 (bone morphogenetic protein receptor 2) are associated with familial and sporadic pulmonary arterial hypertension (PAH). The functional and molecular link between loss of BMPR2 in pulmonary artery smooth muscle cells (PASMC) and PAH pathogenesis warrants further investigation, as most investigations focus on BMPR2 in pulmonary artery endothelial cells. Our goal was to determine whether and how decreased BMPR2 is related to the abnormal phenotype of PASMC in PAH.

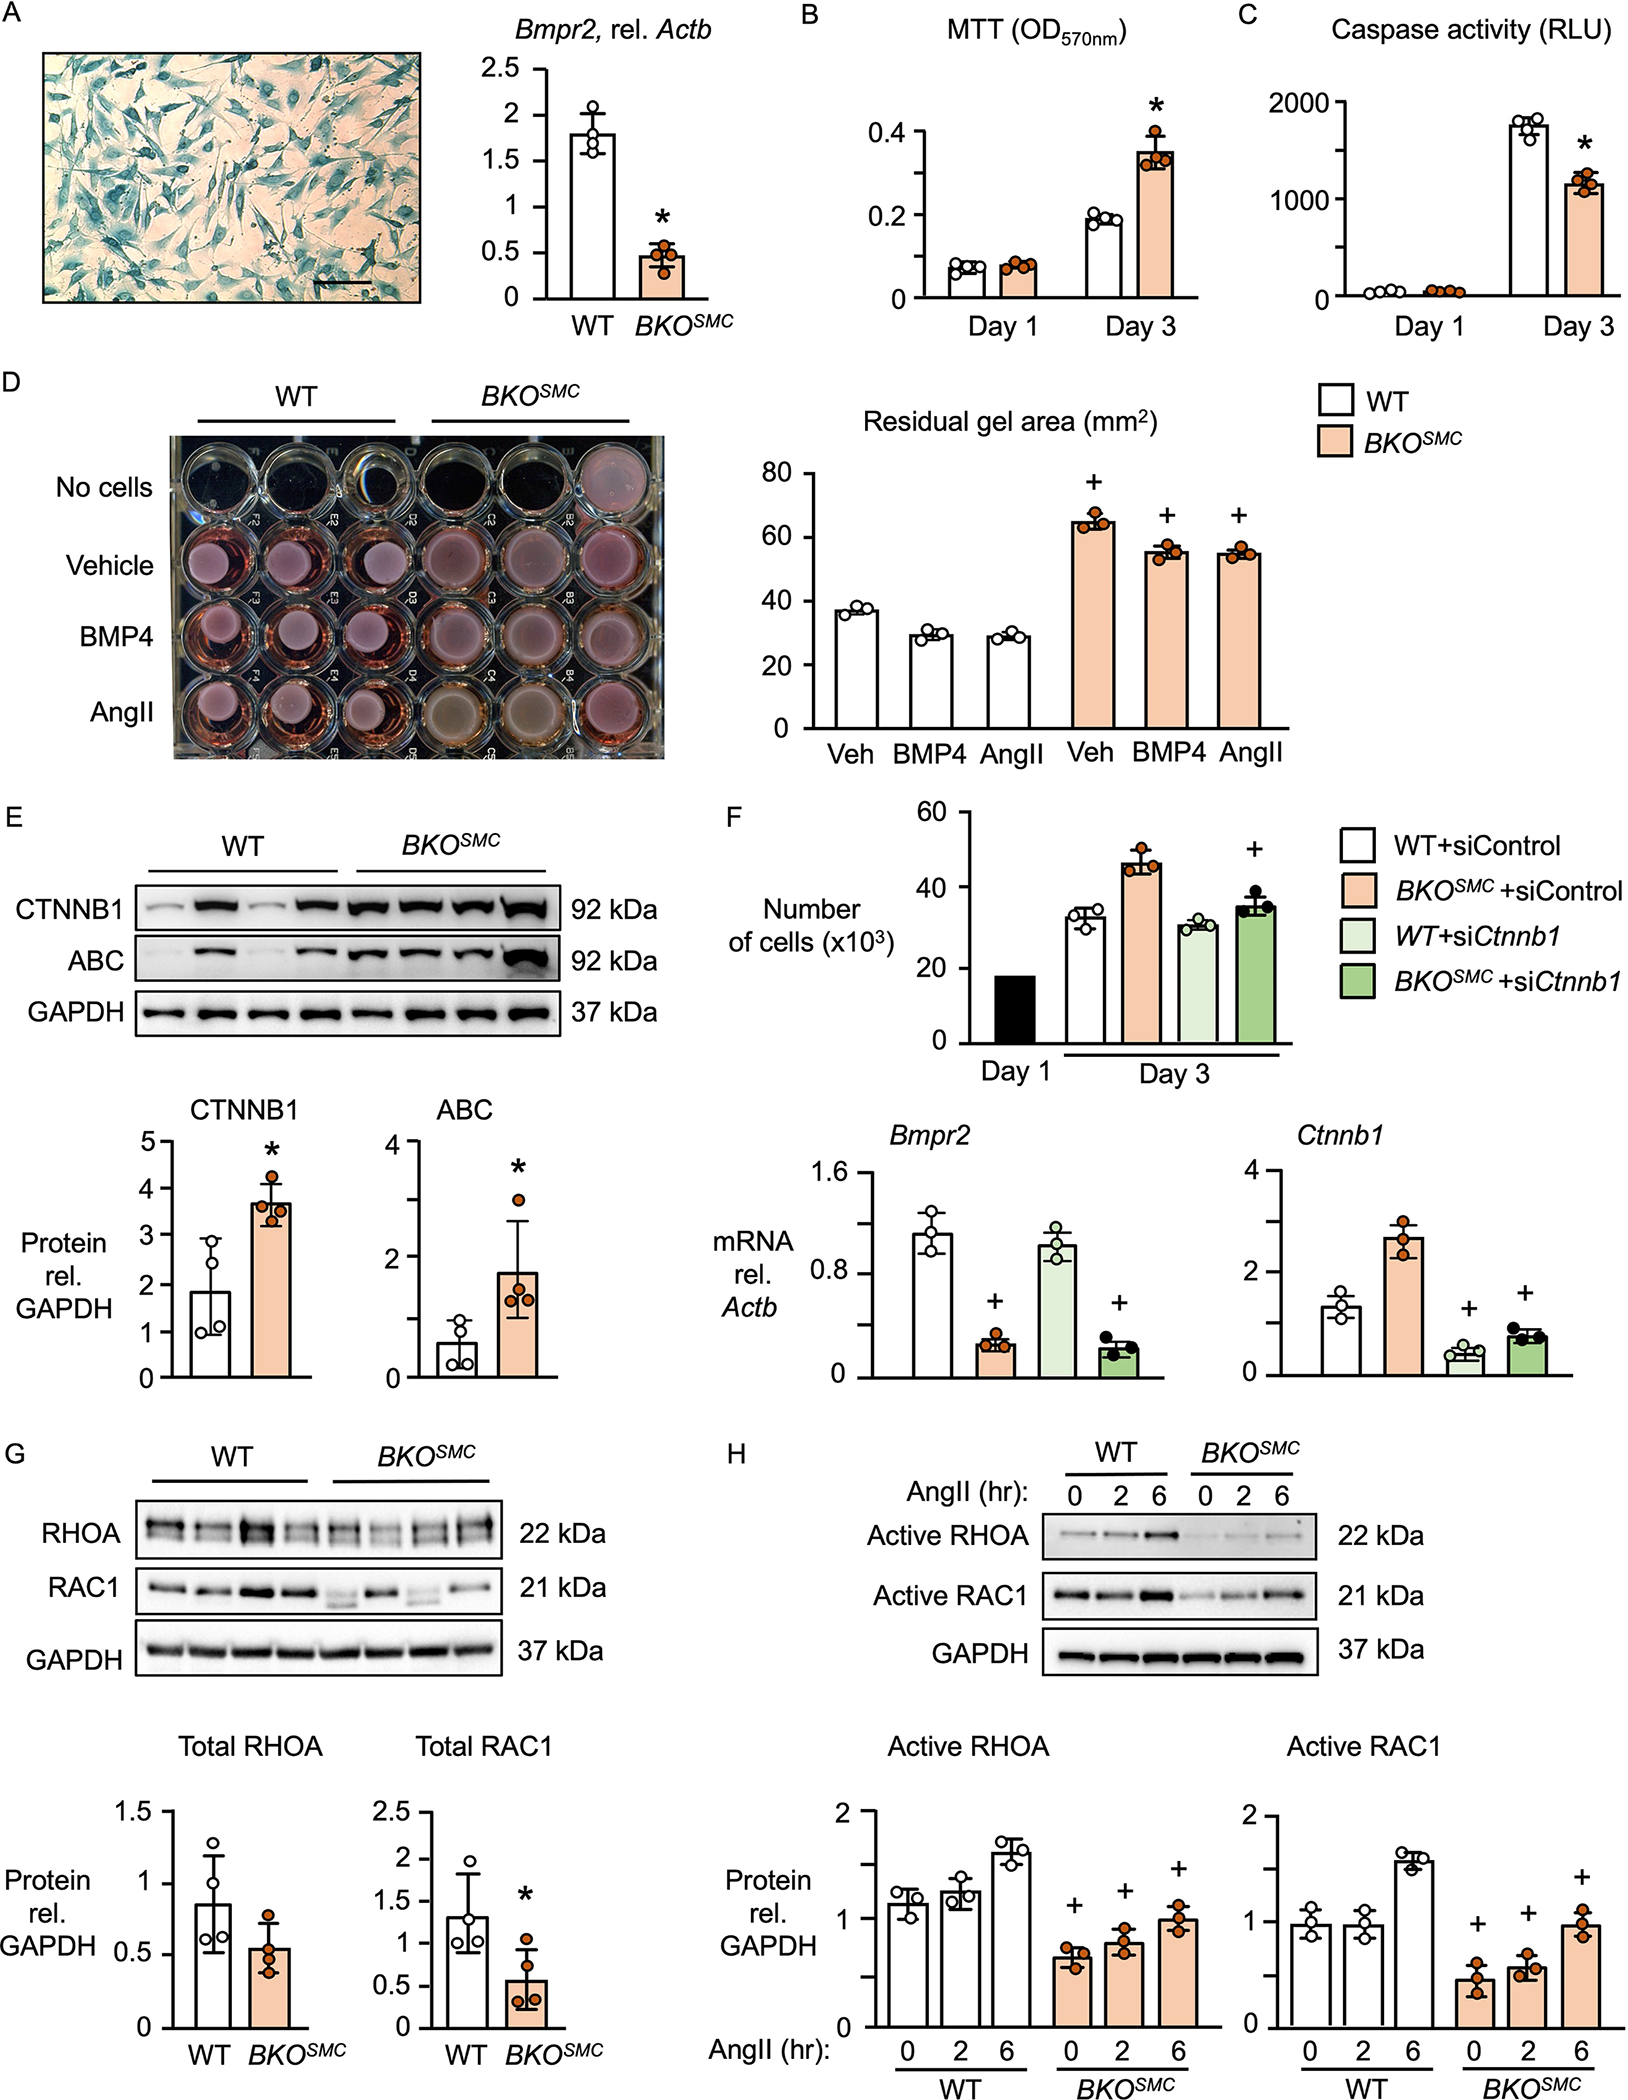
Methods: SMC-specific Bmpr2-/- mice (BKOSMC) were created and compared to controls in room air, after 3 weeks of hypoxia as a second hit, and following 4 weeks of normoxic recovery. Echocardiography, right ventricular systolic pressure, and right ventricular hypertrophy were assessed as indices of pulmonary hypertension. Proliferation, contractility, gene and protein expression of PASMC from BKOSMC mice, human PASMC with BMPR2 reduced by small interference RNA, and PASMC from PAH patients with a BMPR2 mutation were compared to controls, to investigate the phenotype and underlying mechanism.

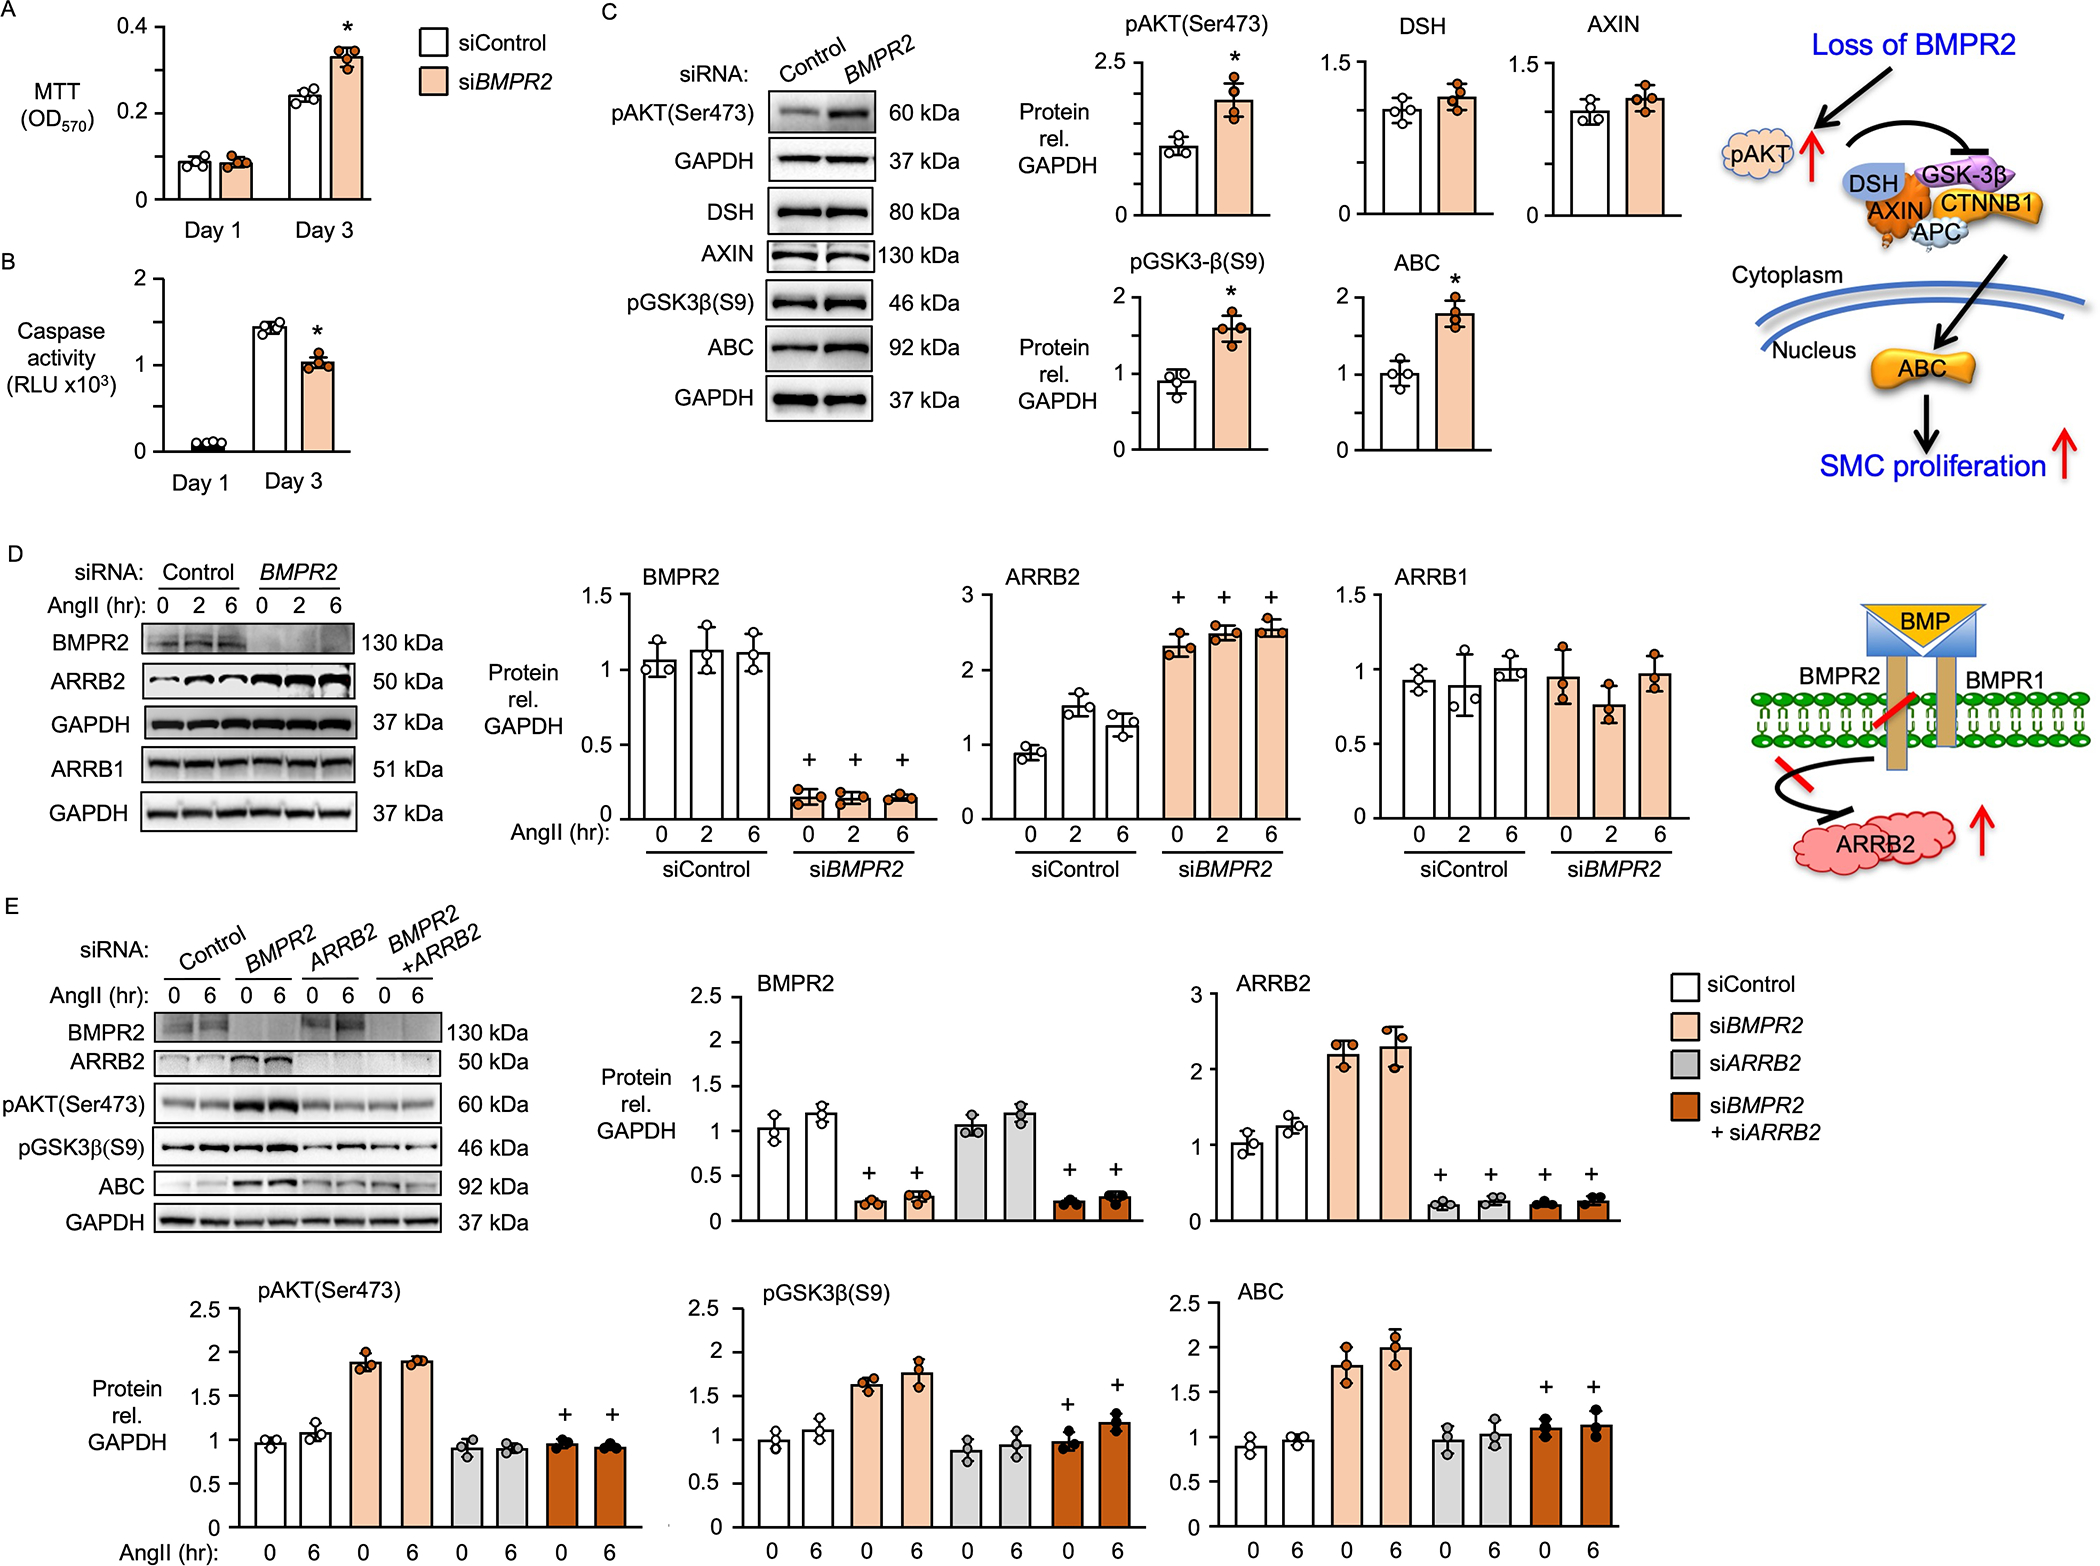
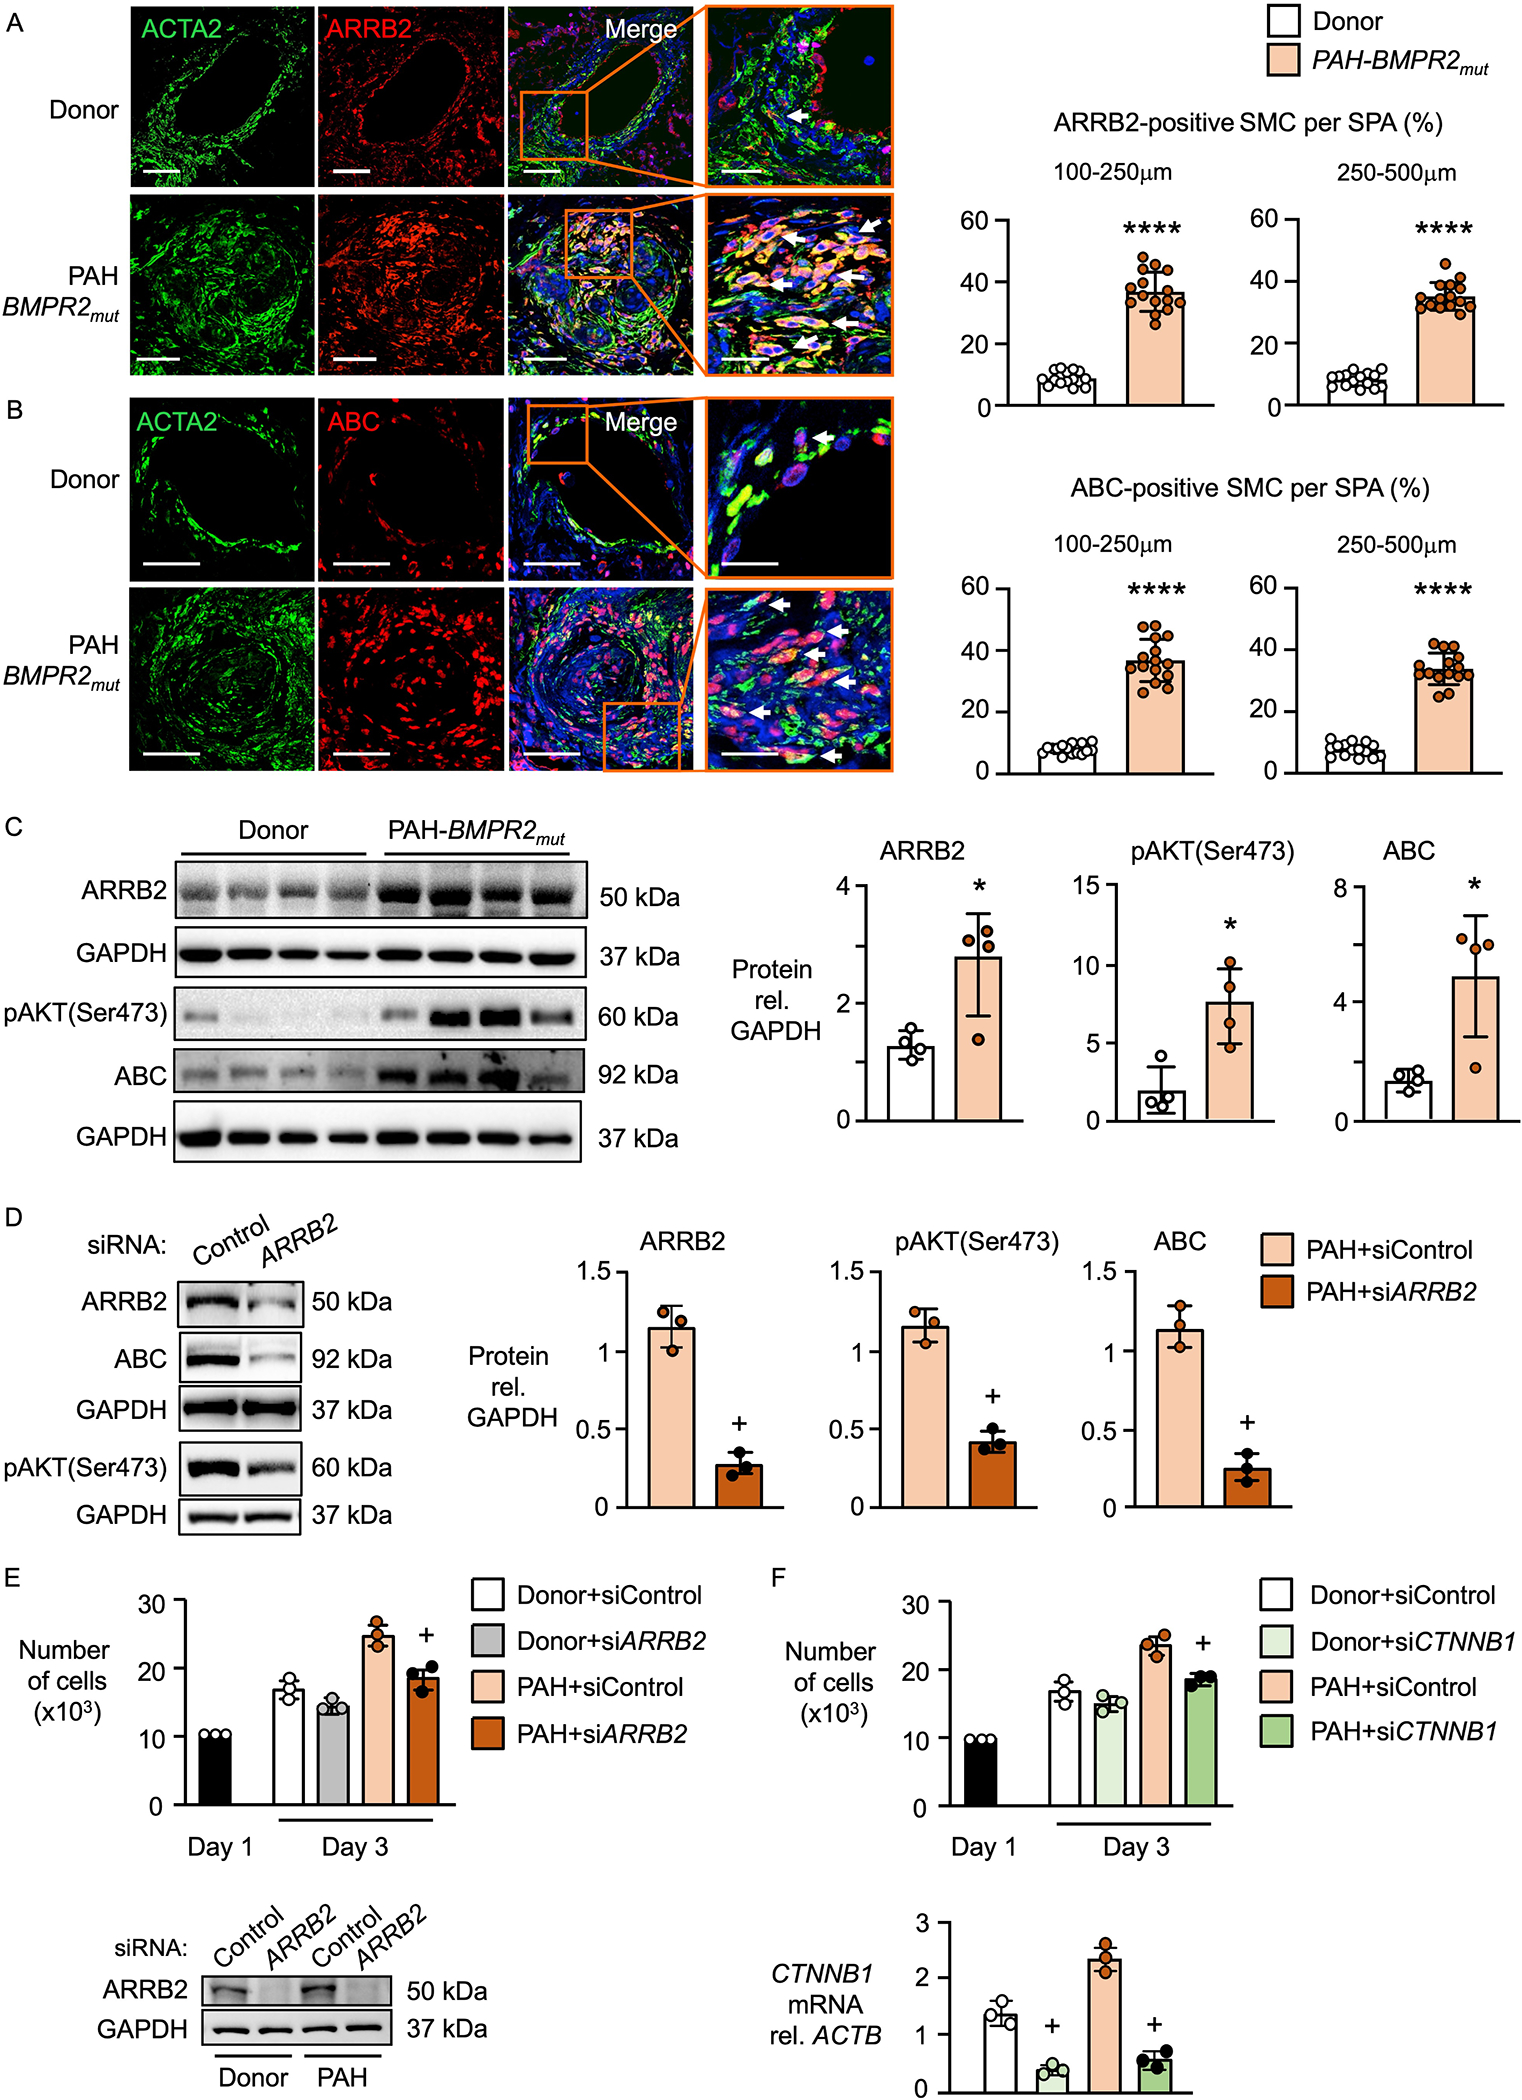
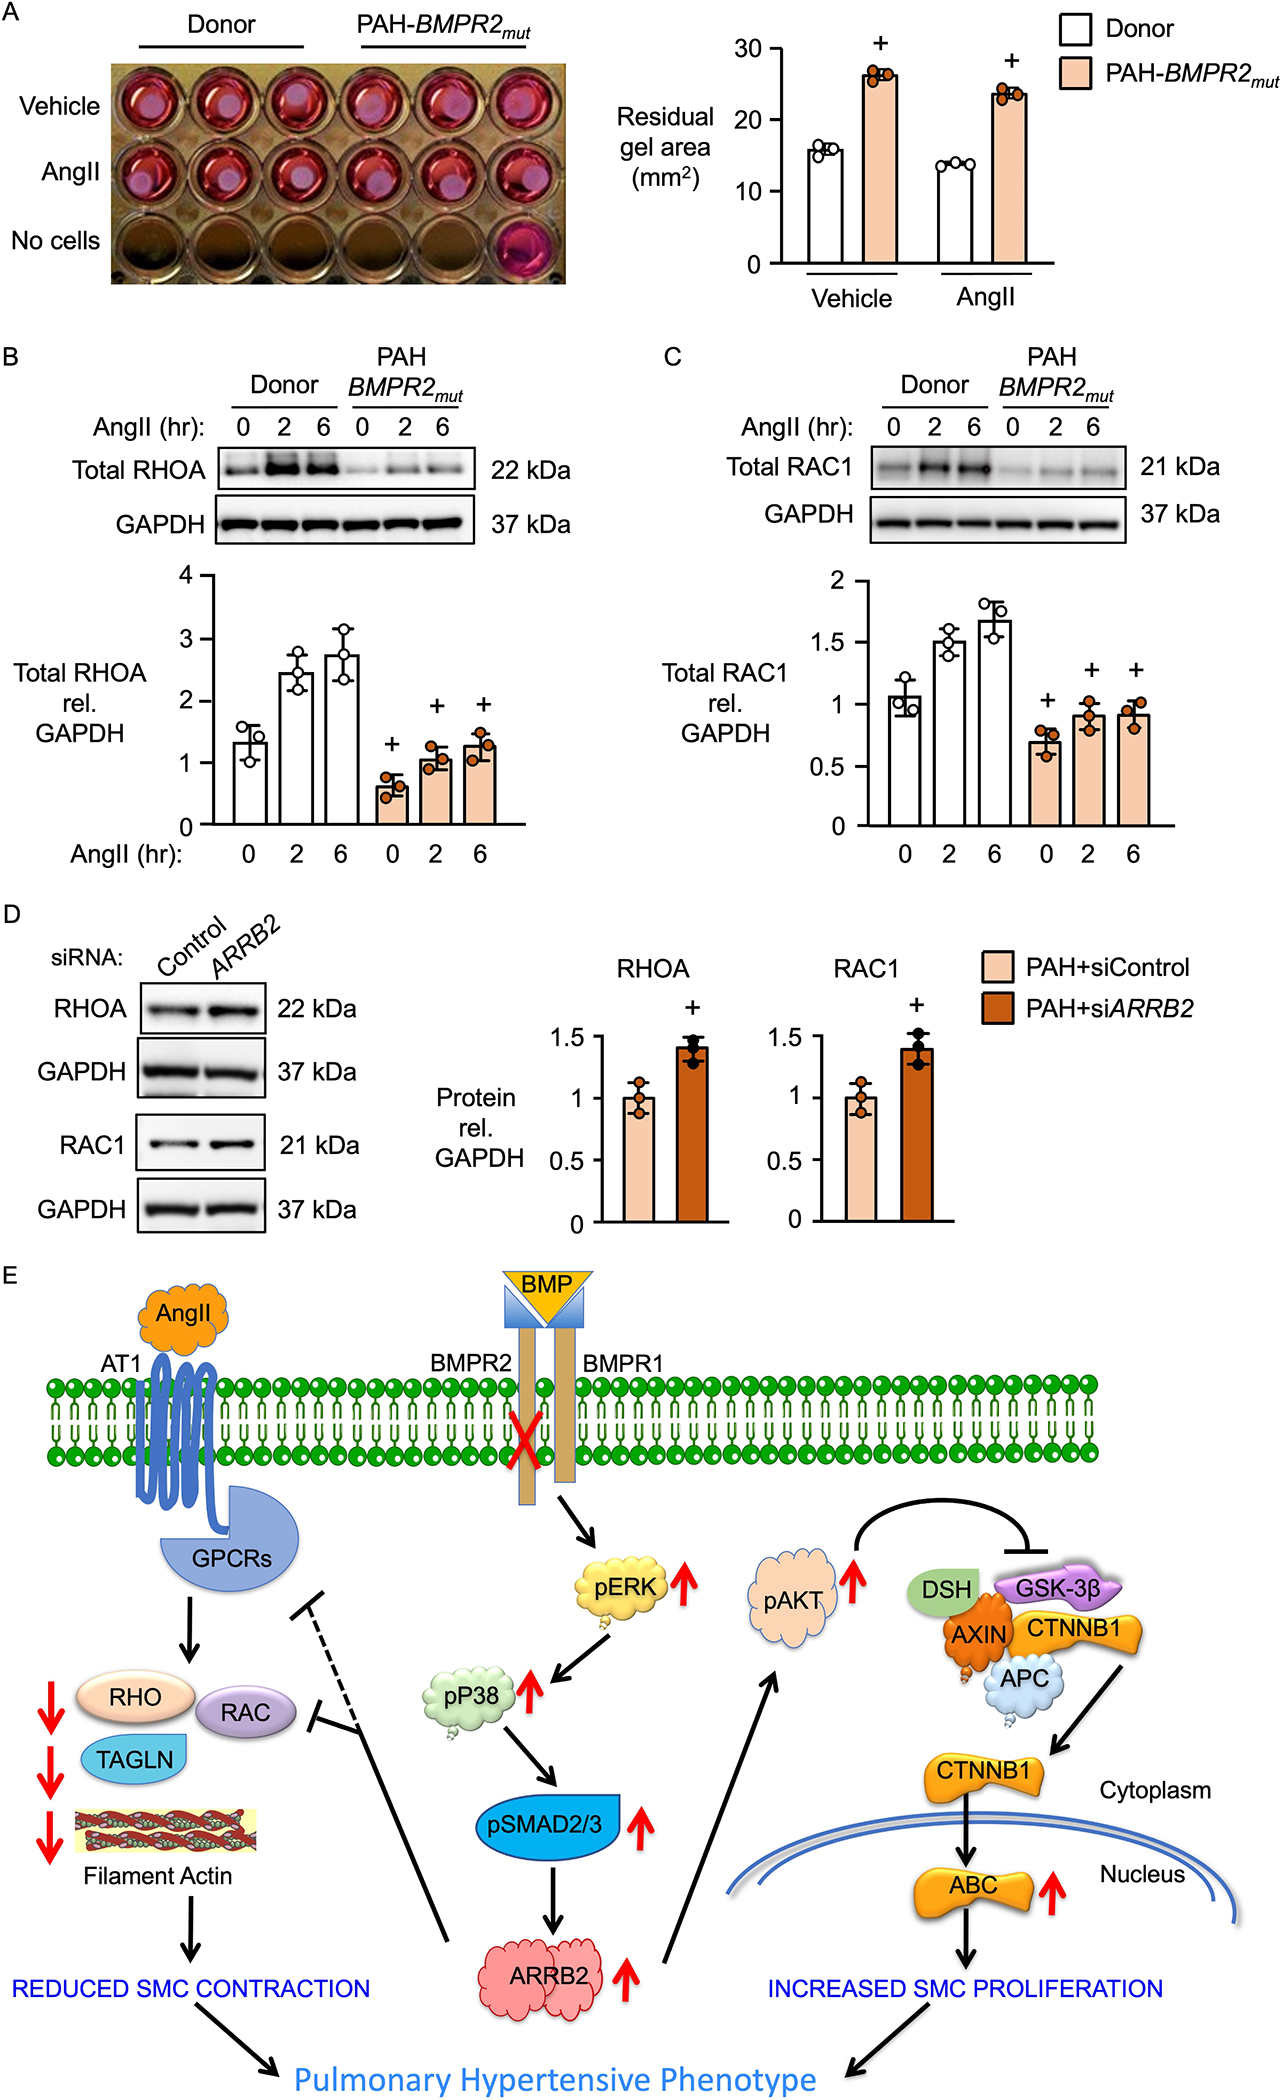
Results: BKOSMC mice showed reduced hypoxia-induced vasoconstriction and persistent pulmonary hypertension following recovery from hypoxia, associated with sustained muscularization of distal pulmonary arteries. PASMC from mutant compared to control mice displayed reduced contractility at baseline and in response to angiotensin II, increased proliferation and apoptosis resistance. Human PASMC with reduced BMPR2 by small interference RNA, and PASMC from PAH patients with a BMPR2 mutation showed a similar phenotype related to upregulation of pERK1/2 (phosphorylated extracellular signal related kinase 1/2)-pP38-pSMAD2/3 mediating elevation in ARRB2 (β-arrestin2), pAKT (phosphorylated protein kinase B) inactivation of GSK3-beta, CTNNB1 (β-catenin) nuclear translocation and reduction in RHOA (Ras homolog family member A) and RAC1 (Ras-related C3 botulinum toxin substrate 1). Decreasing ARRB2 in PASMC with reduced BMPR2 restored normal signaling, reversed impaired contractility and attenuated heightened proliferation and in mice with inducible loss of BMPR2 in SMC, decreasing ARRB2 prevented persistent pulmonary hypertension.

Conclusions: Agents that neutralize the elevated ARRB2 resulting from loss of BMPR2 in PASMC could prevent or reverse the aberrant hypocontractile and hyperproliferative phenotype of these cells in PAH.

Keywords: beta-arrestin 2; bone morphogenetic protein receptors, type II; pulmonary arterial hypertension; smooth muscle cells; transgenic mice.


Figures

Figure 1.
Figure 1.. Tagln-Cre/R26R/Bmpr2−/− (BKOSMC) mice exhibit reduced vasoreactivity and persistent pulmonary hypertension (PH) following recovery from chronic hypoxia.
BKOSMC and wild type (WT) littermate were exposed to chronic or acute hypoxia, and compared to mice housed under normoxia (room air). (A) Representative mouse left lung with LacZ staining in pulmonary arteries (scale bar: 3 mm) and H&E stained lung sections (7 μm thick, scale bar: 100 μm). (B) Pulmonary vascular reactivity: Continuous RVSP measurements were obtained in ventilated, anesthetized mice under the following sequence: 40% O2 for 5 minutes (baseline), followed by 10% O2 for 15 minutes (acute hypoxia), and 15 minutes in 40% O2 (baseline recovery). (C-F) Chronic hypoxia: Mice were exposed to three weeks of hypoxia (10% O2) followed by four weeks recovery in normoxia, or followed for seven weeks in normoxia. (C) Experimental design. (D) Right ventricular systolic pressure (RVSP). (E) Right ventricular (RV) hypertrophy, weight ratio of RV vs. LV+Septum. (F) Muscularity of distal arteries at alveolar wall and duct level (Images on the left are from the recovery groups, scale bar: 25 μm). Data represent mean±SEM, n=5–8 mice per group, *P<0.05, **P<0.01, ****P<0.0001 BKO vs. WT, under the same conditions; ##P<0.01, ###P<0.001, ####P<0.0001 vs. room air or baseline, same genotype; and $ $P<0.01, $ $ $P<0.001, $ $ $ $P<0.0001, recovery vs. hypoxia or acute hypoxia, same genotype. Analyses performed by unpaired two-way ANOVA, and adjusted for multiple comparisons using Tukey’s post hoc test in (A-E), and by non-parametric Kruskal-Wallis one-way ANOVA, adjusted for multiple comparisons using the Dunn’s post hoc test in (F).
Figure 2:
Figure 2:. Heightened proliferation and impaired contractility in Tagln-Cre/R26R/Bmpr2−/− (BKOSMC) PASMC related to elevated β-Catenin (CTNNB1) and decreased RHOA and RAC1.
Murine (m) PASMC were isolated from large PA of BKOSMC and littermate controls. Each data point is a biological replicate, representing mPASMC isolated by combining 2–3 PAs (see Methods). (A) Representative image of LacZ stained mPASMC in culture (Scale bar, 50 μm) with quantitative real time PCR of mPASMC on the right, attesting to the knockdown Bmpr2 in the mPASMC. (B) Proliferation, assessed by MTT assay in 96-well plates with 1,000 mPASMC seeded per well. (C) Survival, assessed by Caspase 3/7 Assay in 96-well plates with 20,000 mPASMC seeded per well following serum withdrawal. (D) Gel contractility assay of PASMC from BKOSMC vs. WT mice. mPASMC were evenly mixed with collagen gel and seeded on 48-well plates (3×10⁵ cells per 250 μL of gel per well). The embedded cells were treated with vehicle (0.1% BSA in PBS), BMP4 (10 ng/mL) or Angiotensin II (AngII, 4 μM) for 72 hours. The residual gel area was analyzed by ImageJ. Wells with the gel without embedded cells served as a negative control. (E) Representative immunoblot of CTNNB1 and active β-Catenin (ABC) in WT or BKOSMC mPASMC, with densitometric analysis relative to ACTB as loading control. (F) Proliferation assessed by cell counts. On day 1, 20,000 mPASMC were seeded per well in 6-well plates, comparing mPASMC from BKOSMC and WT mice where Ctnnb1 was reduced by siRNA, vs. treatment with non-targeting siRNA (siControl). Quantitative real time PCR below, attesting to the knock-down of Bmpr2 and Ctnnb1 in the mPASMC. (G) Representative immunoblot of total RHOA and RAC1 in mPASMC of BKOSMC vs. WT mice, with densitometric analysis relative to GAPDH as loading-control. (H) Representative immunoblot of active RHOA and RAC1 in mPASMC of BKOSMC vs. WT mice, at baseline (0 hour) and in response to AngII (4 μM) stimulation for 2 or 6 hours, with densitometric analysis relative to GAPDH as loading control. In (E, G and H), data were normalized to the lane on the left. Data represent mean±SEM. Data were analyzed by non-parametric Kolmogorov-Smirnov t-test. In (A, B, C, E, G), n=4 biological replicates; *P<0.05 vs. WT. In (D and H), n=3 biological replicates; + denotes comparisons vs. WT at the same time point or treatment condition, where the minimum achievable P-value for n=3 was reached by the non-parametric t-test. In (F), n=3 biological replicates; + denotes comparison of siCtnnb1 in the same genotype (cell number and Ctnnb1 mRNA), or confirms Bmpr2 knockdown.
Figure 3:
Figure 3:. Loss of BMPR2 in human PASMC increases proliferation and survival related to β-Arrestin 2 (ARRB2) dependent activation of pAKT and ABC.
Human PASMC isolated from small pulmonary arteries (PA) of unused donor lungs were cultured as described in Methods and transfected with siRNA targeting BMPR2 (siRMPR2) or non-targeting siRNA (siControl). (A) Proliferation, assessed by MTT assay in 96-well plates with 1,000 PASMCs seeded per well. (B) Survival, assessed by Caspase 3/7 Assay following serum withdrawal. On day 1, in 96-well plates, 20,000 PASMCs were seeded per well. (C) Representative immunoblots of pAKT(Ser473), DSH, AXIN, inactive pGSK3-β [pGSK3-β(S9)] and ABC in PASMC, with densitometric analysis, and schema of the signaling pathway on the right. (D) Representative immunoblot of BMPR2, ARRB2 and ARRB1 in PASMC in response to AngII (4 μM) stimulation for 2 or 6 hours, with densitometric analysis, and schema of the signaling pathway on the right. (E) BMPR2, ARRB2 or both genes were reduced in PASMC by siRNA, compared with siControl. BMPR2, ARRB2, pAKT(Ser473), pGSK3-β(S9), and ABC were analyzed by western blot following stimulation with AngII (4 μM) for 6 hours. In (C, D and E), Densitometric analysis relative to GAPDH as loading control, normalized to the lane on the left. Data represent mean±SEM. Data were analyzed by non-parametric Kolmogorov-Smirnov t-test. In (A-C) n=4 Donors; *P<0.05, vs. siControl under the same conditions. In (D, E), n=3; + denotes the minimum achievable P-value for n=3 was reached by the non-parametric t-test comparing siBMPR2 vs. siControl under the same conditions in (D), and siARRB2 in the same genotype at the same time point, or confirms reduced BMPR2 with siRNA in (E).
Figure 4:
Figure 4:. Loss of BMPR2 in human PASMC increases pERK, pP38 and pSMAD 2&3, associated with an increase in ARRB2 and ABC.
Human PASMC isolated from small PA of unused donor lungs were cultured as described in Methods and transfected with siRNA targeting BMPR2 (siRMPR2) or with non-targeting siRNA (siControl). (A) PASMC transfected with siRNA targeting BMPR2 (siRMPR2), SMAD2&3 (siSMAD2 and siSMAD3), or both, compared with non-targeting siRNA (siControl). Representative immunoblots of SMAD2&3, pP38(MAPK), ARRB2 and ABC in PASMC, with densitometric analysis. (B) and (C) siBMPR2 and siControl transfected PASMC were pretreated with (B) pP38(MAPK) inhibitor, SB203580 (10 μM) or with (C) pERK1/2 inhibitor, PD98059 (20 μM) for 1 hour prior to culture for 48 hours and compared with the vehicle groups. Representative immunoblots of pERK1/2, pP38(MAPK), pSMAD2&3, ARRB2, pAKT(Ser473) and ABC in PASMC, with densitometric analysis. On the right, experimental design and schema representing the pathway we propose based on this study. Data show protein relative to GAPDH as loading control, normalized to the lane on the left. Data represent mean±SEM of n=3 Donors. Data were analyzed by non-parametric Kolmogorov-Smirnov t-test. + denotes comparisons where the minimum achievable P-value for n=3 was reached, comparing the effect of siSMAD2&3 or inhibitor treatment in siControl or in siBMPR2.
Figure 5:
Figure 5:. Human PASMC with loss of BMPR2 show reduced contractility, related to reduced RHOA and RAC1, and ACTA2 fibers (F-ACTA2).
Human PASMC were isolated from small PA of unused donor lungs, cultured as described under ‘Methods’, and transfected with siRNA targeting BMPR2 (siRMPR2) or with non-targeting siRNA (siControl). (A) Gel contractility assay, as described for Figure 2D, following stimulation by Angiotensin II (AngII, 4 μM) or vehicle (PBS) for 72 hours. (B, C) PASMC were treated with AngII (4 μM) for 2 or 6 hours, compared with baseline (0 time). Representative immunoblot of BMPR2, total and active RHOA (in B), and BMPR2, total and active RAC1 (in C), with densitometric analysis relative to GAPDH as loading control, normalized to the lane on the left. (D) Confocal microscopic images of PASMC following AngII (4 μM) or vehicle (PBS) stimulation for 6 hours, showing filament actin fibers probed by Phalloidin conjugates (green) and nuclei stained by DAPI (blue). Average F-ACTA2 per cell (total F-ACTA2 pixels divided by the number of nuclei in each field) was determined using Fuji ImageJ. Scale bar, 30 μm (top and middle rows); 15 μm for zoomed in images, bottom row. Data represent mean±SEM. (A-C) n=3 Donors; + denotes comparisons vs. siControl under the same condition, where the minimum achievable P-value for n=3 was reached by non-parametric Kolmogorov-Smirnov t-test. (D) n=15 fields; ****P<0.0001 vs. siControl under the same condition, and ####P<0.05, comparing the same genotype across conditions, by one way ANOVA adjusted for multiple comparisons using Tukey’s post hoc test.
Figure 6:
Figure 6:. Reducing ARRB2 in PASMC with loss of BMPR2 restores normal levels of RHOA, RAC1 and contractility.
Human PASMC isolated from small pulmonary arteries of unused donor lungs were cultured as described under ‘Methods’, and transfected with siRNA targeting BMPR2 (siBMPR2), ARRB2 (siARRB2), or both, vs. non-targeting siRNA (siControl). (A) Representative immunoblot of total RHOA and RAC1 in PASMC in response to AngII (4 μM) stimulation for 6 hours or at baseline (time 0), with densitometric analysis relative to GAPDH as loading control, normalized to the lane on the left. (Reduction of BMPR2 and ARRB2 by siRNA in the same sample is shown in Figure 3E). (B) Gel contractility assay (representative image), as described in Figure 2D, in PASMC transfected with siBMPR2, siARRB2, or both, vs. siControl transfected cells, in response to AngII (4 μM) or vehicle (0.1% BSA in PBS) stimulation for 72 hours. Data represent mean±SEM of n=3 donors; + denotes comparisons where the minimum achievable P-value for n=3 was reached by non-parametric Kolmogorov-Smirnov t-test comparing the effect of siARRB2 in siControl or in siBMPR2 at the same time point or treatment condition.
Figure 7:
Figure 7:. Increased proliferation and survival in PASMC of PAH patients with BMPR2 mutation, related to activation of ARRB2-pAKT-ABC axis.
(A, B) Human lung tissue sections (7 μm thick) from PAH patients with a BMPR2 mutation (PAH- BMPR2mut), or from donor lungs (Donor), were probed with antibodies against ARRB2, ABC or ACTA2, and imaged by confocal microscopy. Terminal bronchiolus PA (SPA) at two levels, 100–250 μm and 250–500 μm were assessed from 3 Donors or PAH-mut patients and 5 random fields for each Donor or PAH patient. (A, B) Representative Immunofluorescent staining of ARRB2 or ABC (red), ACTA2 (green) and nuclei (DAPI, blue). Arrows in zoomed images on the right point to PASMC with abundant ARRB2 in the cytoplasm (in A) and ABC in the nucleus (in B). Scale bars, 50 μm in the three left columns, 20 μm, right column. (C-F) PASMC were isolated from SPA of PAH-BMPR2mut patients, or from unused donor lungs. (C) Representative immunoblot of ARRB2, pAKT(Ser473) and ABC in PASMC, with densitometric analysis relative to GAPDH as loading control. (D) PASMC from PAH-BMPR2mut patients were transfected with siRNA targeting ARRB2 (siARRB2) or with non-targeting siRNA (siControl), and ARRB2, pAKT(Ser473) and ABC evaluated by immunoblots. Representative blots are shown, with densitometric analysis relative to GAPDH as loading control. In (C, D), data was normalized to the lane on the left. (E) Proliferation, assessed by cell counts with 10,000 PASMCs seeded per well in 24-well plates at day 1, comparing PAH-BMPR2mut vs. Donor PASMC transfected with siARRB2 vs. siControl, and plated at the same initial density. Representative immunoblot below, attesting to the reduction of ARRB2 in the PASMC. (F) Proliferation, assessed by cell counts similar to (E), under the conditions of Figure 6E, comparing treatment by siCTNNB1 vs. siControl. Quantitative real time PCR below, attesting to the reduction of CTNNB1 in the PASMC. Data represent mean±SEM. (A and B) n=15 fields, **** P<0.0001 vs. Donor by parametric t-test with Welch’s correction. (C) n=4 PAH patients or donors; *P<0.05 vs. Donor PASMC by non-parametric Kolmogorov-Smirnov t-test. (D, E, F) n=3 PAH patients or Donors; + denotes comparisons where the minimum p value was achieved by the non-parametric test comparing siARRB2 vs. siControl in (D, E), or siCTNNB1 vs. siControl in (F), in the Donor or PAH patient PASMC.
Figure 8:
Figure 8:. PASMC from PAH-BMPR2mut patients show reduced contractility, related to reduced RHOA and RAC1. Reducing ARRB2 restores RHOA and RAC1.
PASMC were isolated from small PAs of PAH-BMPR2mut or from unused donor lungs as controls (Donor). (A) Gel contractility assay, as described for Figure 2D, following AngII (4 μM) or vehicle stimulation. Residual gel area (mm2) was analyzed by ImageJ. (B, C) Representative immunoblot of total RHOA (B) and total RAC1 (C), in response to AngII (4 μM) for 2 and 6 hours vs. time 0 (baseline), with densitometric analysis. (D) ARRB2 was reduced by siRNA targeting ARRB2 (siARRB2) vs. siControl in PASMC from PAH-BMPR2mut as shown in Figure 7D. Representative immunoblots of ARRB2, RHOA and RAC1, with densitometric analysis. In (B, C, D), densitometric analysis is shown relative to GAPDH as loading control, normalized to the lane on the left. Data represent mean±SEM of n=3 Donors or PAH patients; + denotes comparisons where the minimum achievable P-value for n=3 was reached by the non-parametric Kolmogorov-Smirnov t-test, comparing PAH-BMPR2mut vs. Donors under the same condition in (A-C), or siARRB2 vs. siControl in D. (E) Model: Schematic diagram summarizing the findings. Reduced BMPR2 in SMC leads to pERK-pP38-pSMAD2/3 dependent increase in ARRB2. The increase in ARRB2 results in pAKT-GSK3β mediated activation of CTNNB1, leading to increased proliferation. Increased ARRB2 leads to reduced RHOA and RAC1, and actin stress fibers, resulting in impaired contractility. The dashed line indicates association per published reports.
Figure 9:
Figure 9:. Reducing ARRB2 in Acta2-CreER/Td/Bmpr2−/− (iKOSMC) mice prevents development of pulmonary hypertension.
(A) Experimental design: Mice with tamoxifen-inducible Bmpr2 knock-out in SMC (iBKOSMC), or iBKOSMC mice with one Arrb2 allele deleted (Acta2-CreER/Td/Bmpr2−/−/Arrb2−/+; (iBKO-iAHetSMC), and controls (iWT) were exposed to chronic hypoxia as described in Figure 1C. (B) Representative Immunofluorescent staining of Td tomato (red), ACTA2 (green) and nuclei (DAPI, blue) from mouse lung sections (7 μm thick) obtained from iBKOSMC mice. The ACTA2-CreER is selectively knocking out Bmpr2 in SMC. No Td tomato expression in ECs (arrow). Scale bar: 25 μm; 5 μm in magnified panels. (C) Vasoreactivity assessment with Norepinephrine (NE): continuous RVSP measurement on iBKOSMC vs. iWT (females and males) at baseline and NE treatment (Tx) (IV 20 μg/30 g BW in 1 min). (D) Right ventricular systolic pressure (RVSP) and (E) Right ventricular (RV) hypertrophy, weight ratio of RV vs. left ventricle and septum (RV/LV+S) of mice housed in room air, chronic hypoxia, and following recovery in room air. (F) Muscularity of distal arteries at alveolar wall and duct level. Images are from the recovery group (7 μm thick; scale bar: 25 μm). (G) Large PA (LPA) isolated from the recovery cohorts, iWT, iBKOSMC and iBKO-iAHetSMC mice. Lysates were prepared after removal of the EC and adventitial fibroblast layers. Representative immunoblot of BMPR2, ARRB2, ABC, and RHOA, with GAPDH as loading control, confirming this regulatory pathway in the iBKOSMC and iBKO-iAHetSMC mice. Each lane represents combined LPA from four mice (n=4). (H) Representative Immunofluorescent staining of pAKT(Ser473) (red), ACTA2 (green) and nuclei (DAPI, blue) from mouse lung sections (7 μm thick) obtained from the recovery cohorts, iWT, iBKOSMC and iBKO-iAHetSMC (n=5 mice per group). Scale bars: 15μm; 4μm in magnified panels. Each point represents the average number of positive pAKT cells per SPA (15–40 μm) per field, from 3 random sections per mouse. Data represent mean±SEM. (C) n=6 or n=9 (iWT females) and n=8 (iWT males); *P<0.05 vs. iWT, under the same condition; ####P<0.0001, vs. baseline, same genotype and same gender. (D, E, F) n=8, 10 or 12 mice (normoxia, hypoxia and recovery, respectively); **P<0.01, ***P<0.001, ****P<0.0001 vs. iWT under the same conditions; #P<0.05, ##P<0.01, ###P<0.001, ####P<0.0001 vs. normoxia, same genotype; $P<0.05, $ $P<0.01, $ $ $ $P<0.0001 vs. iBKO under the same conditions; ††P<0.01, †††P<0.001, ††††P<0.001 vs. Hypoxia, same genotype. (C-F) Analyses performed by two-way ANOVA and Tukey’s multiple comparisons test. (H) n=15 fields; ****<0.0001 vs. iWT, ####P<0.0001, vs. iBKOSMC under same condition, by one-way ANOVA with adjustment for multiple comparisons using Tukey’s post hoc test.

References

    1. Rabinovitch M Molecular pathogenesis of pulmonary arterial hypertension. J Clin Invest. 2012;122:4306–4313. doi: 60658 [pii] 10.1172/JCI60658 - DOI - PMC - PubMed
    1. Lane KB, Machado RD, Pauciulo MW, Thomson JR, Phillips JA 3rd, Loyd JE, Nichols WC, Trembath RC. Heterozygous germline mutations in BMPR2, encoding a TGF-beta receptor, cause familial primary pulmonary hypertension. Nat Genet. 2000;26:81–84. doi: 10.1038/79226 - DOI - PubMed
    1. Deng Z, Haghighi F, Helleby L, Vanterpool K, Horn EM, Barst RJ, Hodge SE, Morse JH, Knowles JA. Fine mapping of PPH1, a gene for familial primary pulmonary hypertension, to a 3-cM region on chromosome 2q33. Am J Respir Crit Care Med. 2000;161:1055–1059. - PubMed
    1. Soubrier F, Chung WK, Machado R, Grunig E, Aldred M, Geraci M, Loyd JE, Elliott CG, Trembath RC, Newman JH, et al. Genetics and genomics of pulmonary arterial hypertension. J Am Coll Cardiol. 2013;62:D13–21. doi: 10.1016/j.jacc.2013.10.035 - DOI - PubMed
    1. Atkinson C, Stewart S, Upton PD, Machado R, Thomson JR, Trembath RC, Morrell NW. Primary pulmonary hypertension is associated with reduced pulmonary vascular expression of type II bone morphogenetic protein receptor. Circulation. 2002;105:1672–1678. - PubMed

Publication types

MeSH terms