. 2022 Dec 1;72(6):364-375.
doi: 10.30802/AALAS-CM-22-000033.

Comparing Variability in Measurement of Subcutaneous Tumors in Mice Using 3D Thermal Imaging and Calipers

Affiliations

Comparing Variability in Measurement of Subcutaneous Tumors in Mice Using 3D Thermal Imaging and Calipers

Daniel W Brough et al. Comp Med. .

Abstract

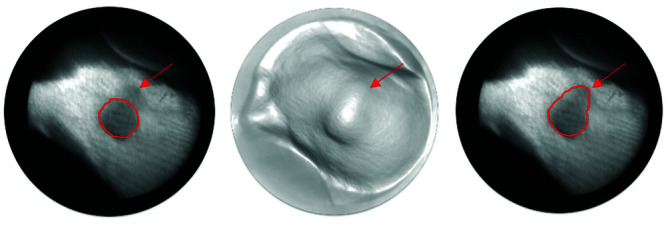
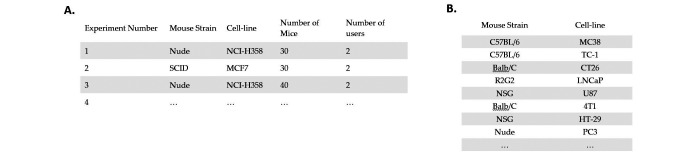
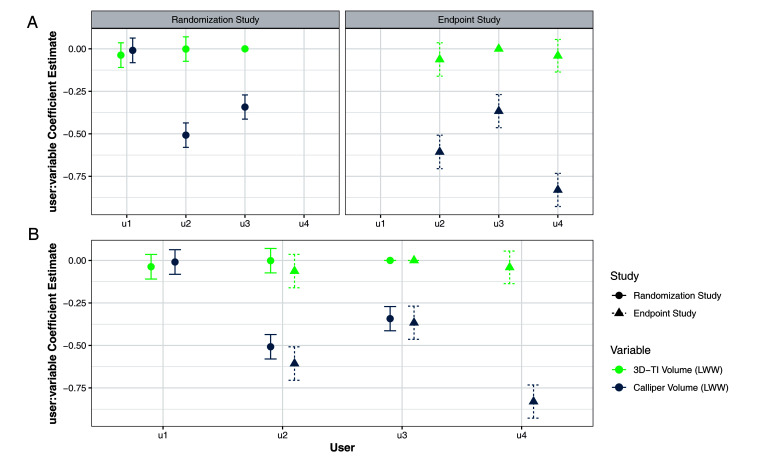
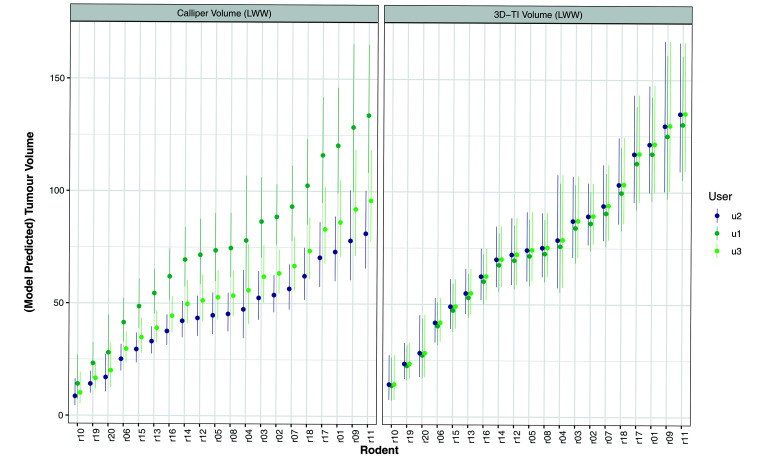
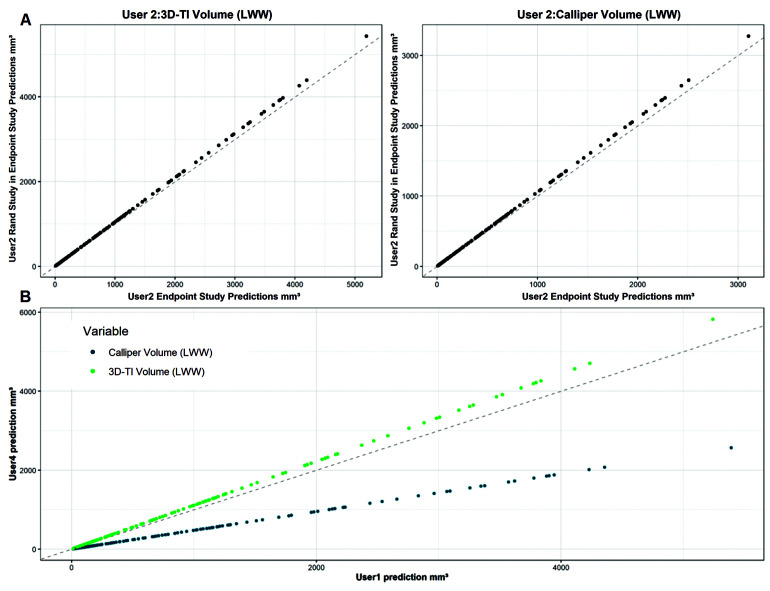
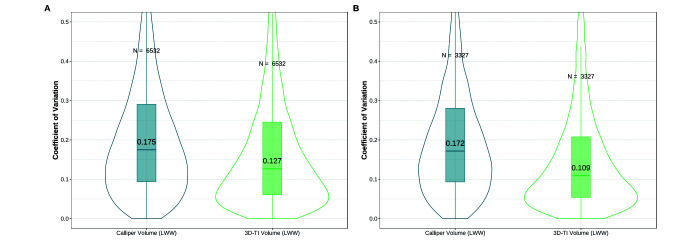
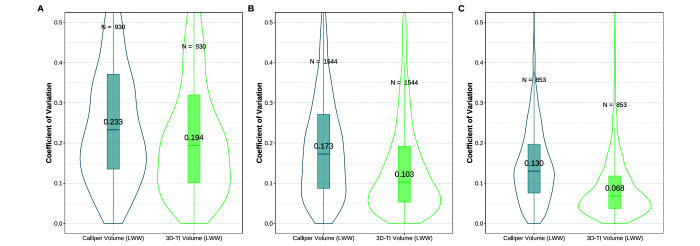
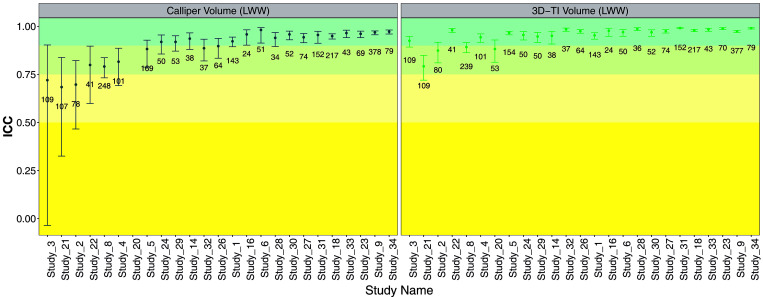
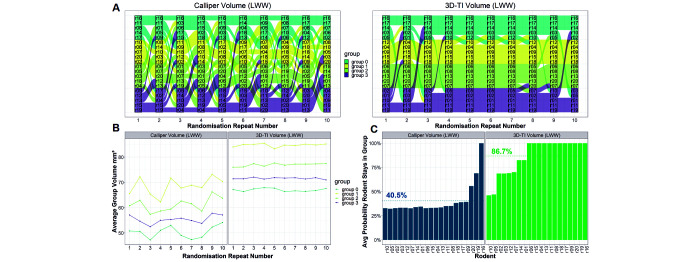
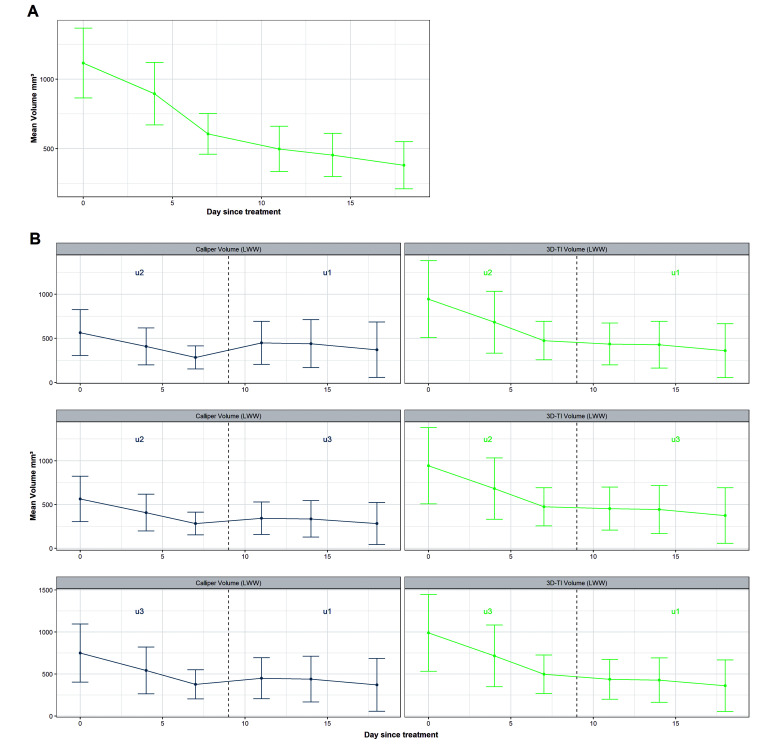
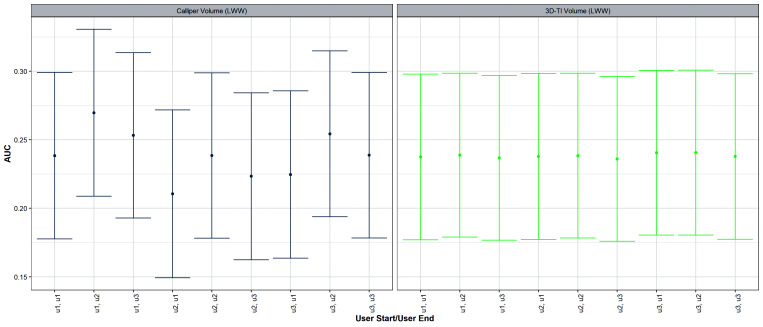
Repeatable tumor measurements are key to accurately assessing tumor growth and treatment efficacy. A preliminary study that we conducted showed that a novel 3D and thermal imaging system (3D-TI) for measuring subcutaneous tumors in rodents significantly reduced interoperator variability across 3 in vivo efficacy studies. Here we further studied this reduction in interoperator variability across a much larger dataset. A dataset consisting of 6,532 paired 3D-TI and caliper interoperator measurements was obtained from tumor scans and measurements in 27 laboratories across 289 studies, 153 operators, over 20 mouse strains, and 100 cell lines. Interoperator variability in both measurement methods was analyzed using coefficient of variation (CV), intraclass correlation (ICC) analysis, and significance testing. The median 3D-TI CV was significantly lower than the median caliper CV. The effects of large interoperator variability at critical points in the study were also investigated. At stratified randomization, changing the operator performing caliper measurements resulted in a 59% probability that a mouse would be reassigned to a different group. The probability that this would occur when using 3D-TI was significantly lower at 29%. In studies in which a tumor was expected to regress, changing the operator during the study was associated with a tumor volume increase of approximately 500mm³ when using calipers. This change did not occur when using 3D-TI. We conclude that 3D-TI significantly reduces interoperator variability as compared with calipers and can improve reproducibility of in vivo studies across a wide range of mouse strains and cell lines.


Figures

Figure 1.
Figure 1.
The shape of this circular tumor can be identified by its dark thermal signature (left, right), and by the shape of the generated 3D model (center). Segmentations are shown as a red boundary. In this case, automatic segmentation (left) underestimated tumor size and missed out a section indicated by the red arrow. The manual correction is shown on the right image.
Figure 2.
Figure 2.
A) Typical study designs when testing the interoperator variability in a total of 289 studies. B) Typical mouse strain and cell-line combinations scanned using BioVolume.
Figure 3.
Figure 3.
Four diagnostic residual plots for each to determine if residuals are normally distributed, A–D) contain the diagnostic plots for the model fit to Randomization study data. E–H) contain the plots for the model fit to Endpoint study data. A and E are quantile residuals plotted against the generated volume. B and F are quantile residuals plotted against the index of the data (no order in value). C and G are density plots of the residuals. D and H are normal Q-Q plots of the residuals.
Figure 4.
Figure 4.
Comparison of actual volume measurements against volumes generated from the model fit to: A) the Randomization study data used in the randomization analysis and B) the Endpoint study data used in endpoint analysis. A y = x line is plotted to assist in determining accuracy of predicted volumes.
Figure 5.
Figure 5.
User: Variable coefficient estimates from the 2 models. Taken from the 2 models fit to the randomization study and the endpoint study respectively. Error bars are 95% CI. Both models were fit using 3D-TI user 3 as a reference. A) User:Variable coefficient estimates shown separately. B) Coefficient estimates from both models in a single plot.
Figure 6.
Figure 6.
Comparison of user measurements of the same tumor (generated from the model fit to the randomization study) for calipers (left) and 3D-TI (right) at the time of randomization. Volumes were generated on day = 4 of the study, error bars are 95% CI.
Figure 7.
Figure 7.
A) Model predictions when changing user 2’s User:Variable coefficient estimates for the same user across the 2 models (studies) for 3D-TI (left) and calipers (right). User 2’s User:Variable coefficient from the randomization study model was used in place of User 2 in the endpoint study model. This was then used to generate measurements and compare against generated measures from User 2 from the endpoint study model original coefficient estimate. B) Comparing measured volumes (generated from model) for User 1 and User 4 as if they had both measured for the endpoint study. User 1’s User:Variable coefficient estimates for both 3D-TI and calipers were placed in the endpoint study model. Volumes could then be generated as if user 1 had measured in the endpoint study. The dotted line represents equality of the 2 users’ generated volumes (y = x).
Figure 8.
Figure 8.
A) Paired coefficient of variation using all comparable data for calipers (left) and 3D-TI (right). Different operator measurements of the same tumor on the same day were compared with analyses the interoperator variability. A total of 6,532 repeat measurements were each carried out by 2 or more operators. A boxplot shows the interquartile range, with the median labeled on the plot. A violin plot was also added to further outline the distribution of the data. A paired Wilcoxon test was used and yielded a P value of < 0.00001, with a test statistic of 1748301. B) Paired coefficient of variation using only evaluation study data for calipers (left) and 3D-TI (right). A total of 3,327 repeat measurements were performed by 2 or more operators. A paired Wilcoxon test yielded a P value of < 0.00001, with a test statistic of 8063847.
Figure 9.
Figure 9.
A) Paired coefficient of variation for tumors < 200 mm3 using evaluation study data for calipers (left) and 3D-TI (right). Different operator’s measurements of the same tumor on the same day are compared to analyze the interoperator variability. A total of 931 repeat measurements were performed by 2 or more operators. A boxplot shows the interquartile range, with the median labeled on the plot. A violin plot was also added to further outline the distribution of the data. B) Paired coefficient of variation for tumors greater than 200 mm3 but less than 1,000 mm3 using evaluation study data for calipers (left) and 3D-TI (right). There were 1,545 repeat measurements observed, each carried out by 2 or more operators. C) Paired coefficient of variation for tumors > 1,000 mm3using evaluation study data for calipers (left) and 3D-TI (right). A total of 853 repeat measurements were performed by 2 or more operators. A paired Wilcoxon test was performed for each case and always yielded a P value of < 0.00001.
Figure 10.
Figure 10.
Intraclass Correlation Coefficient (ICC) for 25 evaluation studies with a sufficient number of interoperator repeats for calipers (left) and 3D-TI (right). The number of different operators varies between 2 and 5 for different studies; the number of interoperator repeats is shown on the plot. The ICC shows that 3D-TI has a consistently high level of operator concurrence, which is not the case for calipers. An F-test was used for each study and showed that 3D-TI significantly reduced the inter-operator variability compared to calipers in 20 out of 24 studies (P < 0.05).
Figure 11.
Figure 11.
A) Group composition after repeating the randomization process in the same study 10 times each for calipers (left) and 3D-TI (right). For each randomization repeat, one of the 3 user measurements (generated from the model) was randomly selected for each mouse, the mice were then ordered in descending order of tumor volume and then assigned to groups. A straight line between groups denotes no change in group for a mouse after repeating a randomization. B) Variability of group means for the 10 randomization repeats for calipers (left) and 3D-TI (right). After each randomization repeat, the average group volume was computed for each group. C) Probability a mouse will remain in the same group after repeating a randomization for calipers (left) and 3D-TI (right) for 10 randomization repeats. This entire process was repeated 10,000 times (10 randomization repeats, 10,000 times) to generate a stable mean probability. Average probabilities by measurement device are shown with a dotted line and annotation.
Figure 12.
Figure 12.
A) Average tumor volume across the three 3D-TI users plotted from the Endpoint Study data. Mice were treated with an effective drug on day = 0, tumor regression is shown. Error bars are 95% CI, n = 15 for each time point. B) Volume regression when changing users during a study as measured by calipers (left) and 3D-TI (right). Mice were treated with an effective drug on day 0. User measurements were generated using a generalized linear model fit to interoperator variability study data and users were changed on day 9. Error bars are 95% CI, n = 15 for each time point.
Figure 13.
Figure 13.
Effect on AUC of changing users during the study for both 3D-TI (left) and calipers (right). AUC was computed using user measurements generated from a generalized linear model fit to interoperator variability study data. For the AUC calculation, the first user’s generated measurements were used until day 9, and the second user’s generated measurements were used from day 9 to 15. Bootstrapping was used to generate 95% CI.

Comment in

  • Letter to the Editor.
    Murkin J, Faustino-Rocha AI, Oliveira PA. Murkin J, et al. Comp Med. 2023 Apr 1;73(2):107. Comp Med. 2023. PMID: 37170457 Free PMC article. No abstract available.

Similar articles

Cited by

References

    1. Ayers GD, McKinley ET, Zhao P, Fritz JM, Metry RE, Deal BC, Adlerz KM, Coffey RJ, Manning HC. 2010. Volume of preclinical xenograft tumors is more accurately assessed by ultrasound imaging than manual caliper measurements. J Ultrasound Med 29:891–901. 10.7863/jum.2010.29.6.891. - DOI - PMC - PubMed
    1. Begley CG, Ellis LM. 2012. Raise standards for preclinical cancer research. Nature 483:531–533. 10.1038/483531a. - DOI - PubMed
    1. Caysa H, Metz H, Mäder K, Mueller T. 2011. Application of Benchtop-magnetic resonance imaging in a nude mouse tumor model. J Exp Clin Cancer Res 30:69. 10.1186/1756-9966-30-69. - DOI - PMC - PubMed
    1. Defensor EB, Lim MA, Schaevitz LR. 2021. Biomonitoring and digital data technology as an opportunity for enhancing animal study translation. ILAR J 62:223–231. 10.1093/ilar/ilab018. - DOI - PubMed
    1. Delgado-SanMartin J, Ehrhardt B, Paczkowski M, Hackett S, Smith A, Waraich W, Klatzow J, Zabair A, Chabokdast A, Rubio-Navarro L, Rahi A, Wilson Z. 2019. An innovative non-invasive technique for subcutaneous tumour measurements. PLoS One 14:e0216690. 10.1371/journal.pone.0216690. - DOI - PMC - PubMed