

Mechanistic models to meet the challenge of climate change in plant-pathogen systems
- PMID: 36744564
- PMCID: PMC9900714
- DOI: 10.1098/rstb.2022.0017
Mechanistic models to meet the challenge of climate change in plant-pathogen systems
Abstract
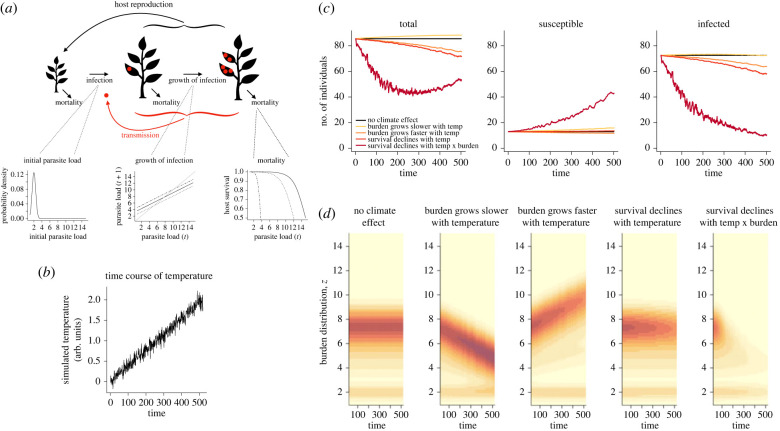
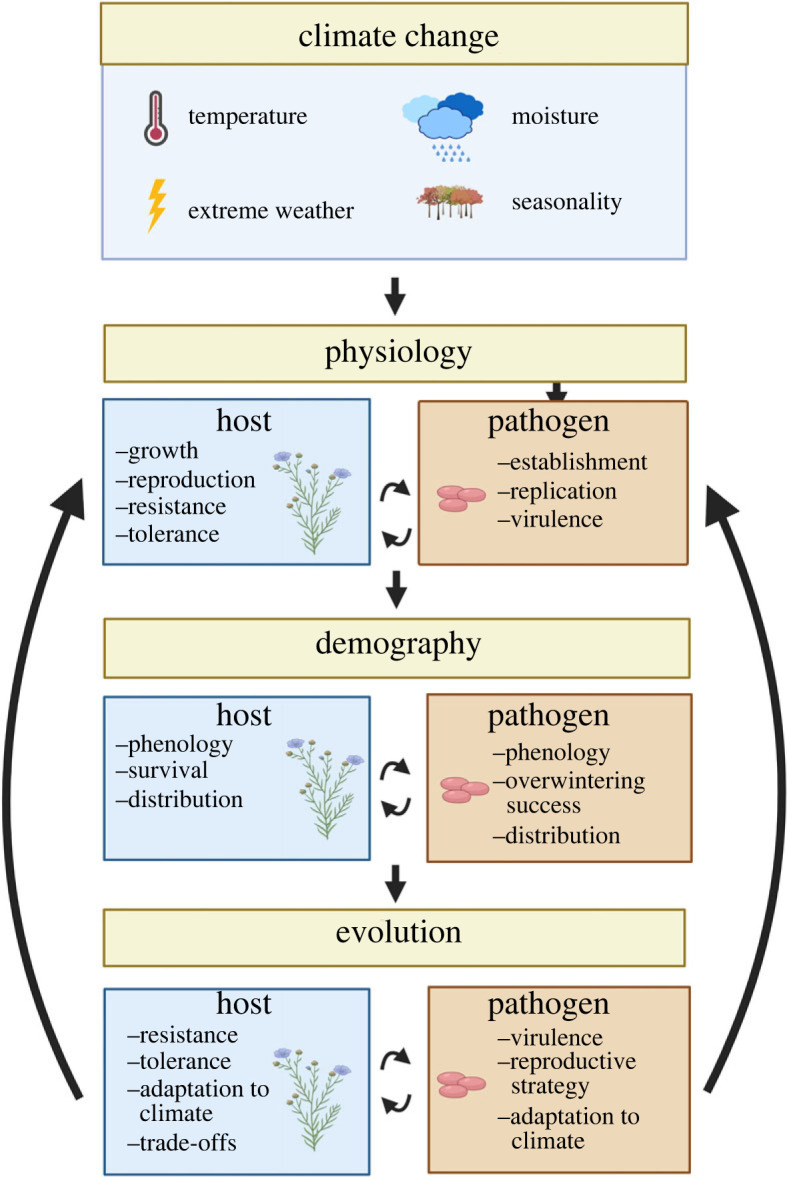
Evidence that climate change will impact the ecology and evolution of individual plant species is growing. However, little, as yet, is known about how climate change will affect interactions between plants and their pathogens. Climate drivers could affect the physiology, and thus demography, and ultimately evolutionary processes affecting both plant hosts and their pathogens. Because the impacts of climate drivers may operate in different directions at different scales of infection, and, furthermore, may be nonlinear, abstracting across these processes may mis-specify outcomes. Here, we use mechanistic models of plant-pathogen interactions to illustrate how counterintuitive outcomes are possible, and we introduce how such framing may contribute to understanding climate effects on plant-pathogen systems. We discuss the evidence-base derived from wild and agricultural plant-pathogen systems that could inform such models, specifically in the direction of estimates of physiological, demographic and evolutionary responses to climate change. We conclude by providing an overview of knowledge gaps and directions for future research in this important area. This article is part of the theme issue 'Infectious disease ecology and evolution in a changing world'.
Keywords: climate change; mechanistic model; plant pathogen.
Figures
Similar articles
-
Predicting the effects of climate change on the cross-scale epidemiological dynamics of a fungal plant pathogen.Sci Rep. 2022 Sep 1;12(1):14823. doi: 10.1038/s41598-022-18851-z. Sci Rep. 2022. PMID: 36050344 Free PMC article.
-
Plant-microbiome interactions under a changing world: responses, consequences and perspectives.New Phytol. 2022 Jun;234(6):1951-1959. doi: 10.1111/nph.18016. Epub 2022 Feb 25. New Phytol. 2022. PMID: 35118660 Review.
-
The effect of host community functional traits on plant disease risk varies along an elevational gradient.Elife. 2021 May 13;10:e67340. doi: 10.7554/eLife.67340. Elife. 2021. PMID: 33983120 Free PMC article.
-
Interactive effects of rising temperatures and urbanisation on birds across different climate zones: A mechanistic perspective.Glob Chang Biol. 2023 May;29(9):2399-2420. doi: 10.1111/gcb.16645. Epub 2023 Mar 13. Glob Chang Biol. 2023. PMID: 36911976 Free PMC article. Review.
-
Climate change and disease in plant communities.PLoS Biol. 2020 Nov 24;18(11):e3000949. doi: 10.1371/journal.pbio.3000949. eCollection 2020 Nov. PLoS Biol. 2020. PMID: 33232314 Free PMC article.
Cited by
-
Infectious disease ecology and evolution in a changing world.Philos Trans R Soc Lond B Biol Sci. 2023 Mar 27;378(1873):20220002. doi: 10.1098/rstb.2022.0002. Epub 2023 Feb 6. Philos Trans R Soc Lond B Biol Sci. 2023. PMID: 36744560 Free PMC article. No abstract available.
-
Comparative Analysis of Secondary Metabolites in Diplodia corticola Strains with Different Virulence Degrees Associated with Canker and Dieback of Quercus spp.Molecules. 2023 Aug 28;28(17):6302. doi: 10.3390/molecules28176302. Molecules. 2023. PMID: 37687130 Free PMC article.
-
Impacts of Weather Anomalies and Climate on Plant Disease.Ecol Lett. 2025 Jan;28(1):e70062. doi: 10.1111/ele.70062. Ecol Lett. 2025. PMID: 39831741 Review.
-
Quantitative Resistance Deployment Can Strengthen Epidemics in Perennial Plants by Selecting Maladapted Pathogen Strains.Evol Appl. 2025 Jul 9;18(7):e70123. doi: 10.1111/eva.70123. eCollection 2025 Jul. Evol Appl. 2025. PMID: 40642029 Free PMC article.
-
Shifts in geographic vulnerability of US corn crops under different climate change scenarios: corn flea beetle (Chaetocnema pulicaria) and Stewart's Wilt (Pantoea stewartii) bacterium.Environ Entomol. 2024 Dec 16;53(6):1102-1110. doi: 10.1093/ee/nvae099. Environ Entomol. 2024. PMID: 39436735 Free PMC article.
References
-
- Mordecai EA. 2011. Pathogen impacts on plant communities: unifying theory, concepts, and empirical work. Ecol. Monogr. 81, 429-441. (10.1890/10-2241.1) - DOI
-
- Janzen DH. 1970. Herbivores and the number of tree species in tropical forests. Am. Nat. 104, 501-528. (10.1086/282687) - DOI
-
- Woods FW, Shanks RE. 1959. Natural replacement of chestnut by other species in the Great Smoky Mountains National Park. Ecology 40, 349-361. (10.2307/1929751) - DOI
Publication types
MeSH terms
Associated data
LinkOut - more resources
Full Text Sources
Medical
