Review
. 2023 Mar 1;34(3):337-354.
doi: 10.1021/jasms.2c00290. Epub 2023 Feb 6.

Surface or Internal Hydration - Does It Really Matter?

Affiliations
Review

Surface or Internal Hydration - Does It Really Matter?

Christian van der Linde et al. J Am Soc Mass Spectrom. .

Abstract

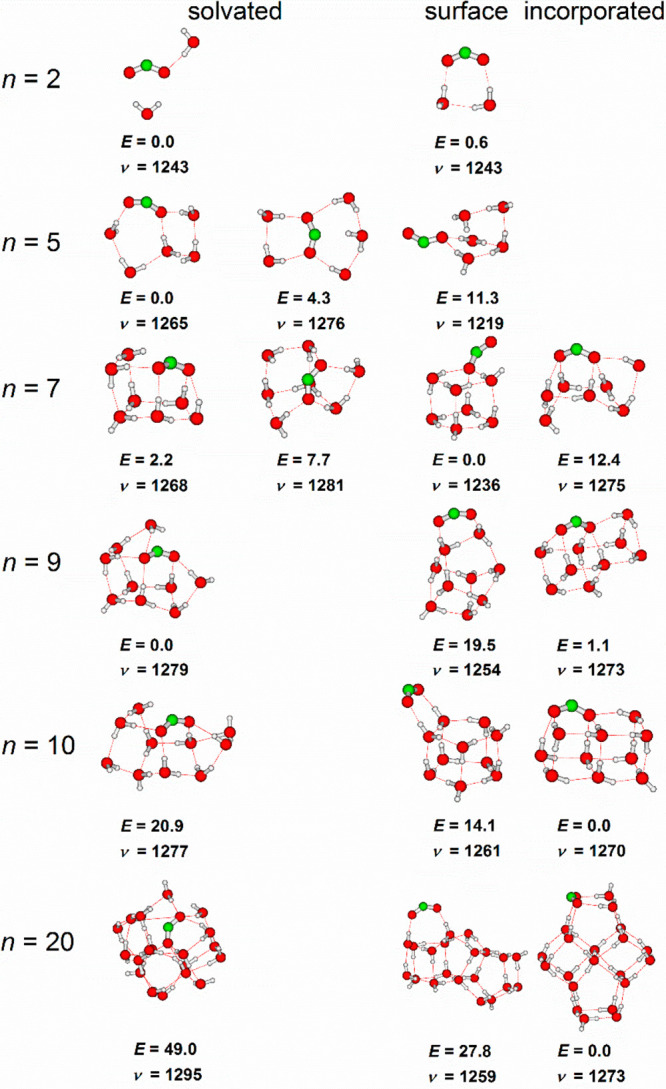
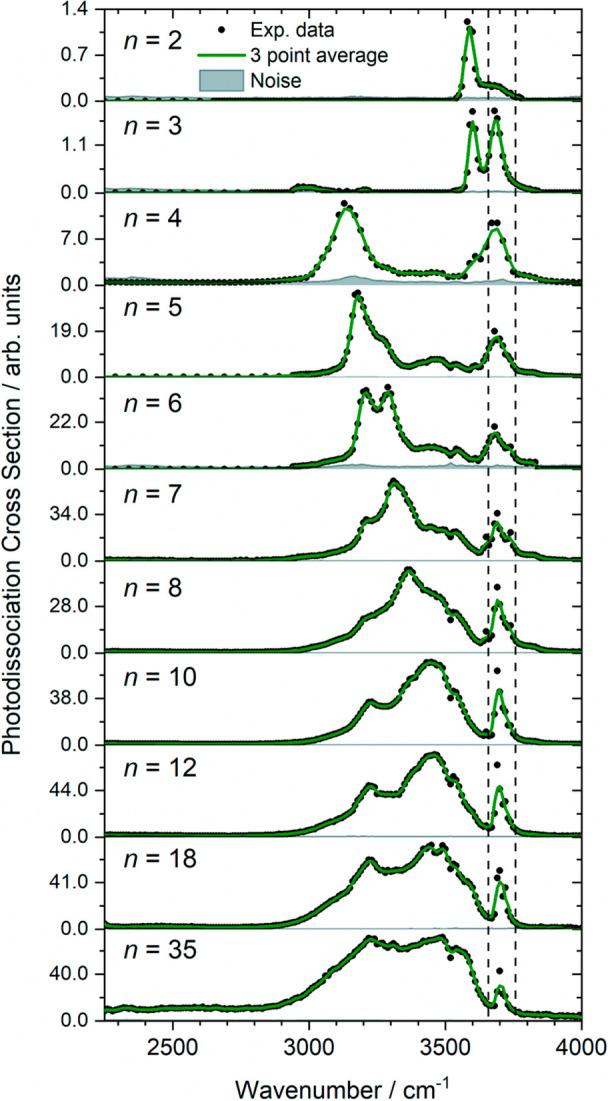
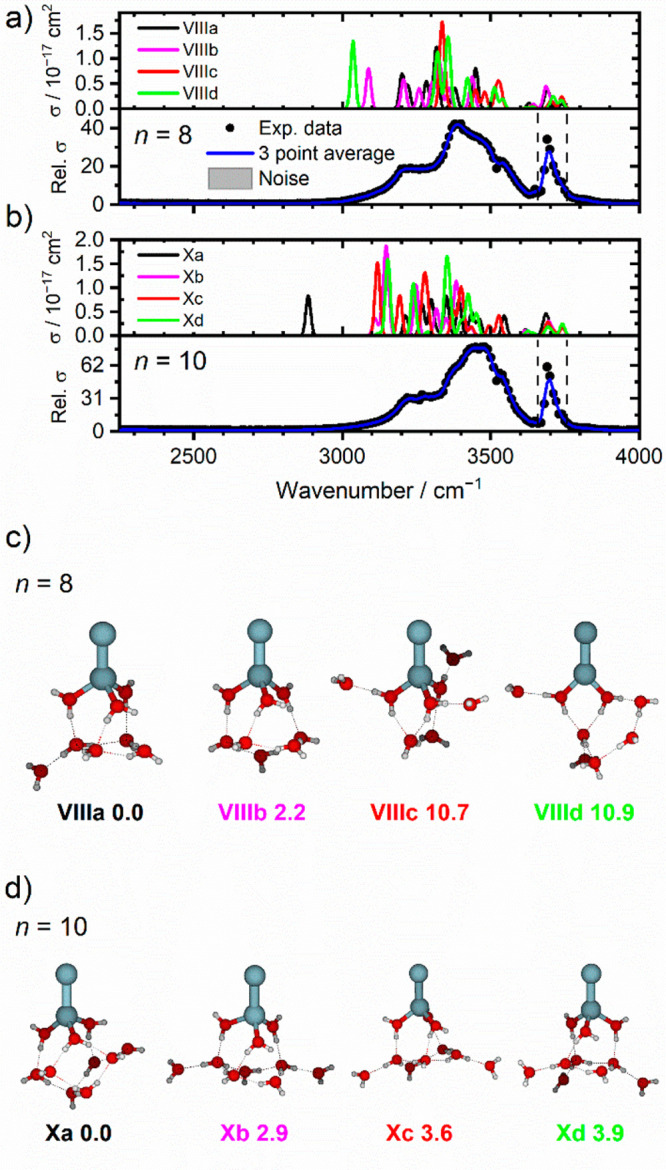
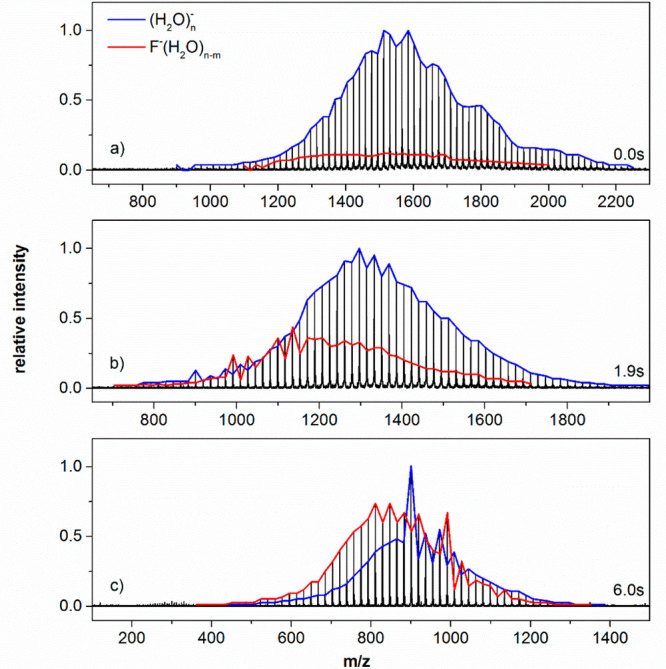
The precise location of an ion or electron, whether it is internally solvated or residing on the surface of a water cluster, remains an intriguing question. Subtle differences in the hydrogen bonding network may lead to a preference for one or the other. Here we discuss spectroscopic probes of the structure of gas-phase hydrated ions in combination with quantum chemistry, as well as H/D exchange as a means of structure elucidation. With the help of nanocalorimetry, we look for thermochemical signatures of surface vs internal solvation. Examples of strongly size-dependent reactivity are reviewed which illustrate the influence of surface vs internal solvation on unimolecular rearrangements of the cluster, as well as on the rate and product distribution of ion-molecule reactions.


Conflict of interest statement

The authors declare no competing financial interest.

Figures

Figure 1
Figure 1
Four isomers of hydrated electron in (H2O)40 along with an isosurface comprising 70% of the electron density: (a) a dipole-bound surface isomer, (b) a surface-bound isomer, (c) a partially embedded surface isomer, and (d) a cavity isomer. Oxygen atoms are red, hydrogen atoms white. Reproduced with permission from ref (54). Copyright 2011 American Chemical Society.
Figure 2
Figure 2
Absorption spectra of (H2O)n at a temperature of 80 K; the bulk spectrum of the hydrated electron at 333 K is taken from ref (57). Reproduced with permission from ref (55) under Creative Commons Attribution (CC-BY) license. Copyright 2019 The Authors.
Figure 3
Figure 3
(A) Absorption maxima of isomers I and II shown in Figure 2 compared with previous data for clusters and hydrated electron. (B) Gyration radius of the electron for isomers from (A) along with calculations for partially embedded electron. (C) Internal conversion (IC) lifetime in the hydrated electron for (H2O)n clusters and bulk. Reproduced with permission from ref (55) under Creative Commons Attribution (CC-BY) license. Copyright 2019 The Authors.
Figure 4
Figure 4
(a) Evolution of experimental band position and peak width indicated by error bars of the symmetric stretch νs with cluster size n for CO2(H2O)n. The position of νs in bulk liquid water is indicated by a dashed line. (b) Calculated vibrational frequencies (open symbols) for νs at the B3LYP/6-311++G** level for n = 0–20, scaled by a factor of 0.977, compared with experiment (full symbols). Combination bands for n = 2, 6 are expected to arise from a combination of CO2 bending and water libration. Reproduced and adapted with permission from ref (82) under Creative Commons Attribution (CC-BY) license. Copyright 2019 The Authors.
Figure 5
Figure 5
Selected isomers of CO2(H2O)n optimized at the B3LYP/6-311++G** level, along with the relative energy in kJ mol–1 and position of the symmetric stretch in CO2 in cm–1 (scaled by 0.977). Reproduced with permission from ref (82) under Creative Commons Attribution (CC-BY) license. Copyright 2019 The Authors.
Figure 6
Figure 6
IRMPD spectra of Zn+(H2O)n ions, where a one-photon process is assumed. The only observed dissociation event is water molecule loss. Symmetric and asymmetric stretching modes of isolated H2O are shown by dashed lines. Reproduced with permission from ref (87) under Creative Commons Attribution 3.0 Unported License. Copyright 2021 The Authors.
Figure 7
Figure 7
(a,b) Calculated IR spectra (above) and experimental IRMPD spectra (below) of Zn2+(H2O)n, n = 8, 10. Symmetric and asymmetric stretching modes of isolated H2O are shown by dashed lines. (c,d) Selected energetically low-lying isomers of Zn2+(H2O)n, n = 8, 10 as optimized at the B3LYP/aug-cc-pVDZ level, with relative energy given in kJ mol−1. Reproduced with permission from ref (92) under Creative Commons Attribution (CC-BY) license. Copyright 2021 The Authors.
Figure 8
Figure 8
Mass spectra of the (H2O)n reaction with SF6 after varying time delay at T = 170 K. At n ≈ 50–60, (900–1080 m/z), (H2O)50 (900 m/z), and F(H2O)54 (991 m/z) magic numbers are observed. Reproduced and adapted with permission from ref (108). Copyright 2015 American Chemical Society.
Figure 9
Figure 9
(a) Kinetics for reaction of (H2O)n (black) with SF6 to form F(H2O)n−Δn (red) at T = 170 K along with a pseudo-first-order fit (line). (b,c) Nanocalorimetric analysis of the reaction showing average size ⟨n⟩ of reactant and product clusters and their difference Δ⟨n⟩. Reproduced with permission from ref (108). Copyright 2015 American Chemical Society.
Scheme 1
Scheme 1. Decomposition of N2O on Co(H2O)n+ through Formation of Either Co–O or Co–N Bond (Reactions 1 and 2, Respectively)
Reproduced with permission from ref (169). Copyright 2021, Royal Society of Chemistry.
Figure 10
Figure 10
(a) Binding energies of N2O toward Co+(H2O)n with different binding modes (1η-NL, 1η-OL, and surface binding) calculated at the M06/6-311++G(d,p) level of theory. (b) Lowest-lying geometries of Co+(H2O)n, for n = 4, 10, and 17. (c) Lowest-lying geometries of [(Co+)(N2O)](H2O)n (1η-NL and 1η-OL) and [(Co2+)(N2O)](H2O)n (1η-N and 1η-O), for n = 16. The yellow and purple clouds illustrate the alpha and beta spin densities, respectively, with an isovalue of 0.06 au. Reproduced and adapted with permission from ref (169). Copyright 2021, Royal Society of Chemistry.

Similar articles

Cited by

References

    1. Born M. Volumen und Hydratationswärme der Ionen. Z. Physik 1920, 1, 45–48. 10.1007/BF01881023. - DOI
    1. Ghosal S.; Hemminger J. C.; Bluhm H.; Mun B. S.; Hebenstreit E. L. D.; Ketteler G.; Ogletree D. F.; Requejo F. G.; Salmeron M. Electron Spectroscopy of Aqueous Solution Interfaces Reveals Surface Enhancement of Halides. Science 2005, 307, 563–566. 10.1126/science.1106525. - DOI - PubMed
    1. Duncan M. A. Spectroscopy of Metal Ion Complexes: Gas-Phase Models for Solvation. Annu. Rev. Phys. Chem. 1997, 48, 69–93. 10.1146/annurev.physchem.48.1.69. - DOI - PubMed
    1. Duncan M. A. Infrared Spectroscopy to Probe Structure and Dynamics in Metal Ion–Molecule Complexes. Int. Rev. Phys. Chem. 2003, 22, 407–435. 10.1080/0144235031000095201. - DOI
    1. Beyer M. K. Hydrated Metal Ions in the Gas Phase. Mass Spectrom. Rev. 2007, 26, 517–541. 10.1002/mas.20135. - DOI - PubMed