. 2023 Apr;10(4):536-552.
doi: 10.1002/acn3.51739. Epub 2023 Feb 6.

PRNP expression predicts imaging findings in sporadic Creutzfeldt-Jakob disease

Affiliations

PRNP expression predicts imaging findings in sporadic Creutzfeldt-Jakob disease

Iris J Broce et al. Ann Clin Transl Neurol. 2023 Apr.

Abstract

Objective: We explored the relationship between regional PRNP expression from healthy brain tissue and patterns of increased and decreased diffusion and regional brain atrophy in patients with sporadic Creutzfeldt-Jakob disease (sCJD).

Methods: We used PRNP microarray data from 6 healthy adult brains from Allen Brain Institute and T1-weighted and diffusion-weighted MRIs from 34 patients diagnosed with sCJD and 30 age- and sex-matched healthy controls to construct partial correlation matrices across brain regions for specific measures of interest: PRNP expression, mean diffusivity, volume, cortical thickness, and local gyrification index, a measure of cortical folding.

Results: Regional patterns of PRNP expression in the healthy brain correlated with regional patterns of diffusion signal abnormalities and atrophy in sCJD. Among different measures of cortical morphology, regional patterns of local gyrification index in sCJD most strongly correlated with regional patterns of PRNP expression. At the vertex-wise level, different molecular subtypes of sCJD showed distinct regional correlations in local gyrification index across the cortex. Local gyrification index correlation patterns most closely matched patterns of PRNP expression in sCJD subtypes known to have greatest pathologic involvement of the cerebral cortex.

Interpretation: These results suggest that the specific genetic and molecular environment in which the prion protein is expressed confer variable vulnerability to misfolding across different brain regions that is reflected in patterns of imaging findings in sCJD. Further work in larger samples will be needed to determine whether these regional imaging patterns can serve as reliable markers of distinct disease subtypes to improve diagnosis and treatment targeting.


Conflict of interest statement

The authors report no competing interests related to this paper. Dr. Geschwind receives or received research support on prion disease from the NIH/NIA (grant R01 AG AG031189; R01AG062562; R56 AG055619) and the Michael J. Homer Family Fund. He has consulted for Adept Field Consulting (Backay Consulting), Ascel Health LLC, Anderson Boutwell Traylor, Best Doctors Inc., Biohaven Pharma Inc., Bioscience Pharma Partners, LLC (BPP), Clarion Consulting, First Thought Consulting, Grand Rounds Inc./UCSF Second Opinion Inc., Maupin Cox Legoy, Quest Diagnostics, Smith & Hennessey LLC and Trinity Partners LLC. He has received speaking honoraria for various medical center lectures, Oakstone Publishing and Wolters Kluwer. He has received past research support from Alliance Biosecure, CurePSP, the Tau Consortium, Quest Diagnostics, and NIH. Dr. Geschwind serves on the board of directors for San Francisco Bay Area Physicians for Social Responsibility and on the editorial board of Dementia & Neuropsychologia.

Figures
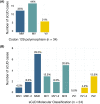
Figure 1
Figure 1
Histograms showing distribution of PRNP codon 129 polymorphism and sCJD molecular classification. (A) Methionine/valine (M/V) genotype information at codon 129 for all 34 sCJD cases (B) M/V genotype at codon 129 and molecular classification for the 24 pathology‐proven sCJD cases.
Figure 2
Figure 2
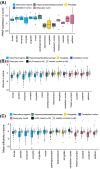
Jitter boxplots of cortical and subcortical regional PRNP expression and imaging measures. (A) PRNP expression in healthy individuals (z‐scored across all regions, participants, and PRNP probes). (B) Volumes in patients with sCJD and healthy controls. (C) Mean diffusivity in patients with sCJD and healthy controls. Imaging measures are z‐scored within each region using the mean and standard deviation of healthy controls. *p ≤ .05. The x‐axis is labeled with respect to brain structure.
Figure 3
Figure 3
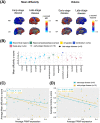
Change in mean diffusivity with disease progression. (A) Mean diffusivity and volume values for Desikan–Killiany atlas cortical ROIs mapped onto the cortical surface for two representative CJD patients, one with early‐stage disease (Barthel score of 100) and the other with late‐stage disease (Barthel score of 50). Blue hues show reduced mean‐diffusivity/volume and red‐yellow hues show increased mean‐diffusivity/volume. Mean diffusivity in involved areas is reduced in early‐stage disease but then increases or pseud‐normalizes in later stage disease when involved areas also show prominent volume loss. (B) Jitter boxplots showing absolute values of z‐scored cortical and subcortical regional mean diffusivity in patients with sCJD and healthy controls. Imaging measures are z‐scored within each region using the mean and standard deviation of healthy controls. The x‐axis is labeled with respect to brain structure. (C) Pearson correlations between averaged MD z‐score values and averaged PRNP expression across 14 brain regions in early‐stage disease and late‐stage sCJD disease. Disease stage was defined by Barthel scores. The linear relationships were non‐uniform with a strong negative relationship between average regional MD and PRNP expression in early‐stage disease and a much weaker relationship at later disease stage. (D) Pearson correlations between averaged volume and averaged PRNP expression across 14 brain regions in early‐stage disease and late‐stage sCJD disease. Disease stage was defined by Barthel scores. The relationship between volume and expression did not meet significance in the late‐stage group, although the slope of the relationship was similar, such that reduced volume was associated with higher PRNP expression in the same region in both early and late disease stage. CDR, clinical dementia rating; RH, right hemisphere; LH, left hemisphere; MD, mean diffusivity.
Figure 4
Figure 4
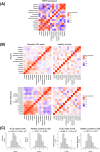
Partial correlation analysis shows relationships between regional patterns of PRNP gene expression and imaging measures. Partial correlation matrices of (A) PRNP expression in healthy individuals, and (B) Volume and mean diffusivity measures in sCJD cases (left) and healthy controls (right). (C) Mantel test evaluating similarity between regional patterns of correlation in PRNP gene expression and regional patterns of correlation in volume (top) and mean diffusivity (bottom) in CJD cases (left) compared to healthy controls (right). In each case the vertical line represents the observed z‐statistic compared to the distribution of values expected under the null hypothesis of chance similarity between the pairs of matrices, one‐tailed p‐values reflect the chance probability of observing a test statistic as extreme as that observed. Regional correlations in PRNP expression are similar to regional correlations in brain volume (r = 0.341, p = 9.25 × 10−4) and mean diffusivity (r = 0.392, p = 1.23 × 10−4) in sCJD cases but not in controls (volume: r = 0.121, p = 0.255; diffusivity r = 0.07, p = 0.471).
Figure 5
Figure 5
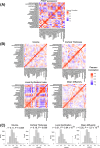
Partial correlation analysis shows relationships between regional patterns of PRNP gene expression and various imaging measures for a finer grained parcellation of the cerebral cortex. (A) Correlation matrix for regional PRNP expression in healthy controls (B) Correlation matrices for regional cortical volume, cortical thickness, local gyrification index, and mean diffusivity in sCJD cases. (C) The corresponding Mantel test evaluating similarity between the regional pattern of correlation for each imaging measure in sCJD cases and the regional pattern of correlation in PRNP gene expression. In each case, the vertical line represents observed z‐statistic compared to the distribution of values expected under the null hypothesis of chance similarity between the pairs of matrices, one‐tailed p‐values reflect the chance probability of observing a test statistic as extreme as that observed. As shown, for lGI and MD, the observed value of the Mantel test statistic (dark line) is far from the expected null distribution and highly significant (p = 3.94 × 10−8 and p = 4.57 × 10−5, respectively), showing strong correlation with the PRNP expression matrix.
Figure 6
Figure 6
Average whole‐brain vertex‐wise correlations in local gyrification index using average lGI from the yellow‐shaded regions as a seed—frontal seed (top) and occipital seed (bottom). (A) sCJD cases (n = 34 cases) compared to healthy controls (n = 30 cases). (B) MM2‐C subtype of sCJD (n = 7 cases), compared to MM1/MV1 subtypes of sCJD (n = 4 cases), and MV2/VV2 subtypes of sCJD (n = 8 cases).

References

    1. Prusiner SB. Novel proteinaceous infectious particles cause scrapie. Science. 1982;216(4542):136‐144. - PubMed
    1. Prusiner SB. Prions. Proc Natl Acad Sci U S A. 1998;95(23):13363‐13383. - PMC - PubMed
    1. Geschwind MD. Prion diseases. Continuum. 2015;21(6 Neuroinfectious Disease):1612‐1638. - PMC - PubMed
    1. Kim MO, Takada LT, Wong K, Forner SA, Geschwind MD. Genetic PrP prion diseases. Cold Spring Harb Perspect Biol. 2018;10(5):a033134. doi: 10.1101/cshperspect.a033134 - DOI - PMC - PubMed
    1. Parchi P, Giese A, Capellari S, et al. Classification of sporadic Creutzfeldt‐Jakob disease based on molecular and phenotypic analysis of 300 subjects. Ann Neurol. 1999;46(2):224‐233. - PubMed

Publication types

Supplementary concepts