. 2023 Feb 21;12(4):e027619.
doi: 10.1161/JAHA.122.027619. Epub 2023 Feb 6.

Application of Magnetocardiography to Screen for Inflammatory Cardiomyopathy and Monitor Treatment Response

Affiliations

Application of Magnetocardiography to Screen for Inflammatory Cardiomyopathy and Monitor Treatment Response

Debora Brala et al. J Am Heart Assoc. .

Abstract

Background Inflammatory cardiomyopathy is one of the most common causes of sudden cardiac death in young adults. Diagnosis of inflammatory cardiomyopathy remains challenging, and better monitoring tools are needed. We present magnetocardiography as a method to diagnose myocardial inflammation and monitor treatment response. Methods and Results A total of 233 patients were enrolled, with a mean age of 45 (±18) years, and 105 (45%) were women. The primary analysis included 209 adult subjects, of whom 66 (32%) were diagnosed with inflammatory cardiomyopathy, 17 (8%) were diagnosed with cardiac amyloidosis, and 35 (17%) were diagnosed with other types of nonischemic cardiomyopathy; 91 (44%) did not have cardiomyopathy. The second analysis included 13 patients with inflammatory cardiomyopathy who underwent immunosuppressive therapy after baseline magnetocardiography measurement. Finally, diagnostic accuracy of magnetocardiography was tested in 3 independent cohorts (total n=23) and 1 patient, who developed vaccine-related myocarditis. First, we identified a magnetocardiography vector to differentiate between patients with cardiomyopathy versus patients without cardiomyopathy (vector of ≥0.051; sensitivity, 0.59; specificity, 0.95; positive predictive value, 93%; and negative predictive value, 64%). All patients with inflammatory cardiomyopathy, including a patient with mRNA vaccine-related myocarditis, had a magnetocardiography vector ≥0.051. Second, we evaluated the ability of the magnetocardiography vector to reflect treatment response. We observed a decrease of the pathologic magnetocardiography vector toward normal in all 13 patients who were clinically improving under immunosuppressive therapy. Magnetocardiography detected treatment response as early as day 7, whereas echocardiographic detection of treatment response occurred after 1 month. The magnetocardiography vector decreased from 0.10 at baseline to 0.07 within 7 days (P=0.010) and to 0.03 within 30 days (P<0.001). After 30 days, left ventricular ejection fraction improved from 42.2% at baseline to 53.8% (P<0.001). Conclusions Magnetocardiography has the potential to be used for diagnostic screening and to monitor early treatment response. The method is valuable in inflammatory cardiomyopathy, where there is a major unmet need for early diagnosis and monitoring response to immunosuppressive therapy.

Keywords: COVID‐19; echocardiography; ejection fraction; immunosuppressive therapy; inflammatory cardiomyopathy; magnetocardiography.


Figures

Figure 1
Figure 1. Evolution of the magnetic field during treatment of a subject with inflammatory cardiomyopathy (exemplary).
Magnetocardiography (MCG) measures cardiac magnetic fields tangential to the chest surface by using 64 first‐order gradiometers in an area of 162×162 mm with a sensor interval of ≈35 mm. The MCG signals were recorded at a sampling rate of 512 Hz. The inserted sensor array of type II consists of 48 tangential sensors and 16 axial sensors, which can measure magnetic field components along all 3 axes. In comparison, the older sensor type I consists of 64 axial sensors. The main dimensions of the sensor array are shown in Figure 1. The outer sensor circle has a diameter of 246 mm. First‐order gradiometer pickup coils are used with a passive magnetically shielding room (MSR) to reduce the external magnetic noise to an acceptable level. To achieve this, 4 layers of mu‐metal have been installed in the MSR. First row: The graphics show changes in heart polarization during immunosuppressive therapy. MCG measures the heart's magnetic field in 3 axes (x, y, and z). The colors represent the strength of the magnetic field on the sagittal plane (z axis). The sizes and positions of the magnetic fields are reported in millimeters. The negative pole (minimal measured magnetic field strength) is colored in black, and the positive poles (maximal measured magnetic field strength) is colored in white. All other colors are based on the jet color scheme within this range. A change in color from red to yellow to dark purple is therefore proportional to the change in the magnetic field strength. The multipolarity of 2 positive poles (red color) and 1 negative pole (dark purple color) of the heart's magnetic field is detected in a patient with inflammatory cardiomyopathy. Second row: The graphics show the vector change of the same subject as in the first row during immunosuppressive therapy. The initial MCG vector (left) is broad and wide in the second quadrant. After 3 days of immunosuppressive therapy, the vector becomes slimmer (panel in the middle). After nearly 3 weeks (right), the vector remains narrow and moves toward the first quadrant, a sign of therapy response. Changes of the vector correspond to changes in the magnetic field.
Figure 2
Figure 2. Display of the structure of the magnetocardiography (MCG) instrument (original and schematic).
A, On the left side is a photograph of the MCG instrument in its original size. MCG is a method to measure the heart's magnetic field without exposure to radiation. The vessel in the middle represents the dewar, the functional core of the MCG instrument. Subjects lie down on the stretcher, and the dewar is positioned over their chest without contact. B, On the right side is a schematic representation of the structure of the MCG instrument. The dewar contains the superconducting quantum interference device (SQUID) sensors that detect the heart's magnetic signals. The measurements are conducted in a magnetically shielded room to avoid deflection or other magnetic disturbances.
Figure 3
Figure 3. Study flow diagram of primary analysis.
In total, 233 patients were enrolled in this study. The primary analysis included 209 adult subjects, of whom 66 subjects (32%) were diagnosed with inflammatory cardiomyopathy, 17 (8%) were diagnosed with cardiac amyloidosis, and 35 (17%) were diagnosed with other types of nonischemic cardiomyopathy; 91 (44%) did not have cardiomyopathy. The second analysis included 13 patients with inflammatory cardiomyopathy, who underwent initiation of immunosuppressive therapy after baseline magnetocardiography (MCG) measurement. Finally, diagnostic accuracy of MCG was tested in 3 independent cohorts (total n=23) and 1 patient who developed myocarditis after COVID‐19 vaccine.
Figure 4
Figure 4. Magnetocardiography (MCG) vector and left ventricular ejection fraction (LVEF) at baseline and after 7 and 30 days of administering immunosuppressive agents.
A, MCG vector (changed significantly over time after administration of immunosuppressive agents; F [2, 24]=17.612; P<0.001). In particular, the MCG vector decreased from 0.10 (95% CI, 0.08–0.13) at baseline to 0.07 (95% CI, 0.04–0.09) within 7 days after administration of immunosuppressive agents (P=0.010). Within 30 days of administering immunosuppressants, the MCG vector decreased further to 0.03 (95% CI, 0.01–0.05); P<0.001 compared with baseline. B, LVEF (percentage) changed significantly over time after administration of immunosuppressive agents (F [2, 24]=19.31; P<0.001). However, within 7 days of administering immunosuppressive agents, change in left ventricular ejection fraction was not significant: 42.2% (95% CI, 34.2%–50.1%) at baseline vs 45.2% (95% CI, 37.2%–53.1%) after 7 days (P=0.414). Given 30 days of immunosuppressive therapy, left ventricular ejection fraction changed significantly to 53.8% (95% CI, 45.9%–61.8%); P<0.001 compared with baseline.
Figure 5
Figure 5. Magnetocardiography (MCG) vector and left ventricular ejection fraction (LVEF) at baseline and after 7 and 30 days of administering immunosuppressive agents (percentage from baseline).
Change in MCG vector (∆ MCG vector) compared with change in LVEF (∆ LVEF) differed significantly from each other after 7 days of administering immunosuppressive agents: ∆ MCG vector −30.38% (±24.21%) vs ∆ LVEF 8.66% (±14.17%) (P<0.001). ∆ MCG vector compared with ∆ LVEF after 30 days of immunosuppressive therapy: ∆ MCG vector −43.29% (±25.28%) vs ∆ LVEF 26.45% (±37.11%) (P<0.001).
Figure 6
Figure 6. Illustration of cardiac magnetic resonance imaging (CMR) from patients with inflammatory cardiomyopathy and their corresponding magnetocardiography (MCG) vector during therapy.
Each row illustrates the data of an individual patient. First column: CMR images of 2 patients with myocarditis; second and third columns: MCG vector at baseline and after approximately 1 month of anti‐inflammatory therapy.
Figure 7
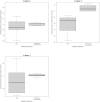
Figure 7. Evaluation of the magnetocardiography (MCG) vector in 3 independent cohorts: change in MCG vector and left ventricular ejection fraction between baseline and 7 days.
Cohort 1: patients without inflammatory cardiomyopathy receiving immunosuppression (n=10). Cohort 2: patients with inflammatory cardiomyopathy not receiving immunosuppression (n=4). Cohort 3: patients with post–COVID‐19 condition (n=9). The MCG vector in the cohort with inflammatory cardiomyopathy was abnormal (>0.051), whereas it was normal in the cohorts without inflammation (<0.051).

References

    1. Felker GM, Thompson RE, Hare JM, Hruban RH, Clemetson DE, Howard DL, Baughman KL, Kasper EK. Underlying causes and long‐term survival in patients with initially unexplained cardiomyopathy. N Engl J Med. 2000;342:1077–1084. doi: 10.1056/NEJM200004133421502 - DOI - PubMed
    1. Tschope C, Ammirati E, Bozkurt B, Caforio ALP, Cooper LT, Felix SB, Hare JM, Heidecker B, Heymans S, Hubner N, et al. Myocarditis and inflammatory cardiomyopathy: current evidence and future directions. Nat Rev Cardiol. 2021;18:169–193. doi: 10.1038/s41569-020-00435-x - DOI - PMC - PubMed
    1. Heidecker BCL. Acute Fulminant Myocarditis. In: Brown DL, ed. Cardiac Intensive Care. 3rd ed. Elsevier; 2019:199–204.
    1. Cooper LT Jr, Berry GJ, Shabetai R. Idiopathic giant‐cell myocarditis—natural history and treatment. Multicenter Giant Cell Myocarditis Study Group Investigators. N Engl J Med. 1997;336:1860–1866. doi: 10.1056/NEJM199706263362603 - DOI - PubMed
    1. Caforio AL, Pankuweit S, Arbustini E, Basso C, Gimeno‐Blanes J, Felix SB, Fu M, Helio T, Heymans S, Jahns R, et al. Current state of knowledge on aetiology, diagnosis, management, and therapy of myocarditis: a position statement of the European Society of Cardiology Working Group on Myocardial and Pericardial Diseases. Eur Heart J. 2013;34:2636–2648. 2648a‐2648d. doi: 10.1093/eurheartj/eht210 - DOI - PubMed

Publication types