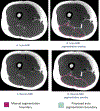
Deep learning-based automatic pipeline for quantitative assessment of thigh muscle morphology and fatty infiltration
- PMID: 36744695
- PMCID: PMC10050107
- DOI: 10.1002/mrm.29599
Deep learning-based automatic pipeline for quantitative assessment of thigh muscle morphology and fatty infiltration
Abstract
Purpose: Fast and accurate thigh muscle segmentation from MRI is important for quantitative assessment of thigh muscle morphology and composition. A novel deep learning (DL) based thigh muscle and surrounding tissues segmentation model was developed for fully automatic and reproducible cross-sectional area (CSA) and fat fraction (FF) quantification and tested in patients at 10 years after anterior cruciate ligament reconstructions.
Methods: A DL model combining UNet and DenseNet was trained and tested using manually segmented thighs from 16 patients (32 legs). Segmentation accuracy was evaluated using Dice similarity coefficients (DSC) and average symmetric surface distance (ASSD). A UNet model was trained for comparison. These segmentations were used to obtain CSA and FF quantification. Reproducibility of CSA and FF quantification was tested with scan and rescan of six healthy subjects.
Results: The proposed UNet and DenseNet had high agreement with manual segmentation (DSC >0.97, ASSD < 0.24) and improved performance compared with UNet. For hamstrings of the operated knee, the automated pipeline had largest absolute difference of 6.01% for CSA and 0.47% for FF as compared to manual segmentation. In reproducibility analysis, the average difference (absolute) in CSA quantification between scan and rescan was better for the automatic method as compared with manual segmentation (2.27% vs. 3.34%), whereas the average difference (absolute) in FF quantification were similar.
Conclusions: The proposed method exhibits excellent accuracy and reproducibility in CSA and FF quantification compared with manual segmentation and can be used in large-scale patient studies.
Keywords: automated segmentation; deep learning; magnetic resonance imaging; thigh muscle.
© 2023 The Authors. Magnetic Resonance in Medicine published by Wiley Periodicals LLC on behalf of International Society for Magnetic Resonance in Medicine.
Figures


References
-
- Brown TD, Johnston RC, Saltzman CL, Marsh JL, Buckwalter JA. Posttraumatic osteoarthritis: a first estimate of incidence, prevalence, and burden of disease. Journal of orthopaedic trauma. 2006;20(10):739–744. - PubMed
-
- Arant KR, Katz JN. Epidemiology of Post-traumatic Osteoarthritis of the Lower Extremity: Premature Aging of Youthful Joints. In: Lattermann C, Madry H, Nakamura N, Kon E, eds. Early Osteoarthritis: State-of-the-Art Approaches to Diagnosis, Treatment and Controversies. Springer International Publishing; 2022:39–49.
Publication types
MeSH terms
Grants and funding
LinkOut - more resources
Full Text Sources

