Review
. 2025 Jan-Feb;44(1):22-42.
doi: 10.1002/mas.21820. Epub 2023 Feb 6.

The isotope distribution: A rose with thorns

Affiliations
Review

The isotope distribution: A rose with thorns

Jürgen Claesen et al. Mass Spectrom Rev. 2025 Jan-Feb.

Abstract

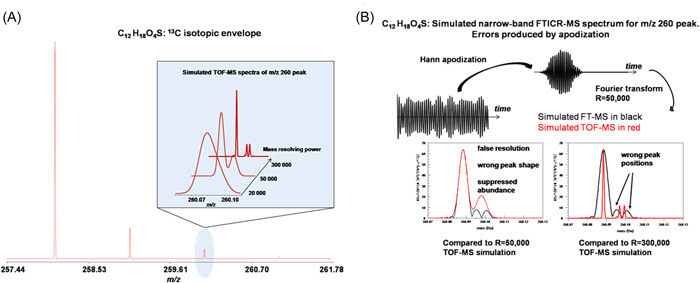
The isotope distribution, which reflects the number and probabilities of occurrence of different isotopologues of a molecule, can be theoretically calculated. With the current generation of (ultra)-high-resolution mass spectrometers, the isotope distribution of molecules can be measured with high sensitivity, resolution, and mass accuracy. However, the observed isotope distribution can differ substantially from the expected isotope distribution. Although differences between the observed and expected isotope distribution can complicate the analysis and interpretation of mass spectral data, they can be helpful in a number of specific applications. These applications include, yet are not limited to, the identification of peptides in proteomics, elucidation of the elemental composition of small organic molecules and metabolites, as well as wading through peaks in mass spectra of complex bioorganic mixtures such as petroleum and humus. In this review, we give a nonexhaustive overview of factors that have an impact on the observed isotope distribution, such as elemental isotope deviations, ion sampling, ion interactions, electronic noise and dephasing, centroiding, and apodization. These factors occur at different stages of obtaining the isotope distribution: during the collection of the sample, during the ionization and intake of a molecule in a mass spectrometer, during the mass separation and detection of ionized molecules, and during signal processing.

Keywords: (ultra)‐high‐resolution mass spectrometry; coalescence; data processing; ion trap; isotope distribution.


Figures

Figure 1
Figure 1
Theoretical fine (left) and aggregated (right) isotope distribution of the peptide PEPTIDIC. [Color figure can be viewed at wileyonlinelibrary.com]
Figure 2
Figure 2
Mass of erythromycin measured with 1 ppm accuracy matches up to 15 possible elemental compositions containing C, H, N, and O. 13C isotopic envelope combined with the accurate mass allows unambiguous identification. [Color figure can be viewed at wileyonlinelibrary.com]
Figure 3
Figure 3
Factors (in red) influencing the observed isotope distribution: the elemental isotope definition deviations (δ), the sampling process, ion interactions, electronic noise, and dephasing adopization and centroiding. [Color figure can be viewed at wileyonlinelibrary.com]
Figure 4
Figure 4
Mass spectrum (black line) of 13C isotopic envelope of peptide Substance P measured at the mass resolving power of 450,000on 10 Tesla FTICR mass spectrometer equipped with the 4×‐ICR ion trap allowing acquisition of ion signals at 4× cyclotron frequency (Nagornov et al., 2014). Mass spectrum (shown in black) exhibits clear resolving of the isotopic fine structure of the peaks in the envelope containing different number of 13C isotopes in good agreement with the spectra calculated (shown in red) for the same resolving power using the Mercury algorithm by Rockwood et al.(Rockwood et al., 1995). (Experimental data for the figure was kindly provided by Dr. Yury O. Tsybin and Dr. Konstantin O. Nagornov from Spectroswiss, Lausanne, Switzerland). FTICR, Fourier transform ion cyclotron resonance. [Color figure can be viewed at wileyonlinelibrary.com]
Figure 5
Figure 5
Mass spectrum of singly charged Substance P measured using 12 Tesla FTICR‐MS instrument. Due to the detrimental effect from the Coulombic interactions between the ion components of the 13C isotopic envelope the time‐domain signals decay differently for different isotopic species. [Color figure can be viewed at wileyonlinelibrary.com]
Figure 6
Figure 6
Mass spectrum of Substance P, measured with 12 Tesla FTICR‐MS. This shows the effect of Coulombic interactions between ions from the peptide's 13C isotopic envelope on the relative abundances of the isotopic components. The ion species from lower abundance components of the isotopic distribution experience stronger electric field distortion from the higher abundance species. This results in desynchronization of the motion of these species at faster rate and, thus, decreasing in the relative intensity of their signals. The spectrum shown in red is obtained from the earlier part of the time‐domain when the ions from all isotopologues are present in the synchronized ion motion. The spectrum shown in blue is obtained from the later stage of the time‐domain when the lower abundance isotopologue ion species are not contributing to the signal anymore due to desynchronization of their motion. [Color figure can be viewed at wileyonlinelibrary.com]
Figure 7
Figure 7
A model of the coalescence phenomenon of two Coulombically interacting ion clouds consisting of N 1 and N 2 numbers of ions with close masses m 1 and m 2, respectively (Mitchell & Smith,; Peurrung & Kouzes, 1995). Electric field generated by the ion clouds in the presence of magnetic field B results in drift circular motion of clouds around each other at the radius of r d and inducing a single signal on the detection electrodes as the two ion clouds become phase locked (“coalesce”) and are, thus, being detected as a single entity. [Color figure can be viewed at wileyonlinelibrary.com]
Figure 8
Figure 8
Mass spectrum of two coeluted double‐charged peptides with mass difference of 1 Da obtained using Orbitrap Elite FTMS. The 13C isotopic envelopes of the peptides are overlapped. Increasing the number of trapped ions (bottom spectrum) results in coalescence of the peptide ions with close m/z ratios and measuring faked mass spectrum of 13C envelope of the peptide not present in the sample. Reprinted with permission from Tarasova et al. (2015), copyright year 2015 (Sage Publishing).
Figure 9
Figure 9
Simulation of the apodization effect on the shape of the isotopic fine structure of C12H18O4S. (A) Mass spectrum of the 13C isotopic cluster and a change in the shape of the fine structure peaks with mass resolving power at m/z 260; (B) Distortion of the fine structure peak shapes of the FTICR mass domain at m/z 260 due to apodization. The apodization function was chosen such that if there were no isotopic fine structure the resolution would be ~50,000 FWHM. Also shown, the overlays of the TOF‐MS simulations at two TOF‐MS resolutions, ~50,000 and ~300,000 FWHM. FWHM, full width at half maximum; TOF, time of flight‐mass spectrometry. [Color figure can be viewed at wileyonlinelibrary.com]
Figure 10
Figure 10
Simulation of the effect of resolution on 116 Da peak of BrCl. Peak widths are 0.0010, 0.0014, and 0.0035 Da. Simulated spectra are normalized to set the peak apexof the mono‐isotopic peak (115 Da) to a value of 1.00 at each resolution setting. [Color figure can be viewed at wileyonlinelibrary.com]

References

    1. Aebersold R, Mann M. 2003. Mass spectrometry‐based proteomics. Nature. 422: 198‐207. - PubMed
    1. Aizikov K, Mathur R, O'Connor PB. 2009. The spontaneous loss of coherence catastrophe in Fourier transform ion cyclotron resonance mass spectrometry. J Am Soc Mass Spectrom. 20(2): 247‐256. - PMC - PubMed
    1. Allwood JW, Parker D, Beckmann M, Draper J, Goodacre R. 2011. Fourier transform ion cyclotron resonance mass spectrometry for plant metabolite profiling and metabolite identification. In: Hardy N., Hall R. (eds) Plant Metabolomics. Methods in Molecular Biology (Methods and Protocols), Vol. 860. pp 157‐176. Humana Press. - PubMed
    1. Bartelink EJ, Chesson LA. 2019. Recent applications of isotope analysis to forensic anthropology. Forensic Sci Res. 4(1): 29‐44. - PMC - PubMed
    1. Beavis RC. 1993. Chemical mass of carbon in proteins. Anal Chem. 65: 496‐497.

LinkOut - more resources