Review
. 2023 Apr 1;14(4):e00567.
doi: 10.14309/ctg.0000000000000567.

Understanding Our Tests: Hydrogen-Methane Breath Testing to Diagnose Small Intestinal Bacterial Overgrowth

Affiliations
Review

Understanding Our Tests: Hydrogen-Methane Breath Testing to Diagnose Small Intestinal Bacterial Overgrowth

Aylin Tansel et al. Clin Transl Gastroenterol. .

Abstract

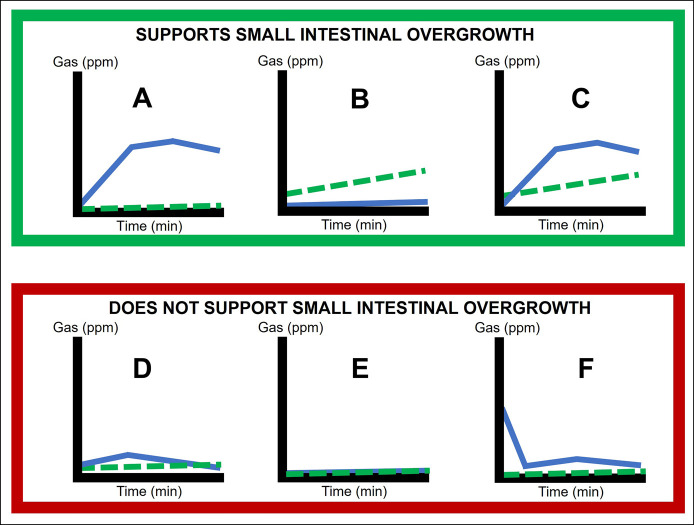
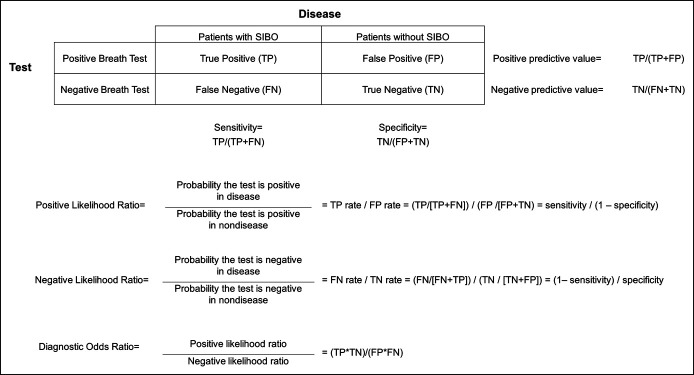
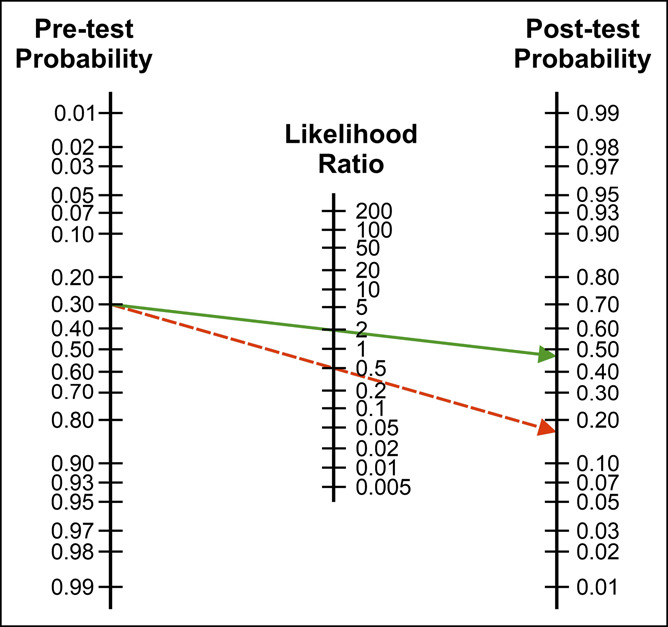
There is increasing appreciation that small intestinal bacterial overgrowth (SIBO) drives many common gastrointestinal symptoms, including diarrhea, bloating, and abdominal pain. Breath testing via measurement of exhaled hydrogen and methane gases following ingestion of a readily metabolized carbohydrate has become an important noninvasive testing paradigm to help diagnose SIBO. However, because of a number of physiological and technical considerations, how and when to use breath testing in the diagnosis of SIBO remains a nuanced clinical decision. This narrative review provides a comprehensive overview of breath testing paradigms including the indications for testing, how to administer the test, and how patient factors influence breath testing results. We also explore the performance characteristics of breath testing (sensitivity, specificity, positive and negative predictive values, likelihood ratios, and diagnostic odds ratio). Additionally, we describe complementary and alternative tests for diagnosing SIBO. We discuss applications of breath testing for research. Current estimates of SIBO prevalence among commonly encountered high-risk populations are reviewed to provide pretest probability estimates under a variety of clinical situations. Finally, we discuss how to integrate breath test performance characteristics into clinical care decisions using clinical predictors and the Fagan nomogram.


Conflict of interest statement

Guarantor of the article: Aylin Tansel, MD, MPH.

Specific author contributions: A.T.: planning, reviewing the literature, collecting data, interpreting data, and drafting and revising the manuscript. D.J.L.: planning, reviewing the literature, interpreting data, and revising the manuscript.

Financial support: None to report.

Potential competing interests: None to report.

Figures

Figure 1.
Figure 1.
(a and b) Sample glucose breath test reports generally consist of a table (a) with individual breath test values and plot of the data (b). The test is generally measured in 10–30-minute intervals and commonly performed in 2–3 hours. Breath test values at 90 minutes are used for interpretation (highlighted box), but all numbers are provided given variable individual factors that can influence values (i.e., orocecal time). Test interpretation uses the values of the first 90-minute results: peak hydrogen production: normal <20 ppm, increased methane production at any time: normal <10 ppm, f(CO2) closer to 1.00 is ideal. Because the corrected gas levels do not alter the interpretation, observed hydrogen and methane are plotted in Figure 1b. ppm, parts per million.
Figure 2.
Figure 2.
Possible patterns of glucose breath test results and their interpretation. x axis is time (minutes), y axis is gas (ppm), solid line is hydrogen values, and the dashed line represents methane values. (ac) Small intestinal bacterial overgrowth (SIBO) supported: A. high hydrogen, no methane; (b) no hydrogen, high methane; (c) high hydrogen, high methane. (df) SIBO not supported: (d) low hydrogen, low methane; (e) no hydrogen, no methane (flat line); (f) high hydrogen baseline—consider retesting. ppm, parts per million.
Figure 3.
Figure 3.
Diagnostic test parameters and formulas. SIBO, small intestinal bacterial overgrowth; ppm, parts per million.
Figure 4.
Figure 4.
Fagan nomogram example. Starting point at pretest probability—in this example, 28% for symptomatic persons with celiac disease despite gluten-free diet (Table 4). Line drawn based on the likelihood ratio of the positive or negative breath test. Green arrow if the glucose breath test is positive (positive likelihood ratios 2.45) resulting in posttest probability 48.8%; red dashed arrow if the glucose breath test is negative (negative likelihood ratios 0.60) resulting in posttest probability 18.9%.

References

    1. Pimentel M, Saad RJ, Long MD, et al. . ACG clinical guideline: Small intestinal bacterial overgrowth. Am J Gastroenterol 2020;115(2):165–78. - PubMed
    1. Attaluri A, Jackson M, Valestin J, et al. . Methanogenic flora is associated with altered colonic transit but not stool characteristics in constipation without IBS. Am J Gastroenterol 2010;105(6):1407–11. - PMC - PubMed
    1. Rezaie A, Buresi M, Lembo A, et al. Hydrogen and methane-based breath testing in gastrointestinal disorders: The North American consensus. Am J Gastroenterol 2017;112(5):775–84. - PMC - PubMed
    1. Kim G, Deepinder F, Morales W, et al. Methanobrevibacter smithii is the predominant methanogen in patients with constipation-predominant IBS and methane on breath. Dig Dis Sci 2012;57(12):3213–8. - PubMed
    1. Khoshini R, Dai SCSC, Lezcano S, et al. A systematic review of diagnostic tests for small intestinal bacterial overgrowth. Dig Dis Sci 2008;53(6):1443–54. - PubMed