. 2023 Feb 6:12:e80500.
doi: 10.7554/eLife.80500.

A transcriptome atlas of leg muscles from healthy human volunteers reveals molecular and cellular signatures associated with muscle location

Affiliations

A transcriptome atlas of leg muscles from healthy human volunteers reveals molecular and cellular signatures associated with muscle location

Tooba Abbassi-Daloii et al. Elife. .

Abstract

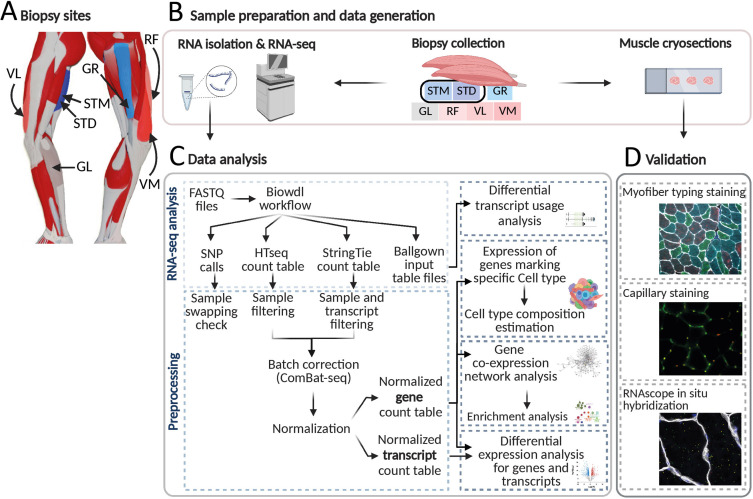
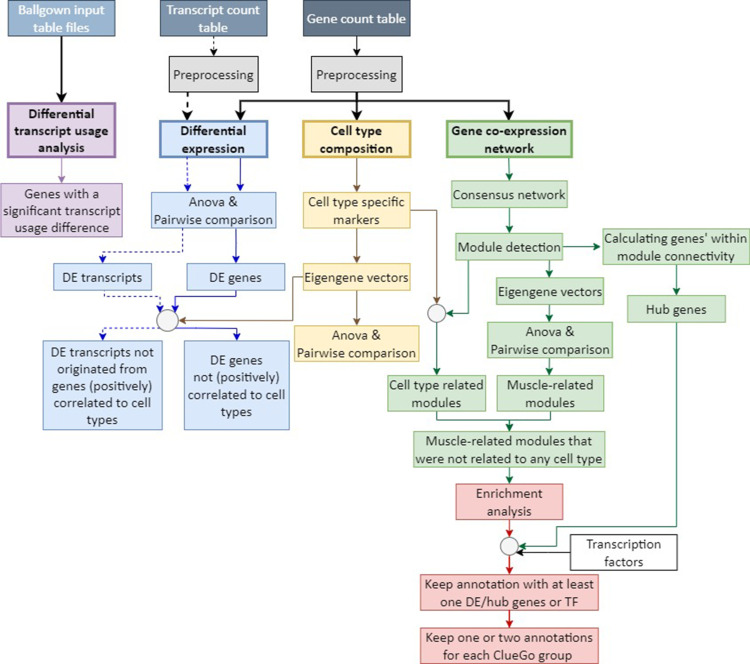
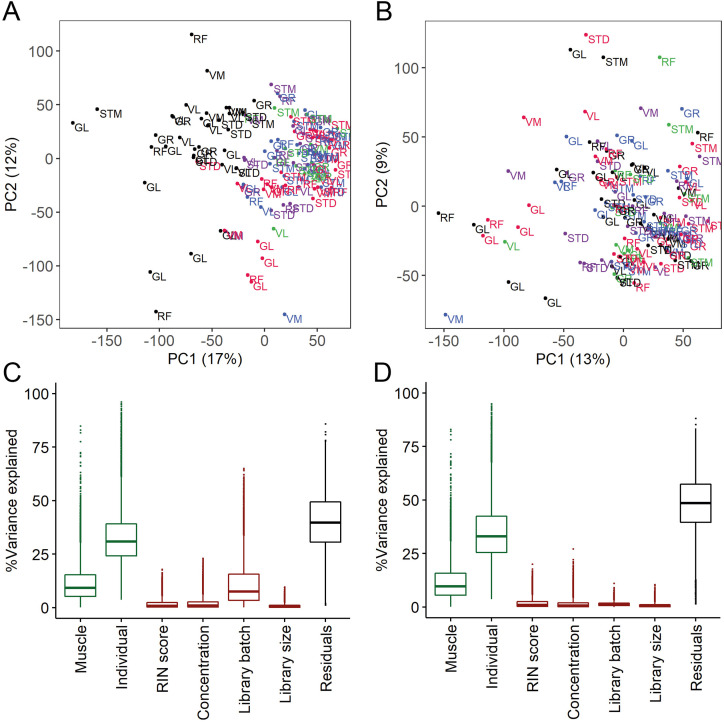
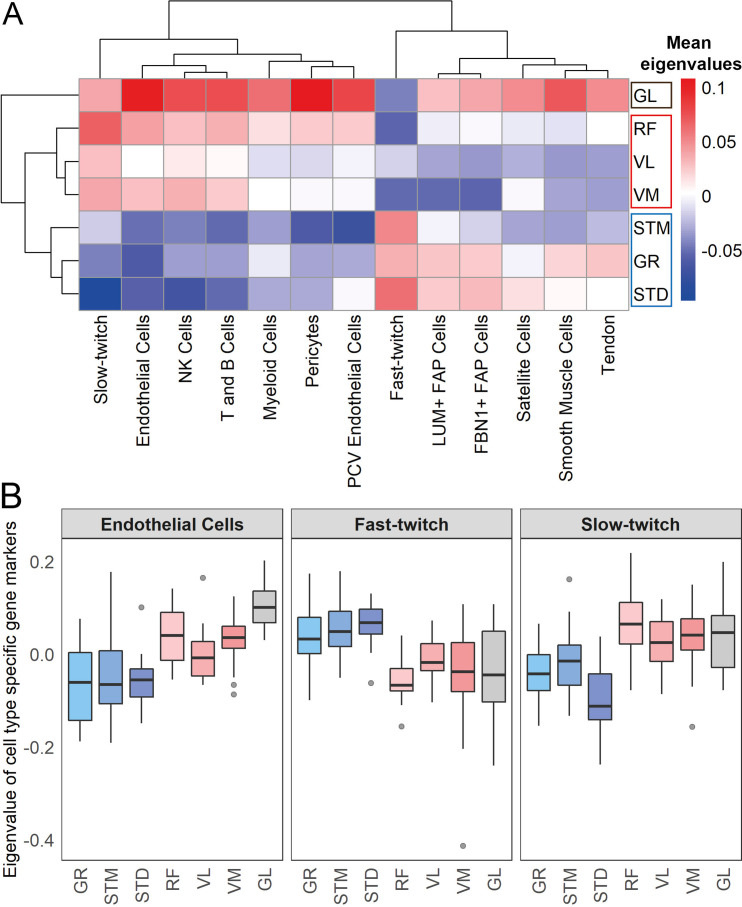
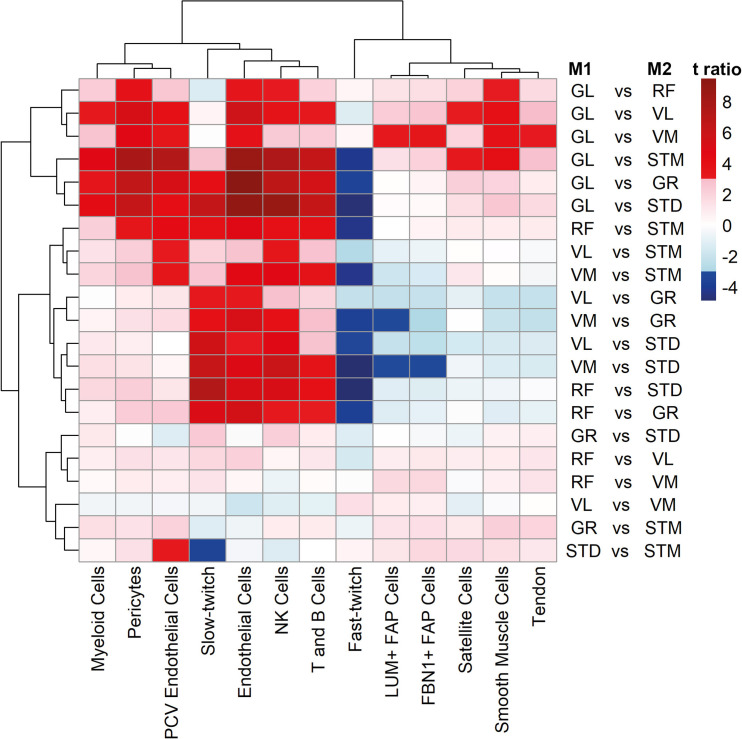
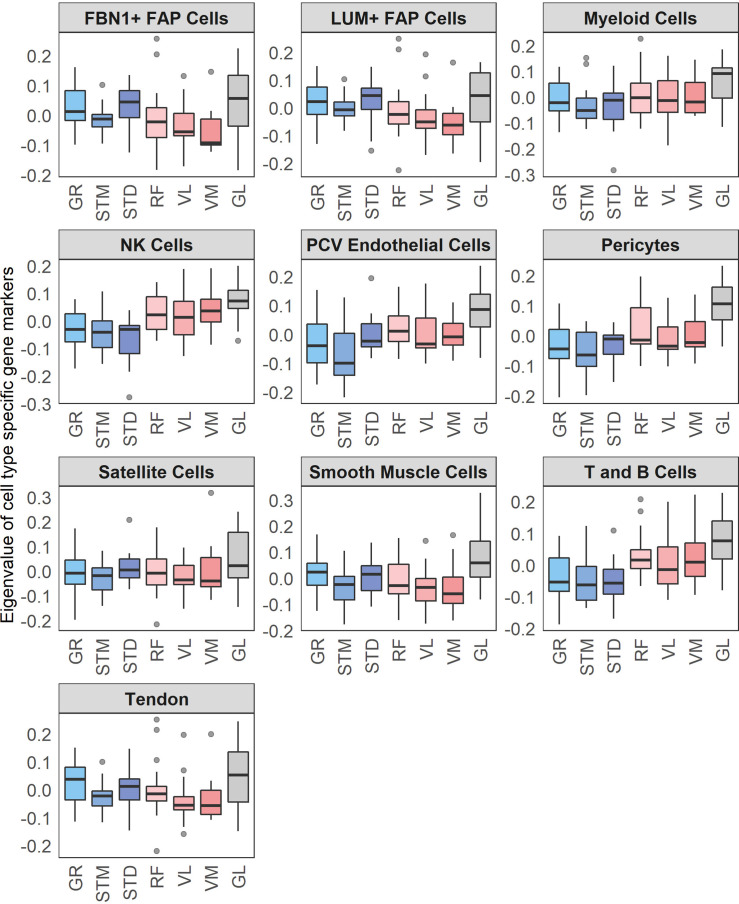
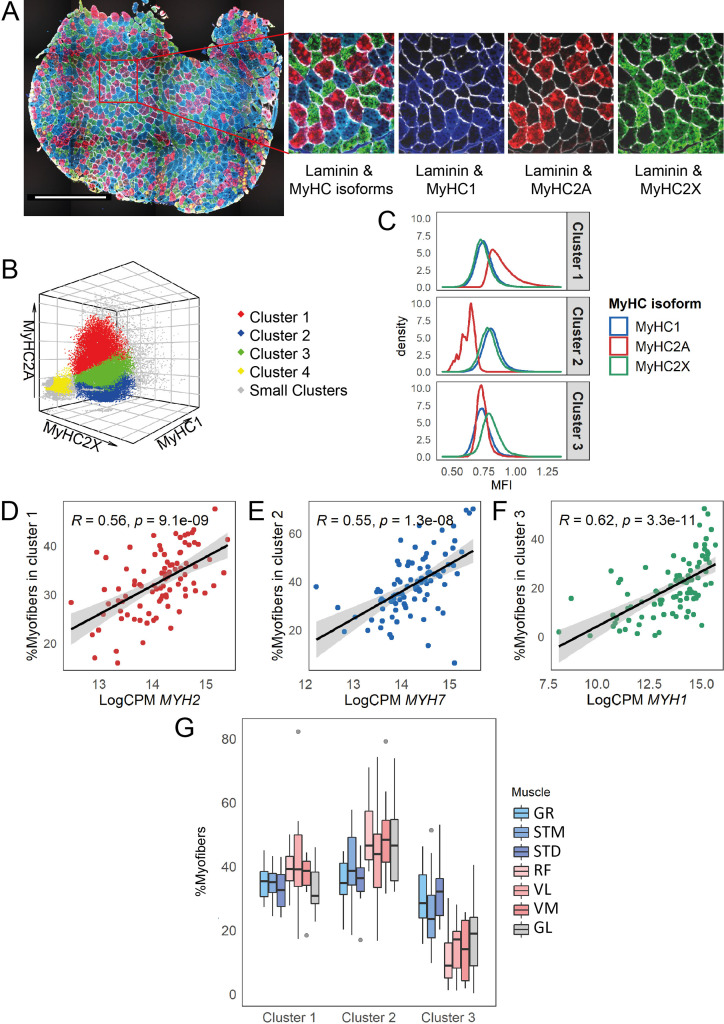
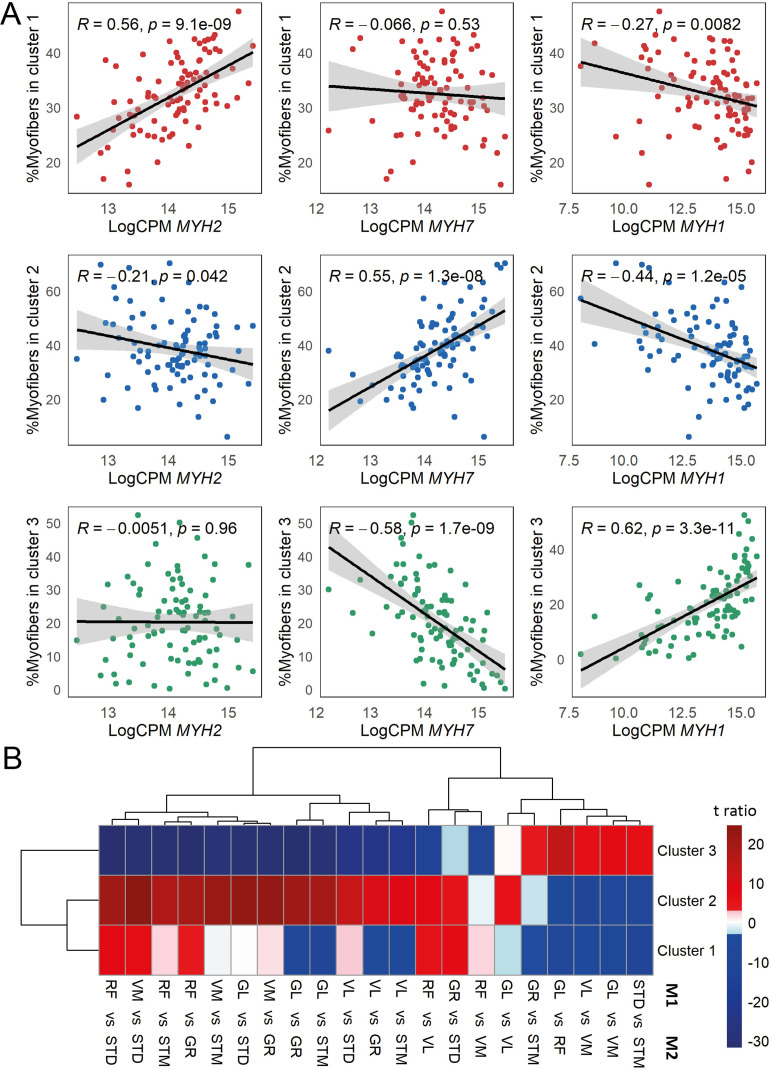
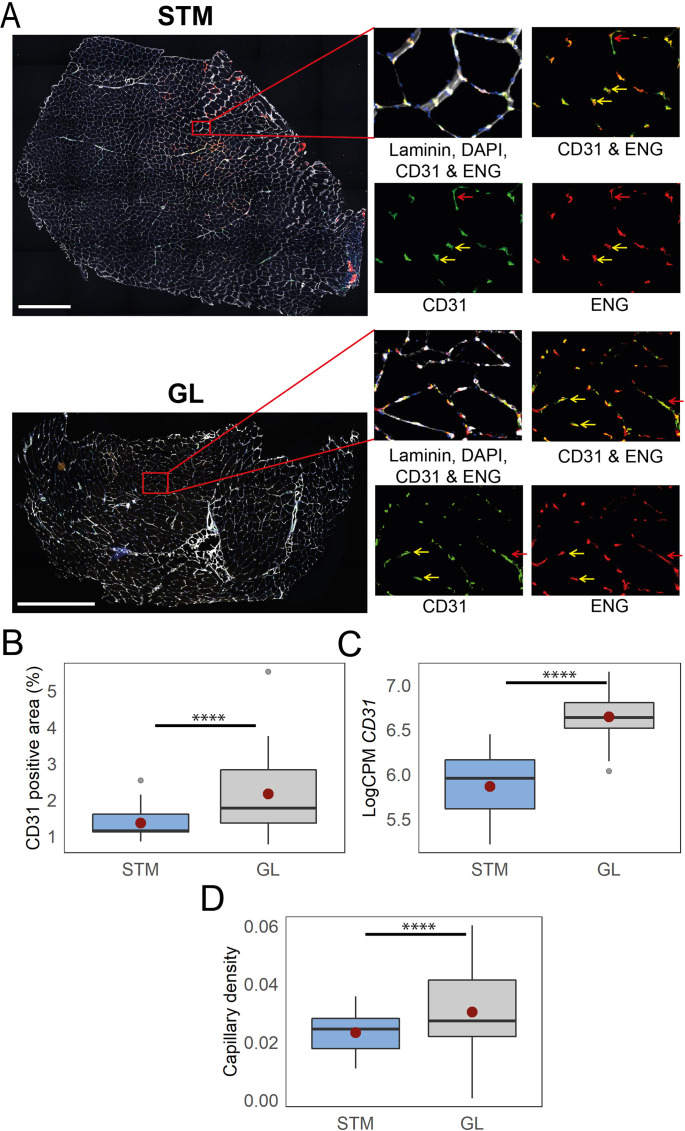
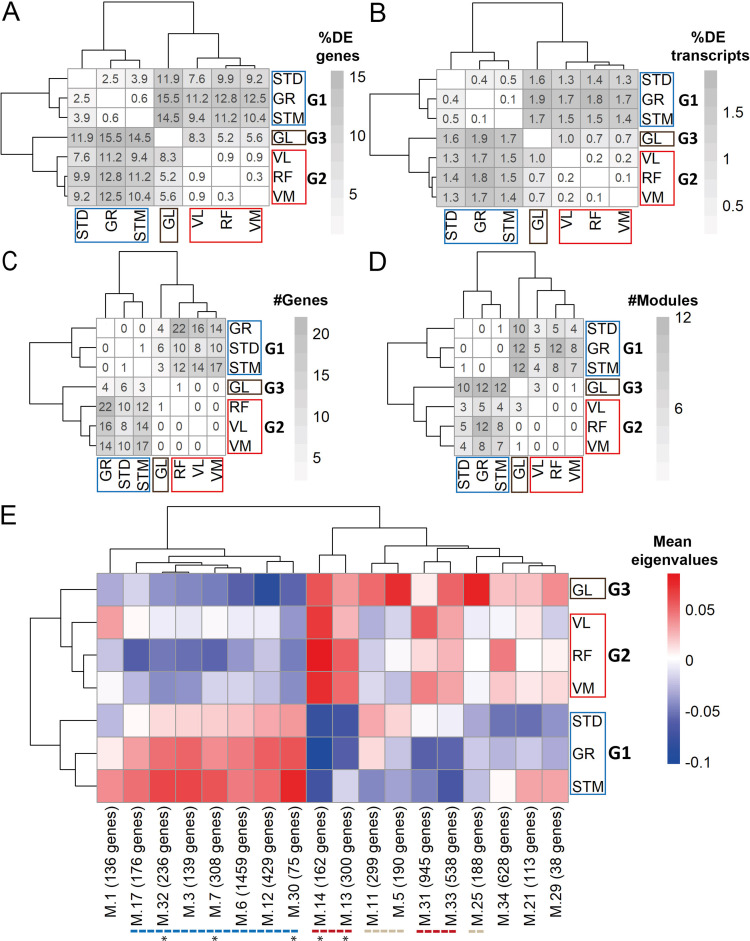
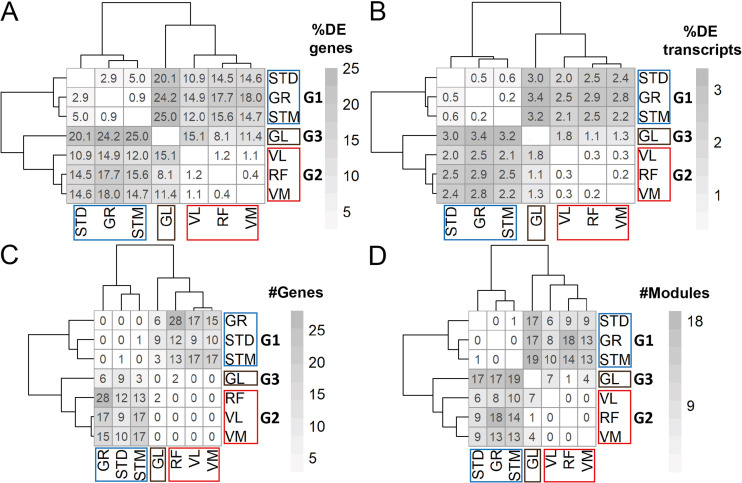
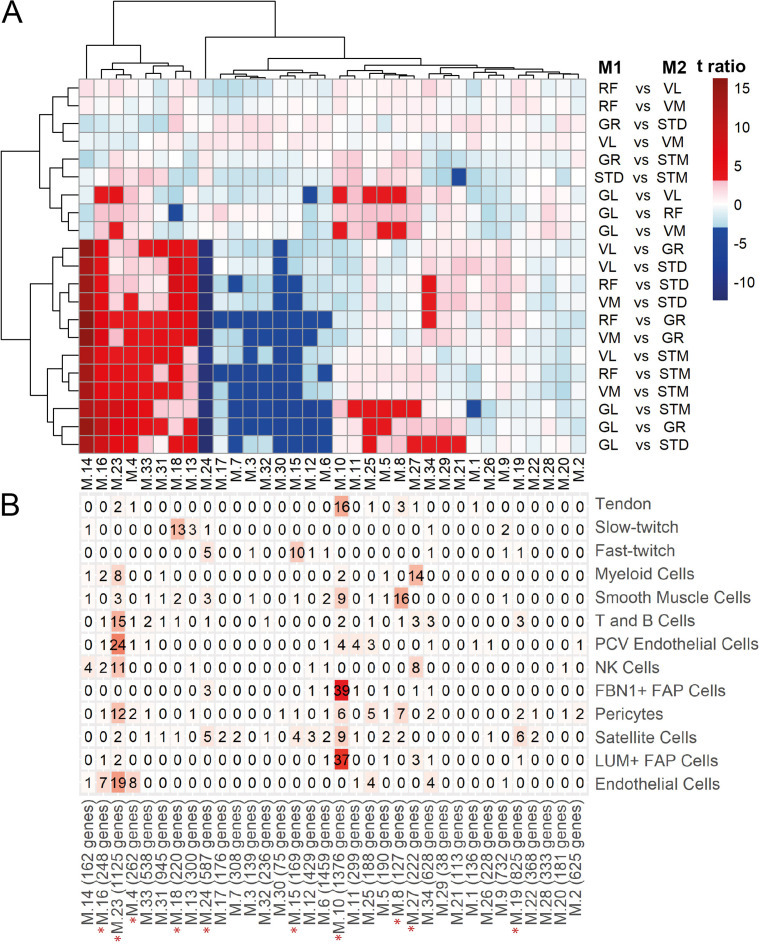
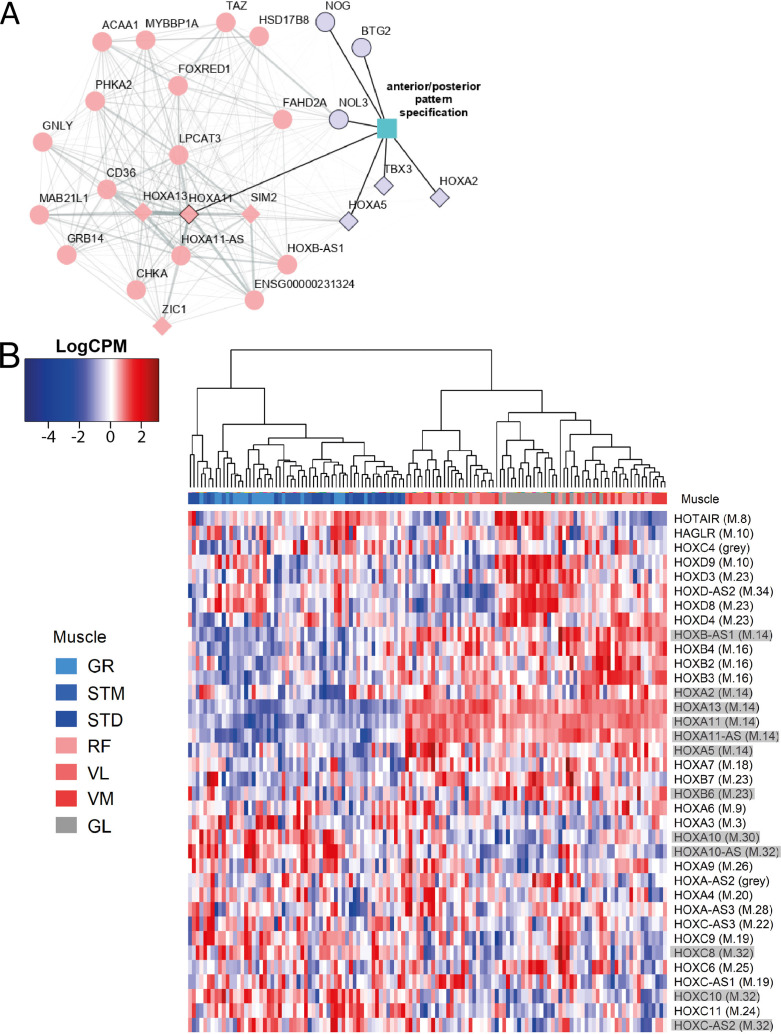
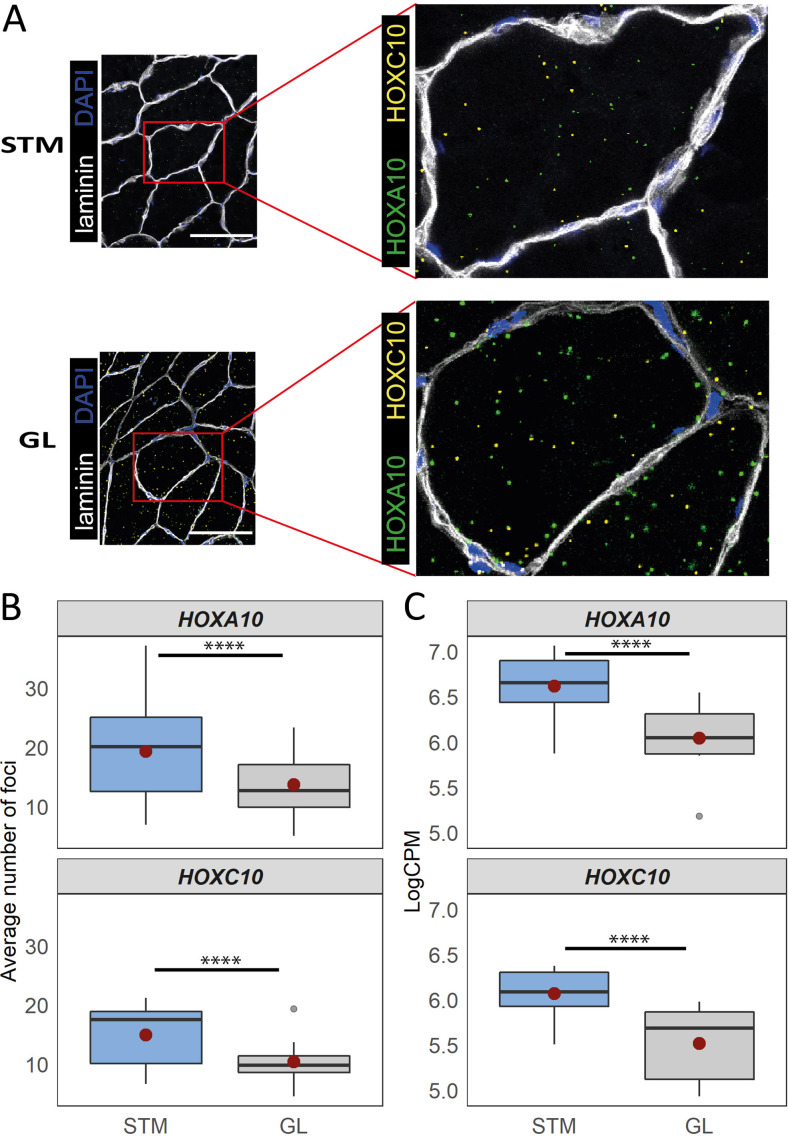
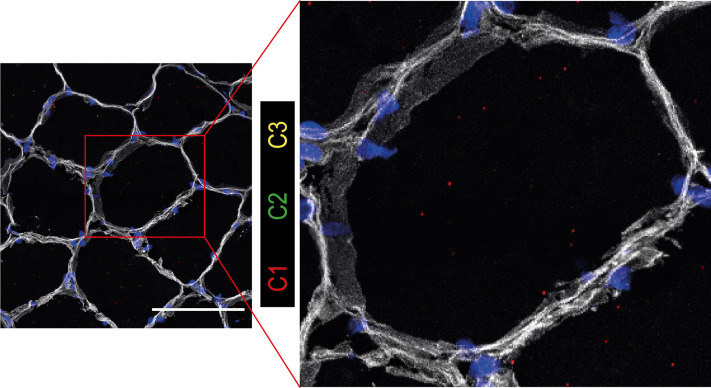
Skeletal muscles support the stability and mobility of the skeleton but differ in biomechanical properties and physiological functions. The intrinsic factors that regulate muscle-specific characteristics are poorly understood. To study these, we constructed a large atlas of RNA-seq profiles from six leg muscles and two locations from one muscle, using biopsies from 20 healthy young males. We identified differential expression patterns and cellular composition across the seven tissues using three bioinformatics approaches confirmed by large-scale newly developed quantitative immune-histology procedures. With all three procedures, the muscle samples clustered into three groups congruent with their anatomical location. Concomitant with genes marking oxidative metabolism, genes marking fast- or slow-twitch myofibers differed between the three groups. The groups of muscles with higher expression of slow-twitch genes were enriched in endothelial cells and showed higher capillary content. In addition, expression profiles of Homeobox (HOX) transcription factors differed between the three groups and were confirmed by spatial RNA hybridization. We created an open-source graphical interface to explore and visualize the leg muscle atlas (https://tabbassidaloii.shinyapps.io/muscleAtlasShinyApp/). Our study reveals the molecular specialization of human leg muscles, and provides a novel resource to study muscle-specific molecular features, which could be linked with (patho)physiological processes.

Keywords: chromosomes; gene expression; human; image analysis; muscle fiber; neuroscience; transcription factors.


Conflict of interest statement

TA, Se, LV, TV, DC, HM, DM, Ev, P', HK, VR No competing interests declared

Figures

Figure 1.
Figure 1.. An overview of biopsies’ location and the study workflow.
(A) A schematic overview of the leg muscles. Arrows point to the muscles that were included in this study. The biopsies, with exception of STM (semitendinosus-middle), were taken from the distal area. (B–D) The study overview includes cryosectioning, RNA-isolation and sequencing (B) data analysis (C) and validations (D). Created with BioRender.
Figure 1—figure supplement 1.
Figure 1—figure supplement 1.. Analysis framework.
A flowchart summarizing the analysis framework used to detect molecular signatures characterizing distinct skeletal muscles. Following pre-processing, muscle-specific signatures were identified using three approaches: differential transcript usage analysis (in purple), differential expression analysis (in blue), cell type composition analysis (in yellow), gene co-expression network analysis (in green), and functional enrichment analysis (in red).
Figure 1—figure supplement 2.
Figure 1—figure supplement 2.. RNA isolation protocols.
The PCA plot shows the effect of the RNA isolation protocols. The scatter plot of PC1 (x-axis) and PC2 (y-axis) shows GR muscle from five individuals from which RNA was isolated using two RNA isolation protocols.
Figure 1—figure supplement 3.
Figure 1—figure supplement 3.. The overview of RNA-seq samples.
An X indicates samples that are not present in the final transcriptome dataset. Fastq files available from the European Genome Archive, Dataset ID: EGAS00001005904.
Figure 1—figure supplement 4.
Figure 1—figure supplement 4.. The quality control and batch correction of RNA-seq data.
(A–B) Scatter plots of PC1 (x-axis) and PC2 (y-axis) before (A) and after (B) batch correction. Each dot presents a sample labeled by muscle tissue. Each library preparation batch is shown with a different color. The re-sequenced batch is denoted in black. (C–D) Box plots show the analysis of variance before (C) and after (D) batch correction. Y-axis shows the percentage of variance explained by different factors. The x-axis shows the known biological (muscle and individual, shown in green) and technical (RIN score, concentration, batch, library size, shown in red) factors. The RNA isolation protocol effect is captured in the individual effect.
Figure 2.
Figure 2.. Muscles cluster into three main groups based on cell type composition.
(A) The heatmap shows the mean eigenvalues of genes marking each cell type across all the individuals. Each row shows a muscle, and each column shows a cell type. FAP stands for fibro-adipogenic progenitors. (B) The boxplot shows the eigenvalues for the endothelial cells, fast-twitch, and slow-twitch myofibers per muscle. The boxes reflect the median and interquartile range.
Figure 2—figure supplement 1.
Figure 2—figure supplement 1.. Cell type composition pairwise comparison between muscles.
The heatmap shows the differences between each pair of muscles. The statistically significant variation between muscles was tested by ANOVA followed by the post-hoc pairwise comparisons. Each row corresponds to a pairwise comparison, and each column shows a cell type. Color-coded cells show the corresponding t-ratio for the differences in eigenvalue of a cell type in each pairwise comparison. The significant differences (Tukey p-value <0.05) are colored red (significantly higher eigenvalues in muscle M1) or blue (significantly higher eigenvalues in muscle M2). The non-significant differences are colored from pink (relatively higher eigenvalues in M1) to light blue (relatively higher eigenvalues in M1).
Figure 2—figure supplement 2.
Figure 2—figure supplement 2.. Cell types’ eigenvalues.
Each boxplot shows the eigenvalues of a cell types across different muscles. The boxes reflect the median and interquartile range.
Figure 3.
Figure 3.. Myofiber type composition is consistent with the expression level of genes marking fast and slow-twitch myofibers.
(A) A representative immunostaining image. The overlay of each myosin heavy chain isoform and laminin are shown separately. Scale bar is 1000 μm. (B) A 3-D scatterplot of the MyHC isoforms MFI. Each dot represents a myofiber. Myofibers in the three largest clusters are denoted with red (Cluster 1), blue (Cluster 2), and green (Cluster 3). The objects with low MFI values for all the isoforms are denoted in yellow (Cluster 4, ~2% of all the dots). In gray are ~4% of myofibers assigned to many small clusters. (C) Density plots show MFI distribution for each MyHC isoform in the three largest clusters. MFI values are scaled (without centering) and transformed. (D–F) Scatterplots show the proportion of the assigned myofibers to each of the largest clusters and the normalized expression of the gene coding the isoform with a relatively higher expression in that specific myofiber cluster. (G) The boxplot shows the proportion of myofibers in the three largest clusters per muscle. Each muscle is depicted with a different color, with G1 muscles in blue, G2 muscles in red and the G3 muscle in gray. The boxes reflect the median and interquartile range.
Figure 3—figure supplement 1.
Figure 3—figure supplement 1.. The association of myofiber clusters with MyHC expression, and myofiber composition differences between muscles.
(A) Scatterplots show correlation between the proportion of the assigned myofibers per cluster and MyHC isoform normalized expression levels. MYH2 codes for MyHC2A, MYH7 codes for MyHC1 and MYH1 codes for MyHC2X. (B) The heatmap shows the differences between each pair of muscles. The statistically significant variation between muscles was tested by ANOVA followed by the post-hoc pairwise comparisons. Each row corresponds to a myofiber cluster, and each column shows a pairwise comparison. Color-coded cells show the corresponding t-ratio for the differences in proportions of myofiber in each pairwise comparison. The significant differences (Tukey p-value <0.05) are colored red (significantly higher proportions in muscle M1) or blue (significantly higher proportions in muscle M2). The non-significant differences are colored from pink (relatively higher proportions in M1) to light blue (relatively higher proportions in M1).
Figure 4.
Figure 4.. Immunostaining confirms higher capillary density in GL compared with STM muscles.
A) Representative images of STM and GL cross-sections immunostained with CD31 (green), ENG (red), and laminin (white). An enlargement of the boxed region is shown on the right: merged and separate channels (CD31 and ENG). Examples of objects recognized as capillaries are depicted by yellow arrows. Examples of objects that were not considered as capillaries due to circularity values are shown by red arrows. Scale bar 1000 μm. (B) The box plot shows the percentage of CD31 positive area in the two muscles. (C) The box plot shows the normalized expression of CD31 gene in the two muscles. (D) The boxplot shows the estimated capillary density in the two muscles. The capillary density was defined as the number of objects (3–51 µm2) with an overlap between CD31 and ENG per unit cross-sectional area of the muscle. The boxes reflect the median and interquartile range (N=19 per muscle). The red dots on the boxes show the mean. **** p-value <1 × 10⁻⁶ (linear mixed-model).
Figure 5.
Figure 5.. Gene expression differences between three groups of muscles not driven by cell type composition.
A) Symmetric heatmap plot shows the percentage of DEGs in different pairwise comparisons. Genes with a high Pearson correlation (R>0.5) with the eigenvector of any cell type (cell type related genes) are excluded. (B) Symmetric heatmap plots show the percentage of DETs in pairwise comparisons. Transcripts originating from cell type related genes are excluded. (C) as in (B), but for the number of genes having at least a significant transcripts usage difference. (D) Symmetric heatmap plot shows the number of modules that were not driven by cell type composition and were significantly different in each pairwise comparison. Each row or column in A–D) represents a muscle. (E) The heatmap shows the modules that reflect the intrinsic differences between groups of muscles. Each row represents a muscle, and each column shows a muscle-related module that was not driven by cell type composition. Color-coded cells show the corresponding average of eigenvalues across all individuals (N=20). Modules with an overall higher expression in G1 or G3 are underlined by a blue or gray dashed line, respectively. The red dashed line underlines the modules with an overall higher expression in both G2 and G3. The black asterisks show modules with the largest differences between the three groups of muscles.
Figure 5—figure supplement 1.
Figure 5—figure supplement 1.. DEA and WGCNA also clustered muscles in three groups.
(A) Symmetric heatmap shows the proportion of all differentially expressed genes in different pairwise comparisons. Each row or column represents a muscle. (B) As in A, but here for the proportion of all differentially expressed transcripts. (C) As in (A) but here for the number of genes with at least a significant transcript usage difference. (D) as in A, but here for the number of modules that were significantly different in each pairwise comparison.
Figure 5—figure supplement 2.
Figure 5—figure supplement 2.. Overview of genes with significant transcript usage difference.
The heatmap shows the number of transcripts with significant usage differences in each pair of muscles. The genes with at least one significant transcript usage difference are listed in rows. The pairwise comparisons with at least one transcript usage difference are shown in columns. Red asterisks highlight genes with a high Pearson correlation (R>0.5) with the eigenvector of any cell type.
Figure 5—figure supplement 3.
Figure 5—figure supplement 3.. WGCNA modules.
A) Each row corresponds to a pairwise comparison and each column shows a muscle-related. Color-coded cells show the corresponding t-ratio for the differences in eigenvalue of a module in each pairwise comparison. The significant differences (Tukey p-value <0.05) are colored red (significantly higher eigenvalues in M1) or blue (significantly higher eigenvalues in M2). The insignificant differences are colored from pink (relatively higher eigenvalues in M1) to light blue (relatively higher eigenvalues in M1). (B) The table shows the intersection of the genes in the modules (columns) with genes marking different cell types (rows). Color-coded cells show the corresponding intersection number. The red asterisks show modules driven by cell type composition.
Figure 6.
Figure 6.. A schematic representation of genes with higher expression in G2 and G3, related to oxidative phosphorylation and metabolic pathways in the mitochondria.
60 (out of the 122) mitochondrial genes with higher expression in G2 and G3 are shown in red. The electron transport chain, lysin and tryptophan catabolism, TCA cycle, and beta-oxidation are shown. The hub genes are underlined and in bold. Created with BioRender.
Figure 7.
Figure 7.. The expression patterns of HOX genes cluster muscles in the same groups.
A) The graph shows the co-expression subnetwork of HOX genes and genes related to anterior/posterior pattern specification assigned to the M.14 module. Diamonds indicate transcription factors while other genes are indicated by circles. Pink and purple nodes represent the hub genes and non-hub genes, respectively. The genes related to anterior/posterior pattern specification have a black border. The edge thickness reflects the degree of topological overlap. Topological overlap is defined as a similarity measure between each pair of genes in relation to all other genes in the network. High topological overlaps indicate that genes share the same neighbors in the co-expression network. (B) Normalized expression of all HOX genes (scaled by row) represented as a heatmap. The hierarchical clustering was generated using the normalized expression values. Each row represents a gene and each column represents a sample. The side color of columns indicates different muscles. The module in which the gene assigned is given between parentheses. Eleven highlighted HOX genes are assigned into muscle-related modules which showed the largest differences between the groups of muscles (M.14, M.30, and M.32).
Figure 8.
Figure 8.. Distinct expression of HOX genes confirmed by RNAscope.
(A) Representative in situ hybridization images of HOXC10 and HOXA10 in cryosections of STM and GL. The image is a merge image of the channels used for laminin, DAPI, HOXC10 and HOXA10 staining. Scale bar is 100 μm. (B) The boxplots show the average number of foci per myofiber (y-axis) in STM and GL muscles (x-axis). (C) The boxplots show the normalized expression of HOXA10 (top) and HOXC10 (bottom) in STM and GL muscles. The boxes reflect the median and interquartile range (N = 12 per muscle). The red dots on the boxes show the mean. **** p-value < 1 × 10⁻⁶ (linear mixed-model).
Figure 8—figure supplement 1.
Figure 8—figure supplement 1.. A representative image of negative control probes in the RNAscope experiment in STM muscle cryosections.
Scale bar is 100 μm.

Update of

References

    1. Abbassi-Daloii T, Kan HE, Raz V, ’t Hoen PAC. Recommendations for the analysis of gene expression data to identify intrinsic differences between similar tissues. Genomics. 2020;112:3157–3165. doi: 10.1016/j.ygeno.2020.05.026. - DOI - PubMed
    1. Abbassi-Daloii T. HumanMuscleTranscriptomeAtlasAnalyses. swh:1:rev:d09eff958b768ded8e39ad6a312063504190bd98Software Heritage. 2023 https://archive.softwareheritage.org/swh:1:dir:4b3aa1c7cf4367c3fcd8ac827...
    1. Abbassi-Daloii T, el Abdellaoui S, Kan HE, van den Akker E, ’t Hoen PAC, Raz V, Voortman LM. Quantitative analysis of myofiber type composition in human and mouse skeletal muscles. STAR Protocols. 2023;4:102075. doi: 10.1016/j.xpro.2023.102075. - DOI - PMC - PubMed
    1. Albayda J, Christopher-Stine L, Iii COB, Paik JJ, Tiniakou E, Billings S, Uy OM, Burlina P. Pattern of muscle involvement in inclusion body myositis: a sonographic study. Clin Exp Rheumatol. 2018;36:996–1002. - PMC - PubMed
    1. Anders S, Pyl PT, Huber W. HTSeq—a python framework to work with high-throughput sequencing data. Bioinformatics. 2015;31:166–169. doi: 10.1093/bioinformatics/btu638. - DOI - PMC - PubMed

Publication types