CrAssphage May Be Viable Markers of Contamination in Pristine and Contaminated River Water
- PMID: 36744944
- PMCID: PMC9948693
- DOI: 10.1128/msystems.01282-22
CrAssphage May Be Viable Markers of Contamination in Pristine and Contaminated River Water
Abstract
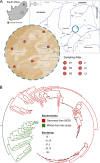
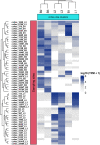
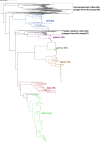
Viruses are the most biologically abundant entities and may be ideal indicators of fecal pollutants in water. Anthropogenic activities have triggered drastic ecosystem changes in rivers, leading to substantial shifts in chemical and biological attributes. Here, we evaluate the viability of using the presence of crAssphage as indicators of fecal contamination in South African rivers. Shotgun analysis revealed diverse crAssphage viruses in these rivers, which are impacted by chemical and biological pollution. Overall, the diversity and relative abundances of these viruses was higher in contaminated sites compared to pristine locations. In contrast to fecal coliform counts, crAssphage sequences were detected in pristine rivers, supporting the assertion that the afore mentioned marker may be a more accurate indicator of fecal contamination. Our data demonstrate the presence of diverse putative hosts which includes members of the phyla Bacteroidota, Pseudomonadota, Verrucomicrobiota, and Bacillota. Phylogenetic analysis revealed novel subfamilies, suggesting that rivers potentially harbor distinct and uncharacterized clades of crAssphage. These data provide the first insights regarding the diversity, distribution, and functional roles of crAssphage in rivers. Taken together, the results support the potential application of crAssphage as viable markers for water quality monitoring. IMPORTANCE Rivers support substantial populations and provide important ecosystem services. Despite the application of fecal coliform tests and other markers, we lack rapid and reproducible approaches for determining fecal contamination in rivers. Waterborne viral outbreaks have been reported even after fecal indicator bacteria (FIB) were suggested to be absent or below regulated levels of coliforms. This indicates a need to develop and apply improved indicators of pollutants in aquatic ecosystems. Here, we evaluate the viability of crAssphage as indicators of fecal contamination in two South African rivers. We assess the abundance, distribution, and diversity of these viruses in sites that had been predicted pristine or contaminated by FIB analysis. We show that crAssphage are ideal and sensitive markers for fecal contamination and describe novel clades of crAss-like phages. Known crAss-like subfamilies were unrepresented in our data, suggesting that the diversity of these viruses may reflect geographic locality and dependence.
Keywords: bacteria; bacteriophages; crAssphage; faecal pollution; metagenome assembled genomes; phylogeny; viruses.
Figures


References
-
- Magana-Arachchi DN, Wanigatunge RP. 2020. Ubiquitous waterborne pathogens, p 15–42. In Prasad MN, Grobelak A (ed), Waterborne pathogens detection and determination. Butterworth-Heinemann, Oxford. doi: 10.1016/B978-0-12-818783-8.00002-5. - DOI
-
- Edokpayi JN, Odiyo JO, Durowoju OS. 2017. Impact of wastewater on surface water quality in developing countries: a case study of South Africa, p 401–416. In Tutu H (ed), Water quality. TechOpen, London.
-
- Bartram J, Fewtrell L. 2001. Water quality: guidelines, standards and health: assessment of risk and risk management for water-related infectious disease. IWA.
Publication types
MeSH terms
Associated data
LinkOut - more resources
Full Text Sources

