. 2023 Mar 1;13(3):672-701.
doi: 10.1158/2159-8290.CD-22-0244.

Discovery of Targets for Immune-Metabolic Antitumor Drugs Identifies Estrogen-Related Receptor Alpha

Affiliations

Discovery of Targets for Immune-Metabolic Antitumor Drugs Identifies Estrogen-Related Receptor Alpha

Avinash Sahu et al. Cancer Discov. .

Abstract

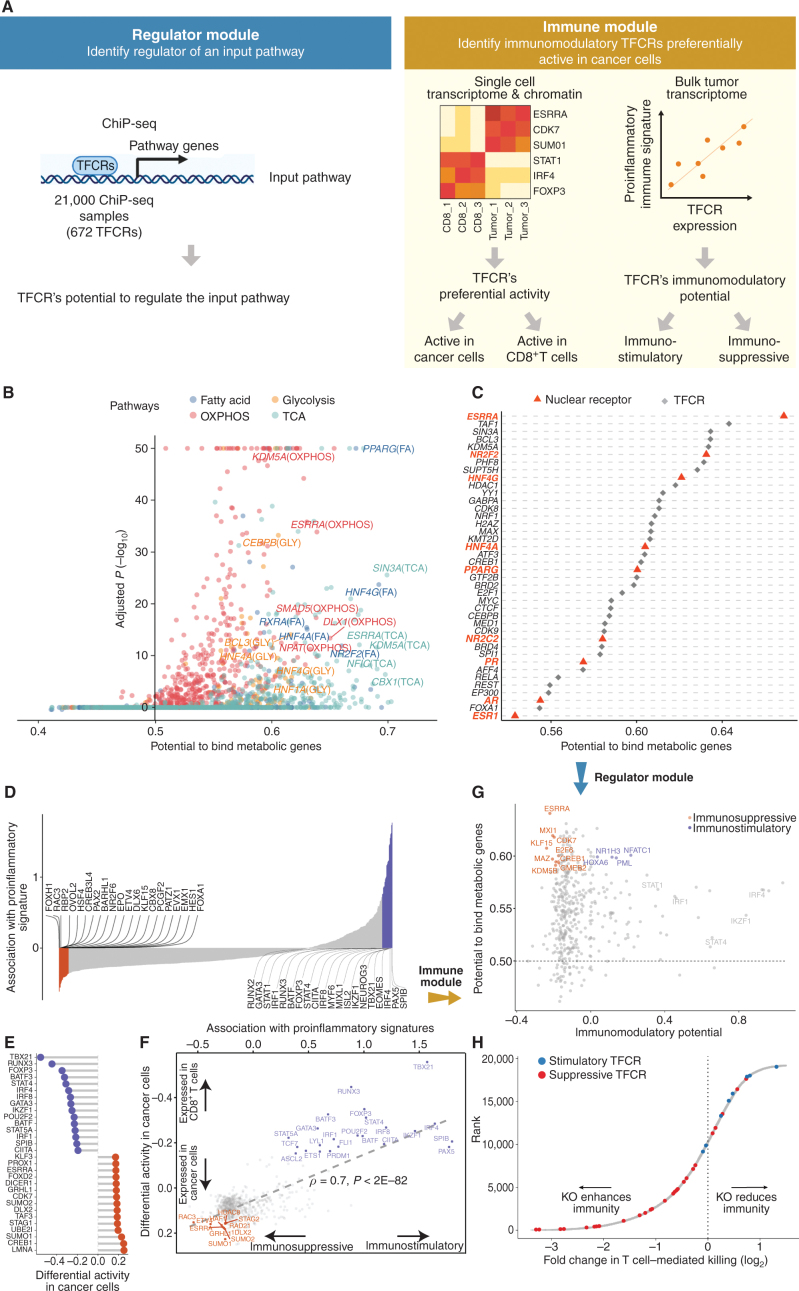
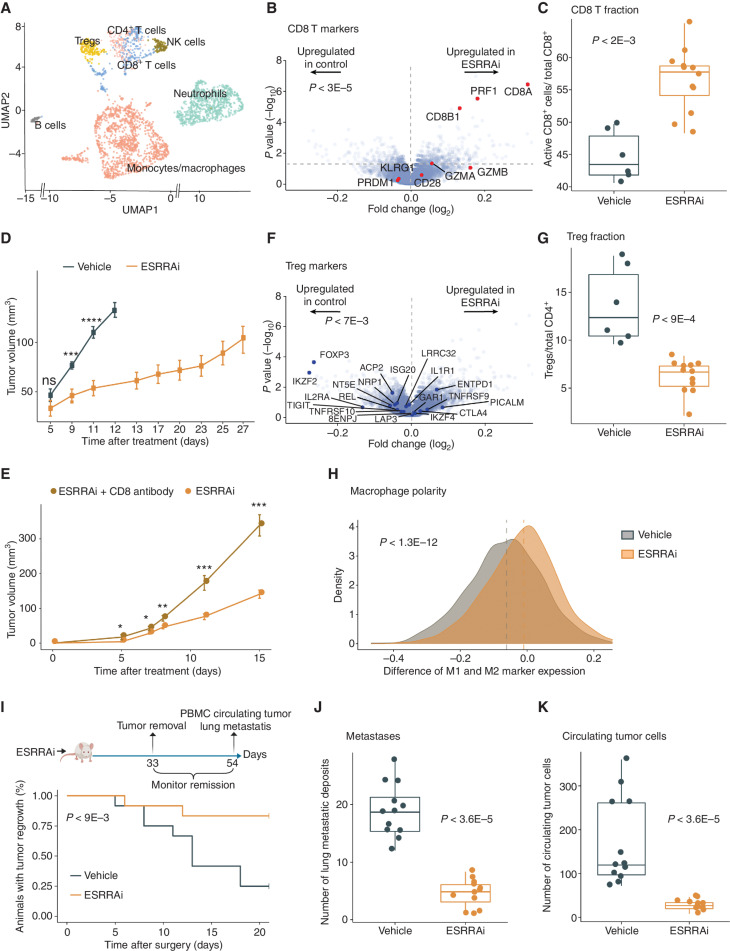
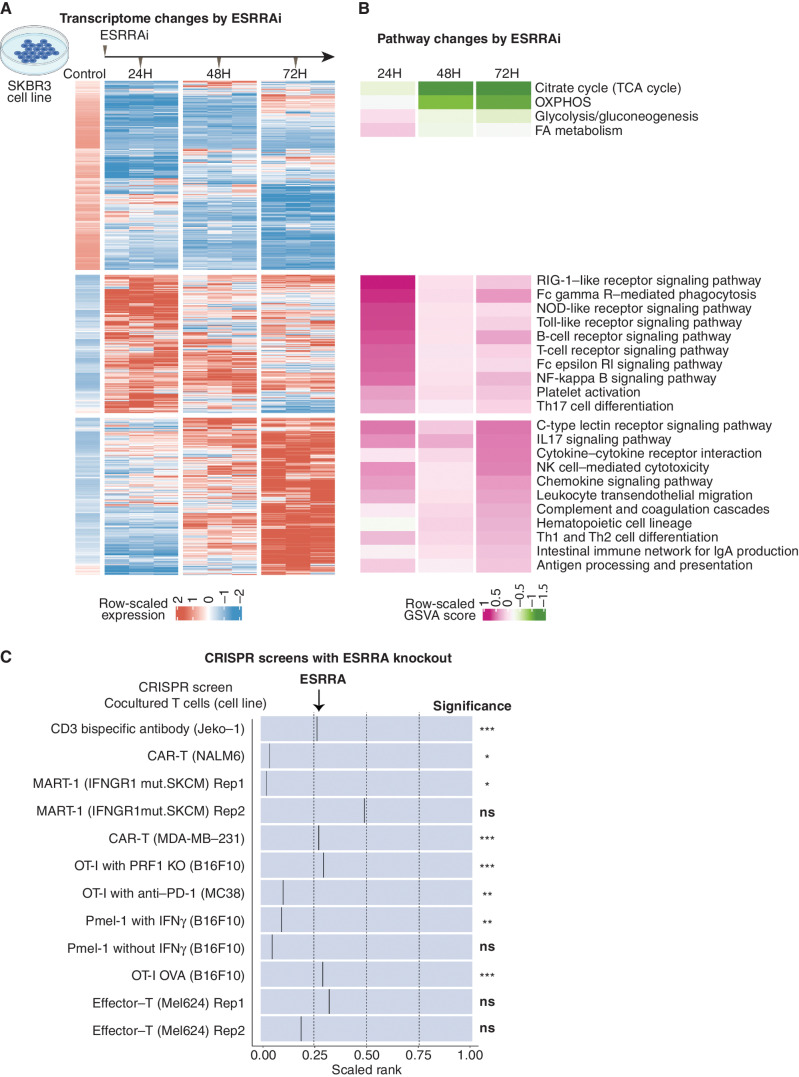
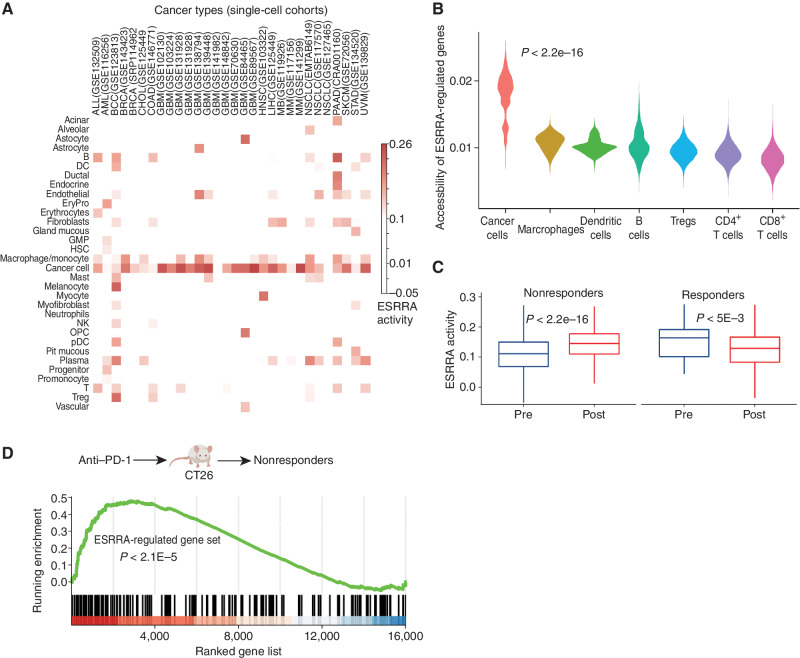
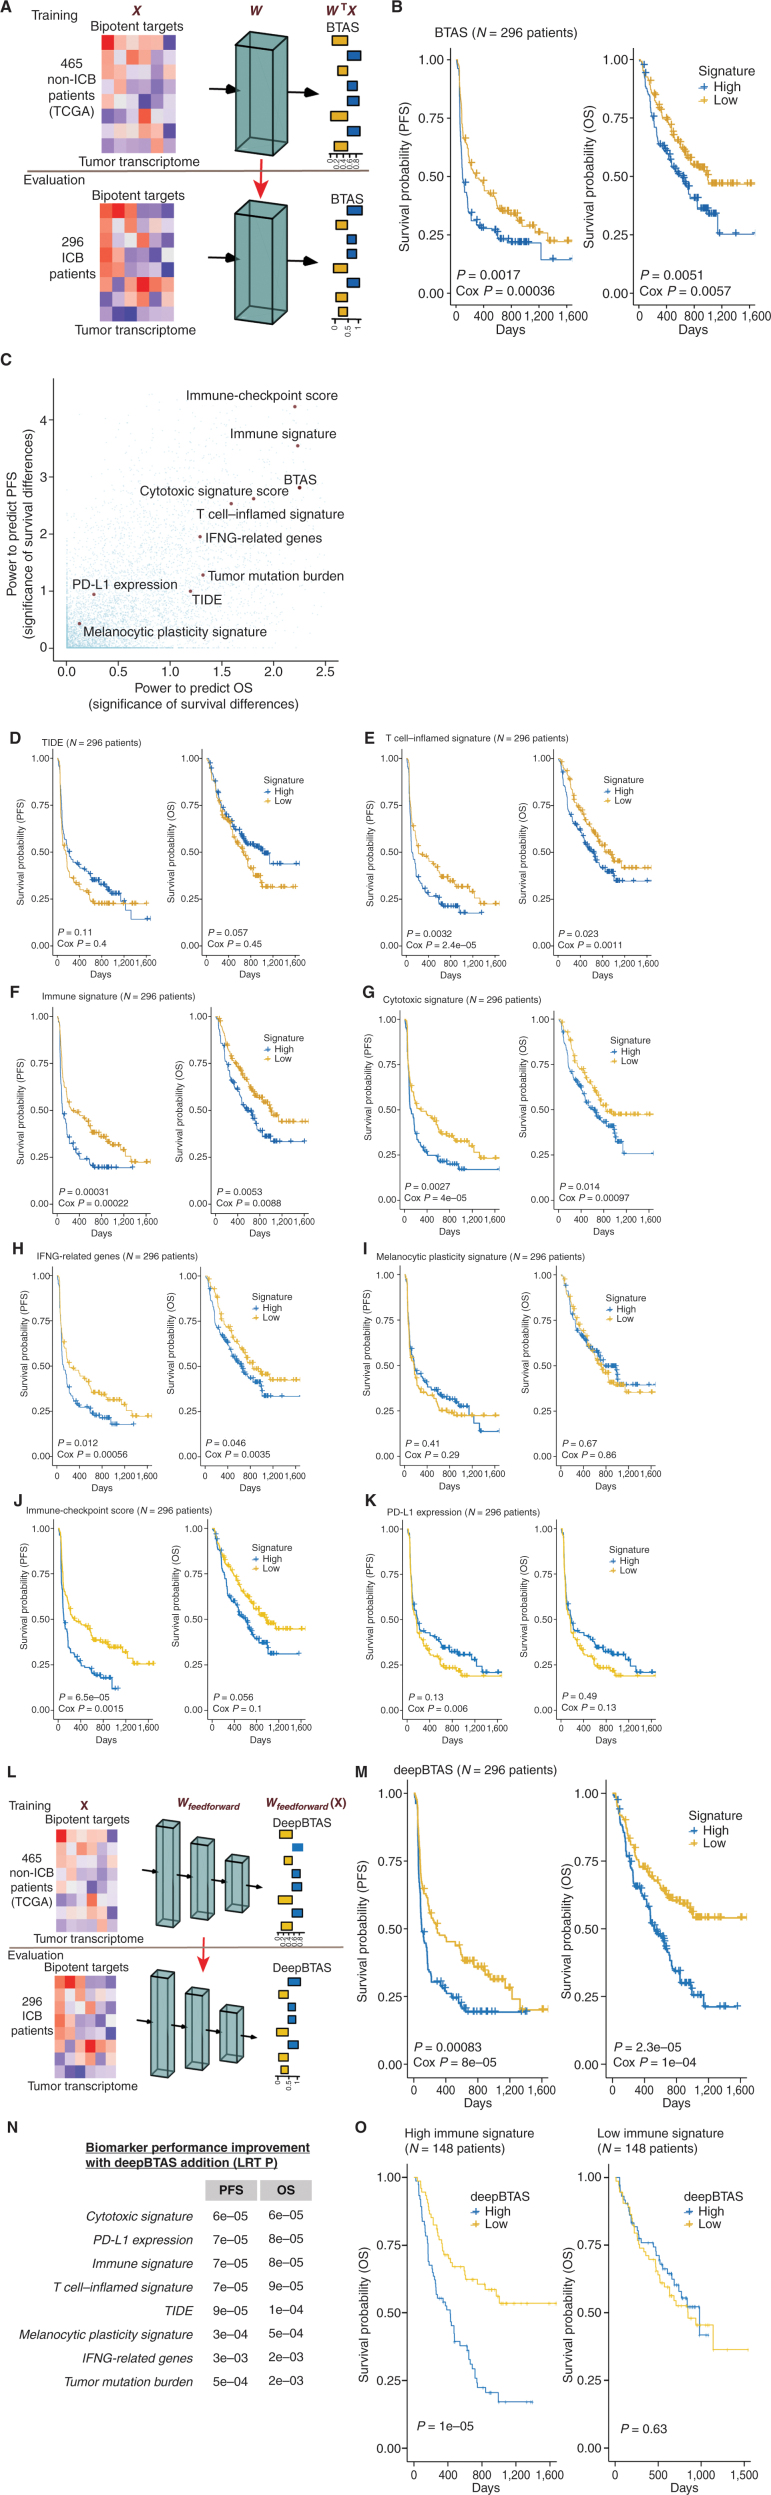
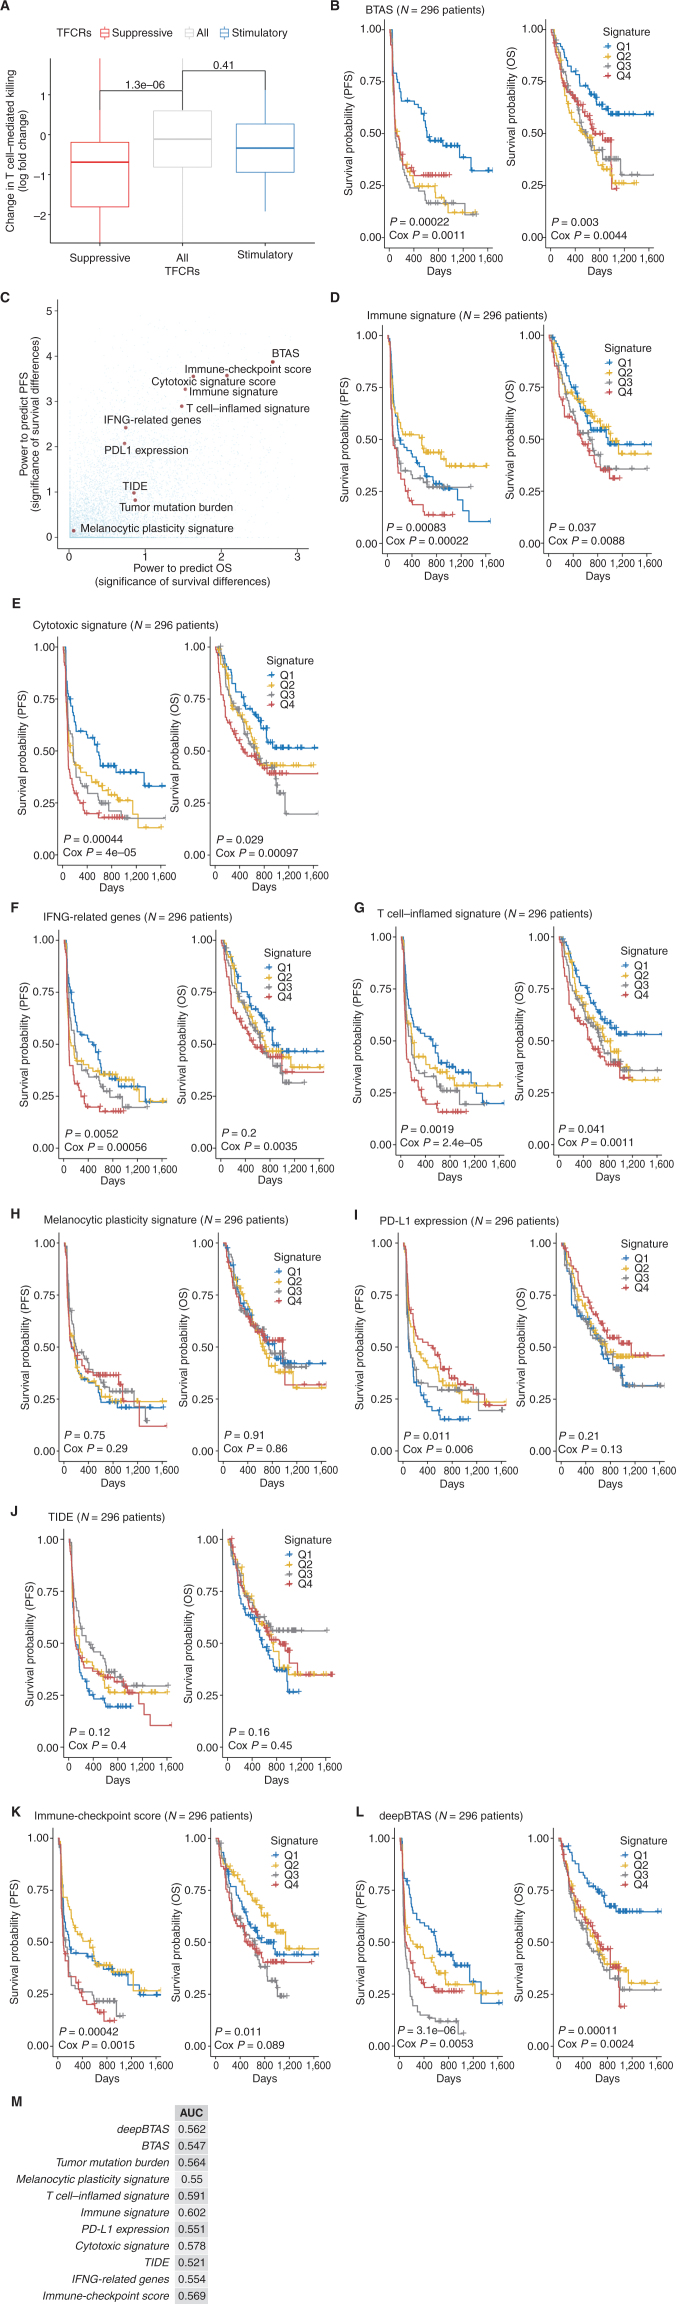
Drugs that kill tumors through multiple mechanisms have the potential for broad clinical benefits. Here, we first developed an in silico multiomics approach (BipotentR) to find cancer cell-specific regulators that simultaneously modulate tumor immunity and another oncogenic pathway and then used it to identify 38 candidate immune-metabolic regulators. We show the tumor activities of these regulators stratify patients with melanoma by their response to anti-PD-1 using machine learning and deep neural approaches, which improve the predictive power of current biomarkers. The topmost identified regulator, ESRRA, is activated in immunotherapy-resistant tumors. Its inhibition killed tumors by suppressing energy metabolism and activating two immune mechanisms: (i) cytokine induction, causing proinflammatory macrophage polarization, and (ii) antigen-presentation stimulation, recruiting CD8+ T cells into tumors. We also demonstrate a wide utility of BipotentR by applying it to angiogenesis and growth suppressor evasion pathways. BipotentR (http://bipotentr.dfci.harvard.edu/) provides a resource for evaluating patient response and discovering drug targets that act simultaneously through multiple mechanisms.

Significance: BipotentR presents resources for evaluating patient response and identifying targets for drugs that can kill tumors through multiple mechanisms concurrently. Inhibition of the topmost candidate target killed tumors by suppressing energy metabolism and effects on two immune mechanisms. This article is highlighted in the In This Issue feature, p. 517.


Figures

Figure 1. Identification of immune-metabolic regulators. Abbreviations: TFCR, transcription factor and chromatin regulator; RP, regulatory potential of TFCR; TCA, tricarboxylic acid cycle; OXPHOS, oxidative phosphorylation. A, Overall schematic of regulation and immune modules of BipotentR. The regulator module identifies regulators of an input pathway using ChIP-seq data. The immune module identifies TFCRs that show immunostimulatory or immunosuppressive properties in bulk tumor transcriptomes, and are preferentially active in cancer cells (using single-cell tumor transcriptomes). B, Output of BipotentR regulator module. Potential and significance of regulators to bind cis-regulatory elements of genes in four energy metabolism pathways. Each dot indicates a regulator, colored by individual pathways. C, The potential of top predicted master regulators to bind energy metabolism genes. Nuclear receptors are displayed in red. D, TFCRs with positive (or negative) associations with proinflammatory signatures are predicted immunostimulators (purple; or immunosuppressors, orange). E, Top TFCRs predicted to be preferentially active in cancer cells (orange; or CD8+ T cells, purple) and their differential activity (estimated from single-cell data). F, Output of BipotentR immune module: combined association with proinflammatory signatures (D, estimate from bulk RNA-seq) and differential activity in cancer cells (E, estimate from single-cell data) are displayed for each TFCR. G, Immune-metabolic regulators identified by BipotentR. Energy regulatory potentials (estimated by regulator module) and immune-modulatory potentials (estimated by immune module) of TFCRs. Highlighted TFCRs are significant and among the top 15% in both modules. Immunostimulators (purple) and immunosuppressors (orange) are colored. H, Validation of BipotentR-identified targets. Effect of knockout of target identified by BipotentR on T-cell–mediated killing of cancer cells.
Figure 1.
Identification of immune–metabolic regulators. A, Overall schematic of regulation and immune modules of BipotentR. The regulator module identifies regulators of an input pathway using ChIP-seq data. The immune module identifies TFCRs that show immunostimulatory or immunosuppressive properties in bulk tumor transcriptomes and are preferentially active in cancer cells (using single-cell tumor transcriptomes). B, Output of BipotentR regulator module. Potential and significance of regulators to bind cis-regulatory elements of genes in four energy metabolism pathways. Each dot indicates a regulator, colored by individual pathways. OXPHOS, oxidative phosphorylation; TCA, tricarboxylic acid cycle. C, The potential of top predicted master regulators to bind energy metabolism genes. Nuclear receptors are displayed in red. D, TFCRs with positive (or negative) associations with proinflammatory signatures are predicted immunostimulators (purple; or immunosuppressors, orange). E, Top TFCRs predicted to be preferentially active in cancer cells (orange; or CD8+ T cells, purple) and their differential activity (estimated from single-cell data). F, Output of BipotentR immune module: combined association with proinflammatory signatures (D, estimate from bulk RNA-seq) and differential activity in cancer cells (E, estimate from single-cell data) are displayed for each TFCR. G, Immune–metabolic regulators identified by BipotentR. Energy regulatory potential (estimated by regulator module) and immune-modulatory potential (estimated by immune module) of TFCRs. Highlighted TFCRs are significant and among the top 15% in both modules. Immunostimulators (purple) and immunosuppressors (orange) are colored. H, Validation of BipotentR-identified targets. Effect of knockout (KO) of target identified by BipotentR on T cell–mediated killing of cancer cells.
Figure 2. ESRRA inhibition activates antitumor immunity in 4T1 mice. P values using Wilcoxon rank-sum test unless stated otherwise. Tregs, regulatory T cells; ESRRAi, ESRRA inhibitor. A, UMAP display of scRNA-seq of tumor-infiltrating CD45+ cells from ESRRAi and vehicle-treated mice. B, Markers of activated CD8+ T cells in genes differential expressed by ESRRAi in lymphoid cells from treated mice. Significance of up/downregulation of marker sets estimated using permutation tests. C, Fractions of CD8+ T cells identified by flow cytometry. D, Tumor volume comparisons between ESRRAi and control. E, Tumor volume comparisons between ESRRAi with and without CD8 antibody. F, Markers of Tregs in genes differential expressed by ESRRAi in lymphoid cells from treated mice. Significance of up/downregulation of marker sets estimated using permutation tests. G, Fractions of Tregs identified by flow cytometry. H, Densities of macrophage polarization toward M1 (i.e., for each macrophage cell, macrophage polarization = average expression of M1 markers − average expression M2 markers), also see Supplementary Fig. S2O and S2P. I–K, Measurements done after tumors were surgically removed in ESRRAi or vehicle-treated mice comparing: tumor regrowth rate (i.e., 1—relapse rate; I), lung metastasis deposits (J), circulating tumor cells in the blood (K).
Figure 2.
ESRRA inhibition activates antitumor immunity in 4T1 mice. P values using Wilcoxon rank-sum test unless stated otherwise. A, Uniform manifold approximation and projection (UMAP) display of scRNA-seq of tumor-infiltrating CD45+ cells from ESRRAi- and vehicle-treated mice. NK, natural killer; Treg, regulatory T cell. B, Markers of activated CD8+ T cells in genes differentially expressed by ESRRAi in lymphoid cells from treated mice. Significance of up/downregulation of marker sets estimated using permutation tests. C, Fraction of CD8+ T cells identified by flow cytometry. D, Tumor volume comparisons between ESRRAi and control. E, Tumor volume comparisons between ESRRAi with and without CD8 antibody. F, Markers of Tregs in genes differentially expressed by ESRRAi in lymphoid cells from treated mice. Significance of up/downregulation of marker sets estimated using permutation tests. G, Fraction of Tregs identified by flow cytometry. H, Densities of macrophage polarization toward M1 (i.e., for each macrophage cell, macrophage polarization = average expression of M1 markers − average expression M2 markers); see also Supplementary Fig. S2O and S2P. I–K, Measurements done after tumors were surgically removed in ESRRAi- or vehicle-treated mice comparing tumor regrowth rate (i.e., 1—relapse rate; I), lung metastasis deposits (J), circulating tumor cells in the blood (K). PBMC, peripheral blood mononuclear cell. *, P < 0.05; **, 0.05 < P < 0.01; ***, P < 0.001; ns, P > 0.05.
Figure 3. Signaling induced by ESRRAi in vitro. Abbreviations: GSVA, gene set variation analysis. A, DEGs between ESRRAi and control in the SKBR3 cell line at three-time points. Genes were clustered by K-means. B, Pathway enrichment scores corresponding to clusters of DEGs shown in A. C, ESRRA knockout potentiates T-cell killing as observed in CRISPR knockout screens in cancer cells cocultured with T cells. The black line represents the relative position of ESRRA knockout among all gene knockouts ranked from most depleted to least depleted. The significance of ESRRA knockout in screens is also displayed.
Figure 3.
Signaling induced by ESRRAi in vitro.A, Differentially expressed genes (DEG) between ESRRAi and control in the SKBR3 cell line at three time points. Genes were clustered by K-means. B, Pathway enrichment scores corresponding to clusters of DEGs shown in A. GSVA, gene set variation analysis. C, ESRRA knockout potentiates T-cell killing as observed in CRISPR knockout screens in cancer cells cocultured with T cells. The black line represents the relative position of ESRRA knockout among all gene knockouts ranked from most depleted to least depleted. The significance of ESRRA knockout in screens is also displayed. KO, knockout; SKCM, skin cutaneous melanoma. *, P < 0.05; **, 0.05 < P < 0.01; ***, P < 0.001; ns, P > 0.05.
Figure 4. ESRRA is activated in immunotherapy-resistant tumors and its inhibition does not adversely affect CD8+ T cells. Abbreviations: CTL, cytotoxic T cell; MDSC, myeloid-derived suppressor cells; P values estimated by the Wilcoxon rank-sum test. A, ESRRA activity in cancer and immune cells from 30 scRNA-seq cohorts. B, The chromatin accessibility of ESRRA targets in different cell types from scATAC-seq data of a skin cancer cohort. C, Cancer cell ESRRA activity in patient (skin cancer) tumors with pre- and post- anti–PD-1 treatment for responders and nonresponders. D, Enrichment analysis of ESRRA-regulated gene set in nonresponding CT26 mice after anti–PD-1 treatment.
Figure 4.
ESRRA is activated in immunotherapy-resistant tumors and its inhibition does not adversely affect CD8+ T cells. P values estimated by the Wilcoxon rank-sum test. A, ESRRA activity in cancer and immune cells from 30 scRNA-seq cohorts. ALL, acute lymphoblastic leukemia; AML, acute myeloid leukemia; BCC, basal cell carcinoma; BRCA, breast cancer; COAD, colon adenocarcinoma; CHOL, cholangiocarcinoma; DC, dendritic cell; EryPro, erythroid progenitor cell; GBM, glioblastoma multiforme; GMP, granulocyte-macrophage progenitor; HNSC, head and neck squamous cell carcinoma; LIHC, liver hepatocellular carcinoma; MB, medulloblastoma; MM, multiple myeloma; NK, natural killer; NSCLC, non–small cell lung cancer; OPC, oligodendrocyte precursor cell; PAAD, pancreatic adenocarcinoma; pDC, plasmacytoid dendritic cell; SKCM, skin cutaneous melanoma; STAD, stomach adenocarcinoma; UVM, uveal melanoma. B, The chromatin accessibility of ESRRA targets in different cell types from scATAC-seq data of a skin cancer cohort. C, Cancer cell ESRRA activity in patient (skin cancer) tumors with pre– and post–anti–PD-1 treatment for responders and nonresponders. D, Enrichment analysis of an ESRRA-regulated gene set in nonresponding CT26 mice after anti–PD-1 treatment.
Figure 5. Machine learning evaluation of immune-metabolic targets in predicting patient response to anti–PD-1. Abbreviations: PFS, progression-free survival; OS, overall survival differences. A, Overview of the estimation of bipotent target activity score in tumors using a linear function (BTAS). B, Kaplan–Meier plots showing PFS and OS differences for patients receiving anti–PD-1 between the low-risk and high-risk groups defined by the median value of BTAS. C, Survival stratification performance of BTAS score versus seven other previously published ICB biomarkers for melanoma patients receiving ICB. Significance of survival was estimated using log-rank P value (−log10). D–K, Kaplan–Meier plots similar to B with the low-risk and high-risk groups defined by the median value of the signatures. Signatures displayed are: (D) TIDE (97), (E) T-cell inflamed (96), (F) immune (90), (G) cytotoxic (91), (H) IFNG (92), (I) melanocytic plasticity (98), (J) immune checkpoint, and (K) PD-L1 expression (96). L, Overview of the estimation of bipotent target activity score in tumors using a nonlinear function (deepBTAS). M, Kaplan–Meier plots similar to B with the low-risk and high-risk groups defined by the median deepBTAS. N, Performance improvement (OS and PFS) with the addition of deepBTAS to biomarkers (rows). An improvement quantified as (P value of) increase in the likelihood of multivariate model containing a biomarker and deepBTAS over a model containing the biomarker alone. O, Kaplan–Meier plots similar to M done separately on tumors with high (top) and low (bottom) immune signature.
Figure 5.
Machine learning evaluation of immune–metabolic targets in predicting patient response to anti–PD-1. A, Overview of the estimation of bipotent target activity score in tumors using a linear function (BTAS). B, Kaplan–Meier plots showing PFS and OS differences for patients receiving anti–PD-1 between the low-risk and high-risk groups defined by the median value of BTAS. C, Survival stratification performance of BTAS versus seven other previously published ICB biomarkers for patients with melanoma receiving ICB. Significance of survival was estimated using log-rank P value (−log10). D–K, Kaplan–Meier plots similar to B, with the low-risk and high-risk groups defined by the median value of the signatures. Signatures displayed are TIDE (D; ref. 97), T-cell inflamed (E; ref. 96), immune (F; ref. 90), cytotoxic (G; ref. 91), IFNG (H; ref. 92), melanocytic plasticity (I; ref. 98), immune checkpoint (J), and PD-L1 expression (K; ref. 96). L, Overview of the estimation of BTAS in tumors using a nonlinear function (deepBTAS). M, Kaplan–Meier plots similar to B with the low-risk and high-risk groups defined by the median deepBTAS. N, Performance improvement (OS and PFS) with the addition of deepBTAS to biomarkers (rows). An improvement quantified as (P value of) increase in the likelihood of multivariate model containing a biomarker and deepBTAS over a model containing the biomarker alone. LRT P, P value from likelihood ratio test. O, Kaplan–Meier plots similar to M done separately on tumors with high (left) and low (right) immune signature.
Figure 6. Evaluation of bipotent regulators of angiogenesis or growth suppressor. A, Effect of knockout of 28 bipotent targets on T-cell mediated killing of cancer cells. B–M, Performance of BTAS and deepBTAS versus other previously published ICB biomarkers: C, Survival stratification performance of BTAS score versus other ICB biomarkers. Significance of survival was estimated using log-rank P value (−log10). Kaplan–Meier plots show progression-free survival and overall survival between the four equal quartiles of risk groups divided based on signatures: (B) BTAS, (D) immune (90), (E) cytotoxic (91), (F) IFNG (92), (G) T-cell inflamed (96), (H) melanocytic plasticity (98), (I) PD-L1 (96), (J) TIDE (97), (K) immune checkpoint, and (L) deepBTAS. M, Performance evaluation of ICB biomarkers in terms of area under the curve (AUC).
Figure 6.
Evaluation of bipotent regulators of angiogenesis or growth suppressor evasion. A, Effect of knockout of 28 bipotent targets on T cell–mediated killing of cancer cells. B–M, Performance of BTAS and deepBTAS versus other previously published ICB biomarkers. C, Survival stratification performance of BTAS score versus other ICB biomarkers. Significance of survival was estimated using log-rank P value (−log10). B, D, and E, Kaplan–Meier plots show PFS and OS between the four equal quartiles of risk groups divided based on the following signatures: BTAS (B), immune (D; ref. 90), and cytotoxic (E; ref. 91). F–J, Kaplan–Meier plots show PFS and OS between the four equal quartiles of risk groups divided based on the following signatures: IFNG (F; ref. 92), T-cell inflamed (G; ref. 96), melanocytic plasticity (H; ref. 98), PD-L1 (I; ref. 96), and TIDE (J; ref. 97). K and L, Kaplan–Meier plots show PFS and OS between the four equal quartiles of risk groups divided based on the following signatures: immune checkpoint (K) and deepBTAS (L). M, Performance evaluation of ICB biomarkers in terms of AUC.

Comment in

  • 2159-8274. doi: 10.1158/2159-8290.CD-13-3-ITI

References

    1. Wang C, Vegna S, Jin H, Benedict B, Lieftink C, Ramirez C, et al. . Inducing and exploiting vulnerabilities for the treatment of liver cancer. Nature 2019;574:268–72. - PMC - PubMed
    1. Palmer AC, Sorger PK. Combination cancer therapy can confer benefit via patient-to-patient variability without drug additivity or synergy. Cell 2017;171:1678–91. - PMC - PubMed
    1. Benesic A, Jalal K, Gerbes AL. Drug-drug combinations can enhance toxicity as shown by monocyte-derived hepatocyte-like cells from patients with idiosyncratic drug-induced liver injury. Toxicol Sci 2019;171:296–302. - PubMed
    1. Nahar KJ, Rawson RV, Ahmed T, Tattersall S, Sandanayake N, Kiely CJ, et al. . Clinicopathological characteristics and management of colitis with anti–PD-1 immunotherapy alone or in combination with ipilimumab. J Immunother Cancer 2020;8:e001488. - PMC - PubMed
    1. Petroni G, Formenti SC, Chen-Kiang S, Galluzzi L. Immunomodulation by anticancer cell cycle inhibitors. Nat Rev Immunol 2020;20:669–79. - PMC - PubMed

Publication types