

Recalibrating prognostic models to improve predictions of in-hospital child mortality in resource-limited settings
- PMID: 36745113
- PMCID: PMC10946771
- DOI: 10.1111/ppe.12948
Recalibrating prognostic models to improve predictions of in-hospital child mortality in resource-limited settings
Abstract
Background: In an external validation study, model recalibration is suggested once there is evidence of poor model calibration but with acceptable discriminatory abilities. We identified four models, namely RISC-Malawi (Respiratory Index of Severity in Children) developed in Malawi, and three other predictive models developed in Uganda by Lowlaavar et al. (2016). These prognostic models exhibited poor calibration performance in the recent external validation study, hence the need for recalibration.
Objective: In this study, we aim to recalibrate these models using regression coefficients updating strategy and determine how much their performances improve.
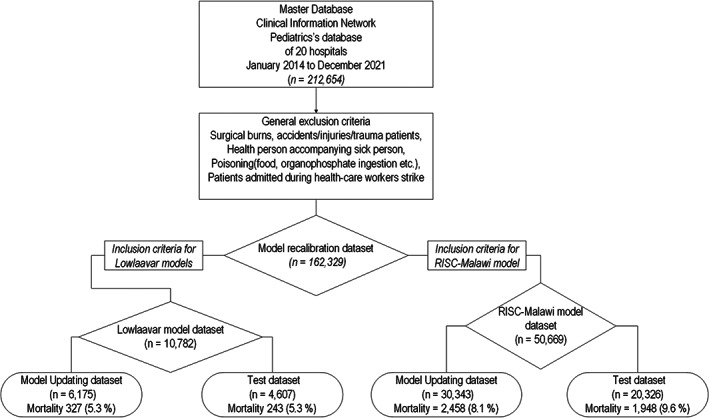
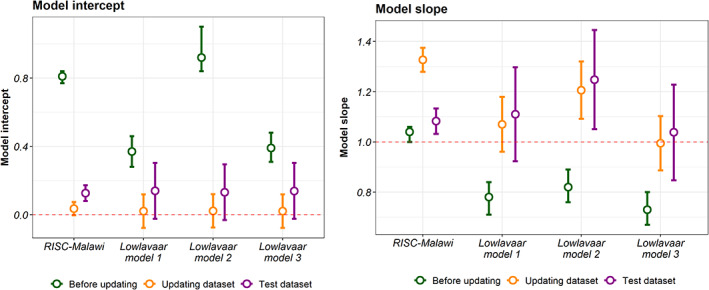
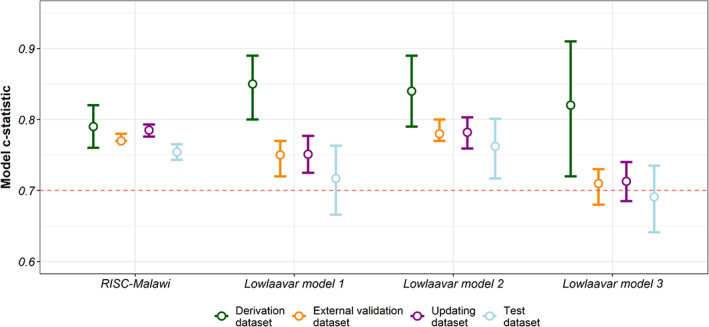
Methods: We used data collected by the Clinical Information Network from paediatric wards of 20 public county referral hospitals. Missing data were multiply imputed using chained equations. Model updating entailed adjustment of the model's calibration performance while the discriminatory ability remained unaltered. We used two strategies to adjust the model: intercept-only and the logistic recalibration method.
Results: Eligibility criteria for the RISC-Malawi model were met in 50,669 patients, split into two sets: a model-recalibrating set (n = 30,343) and a test set (n = 20,326). For the Lowlaavar models, 10,782 patients met the eligibility criteria, of whom 6175 were used to recalibrate the models and 4607 were used to test the performance of the adjusted model. The intercept of the recalibrated RISC-Malawi model was 0.12 (95% CI 0.07, 0.17), while the slope of the same model was 1.08 (95% CI 1.03, 1.13). The performance of the recalibrated models on the test set suggested that no model met the threshold of a perfectly calibrated model, which includes a calibration slope of 1 and a calibration-in-the-large/intercept of 0.
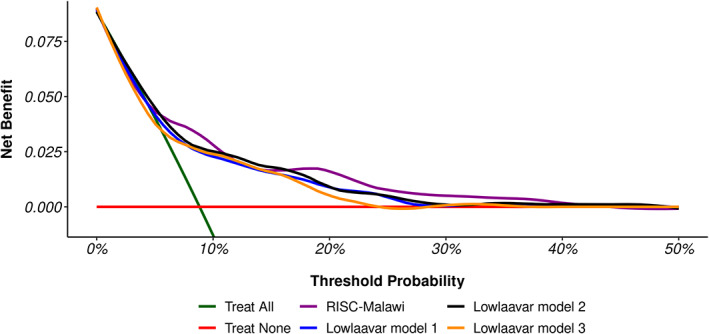
Conclusions: Even after model adjustment, the calibration performances of the 4 models did not meet the recommended threshold for perfect calibration. This finding is suggestive of models over/underestimating the predicted risk of in-hospital mortality, potentially harmful clinically. Therefore, researchers may consider other alternatives, such as ensemble techniques to combine these models into a meta-model to improve out-of-sample predictive performance.
Keywords: model recalibration; paediatric mortality; prediction.
© 2023 The Authors. Paediatric and Perinatal Epidemiology published by John Wiley & Sons Ltd.
Figures
References
-
- Kwakkel G, Wagenaar RC, Kollen BJ, et al. Predicting disability in stroke—a critical review of the literature. Age Ageing. 1996;25(6):479‐489. - PubMed
Publication types
MeSH terms
Grants and funding
LinkOut - more resources
Full Text Sources
Miscellaneous
