. 2023 Aug;16(4):862-873.
doi: 10.1007/s12265-022-10350-w. Epub 2023 Feb 6.

Aortic Stenosis: Haemodynamic Benchmark and Metric Reliability Study

Affiliations

Aortic Stenosis: Haemodynamic Benchmark and Metric Reliability Study

Harminder Gill et al. J Cardiovasc Transl Res. 2023 Aug.

Abstract

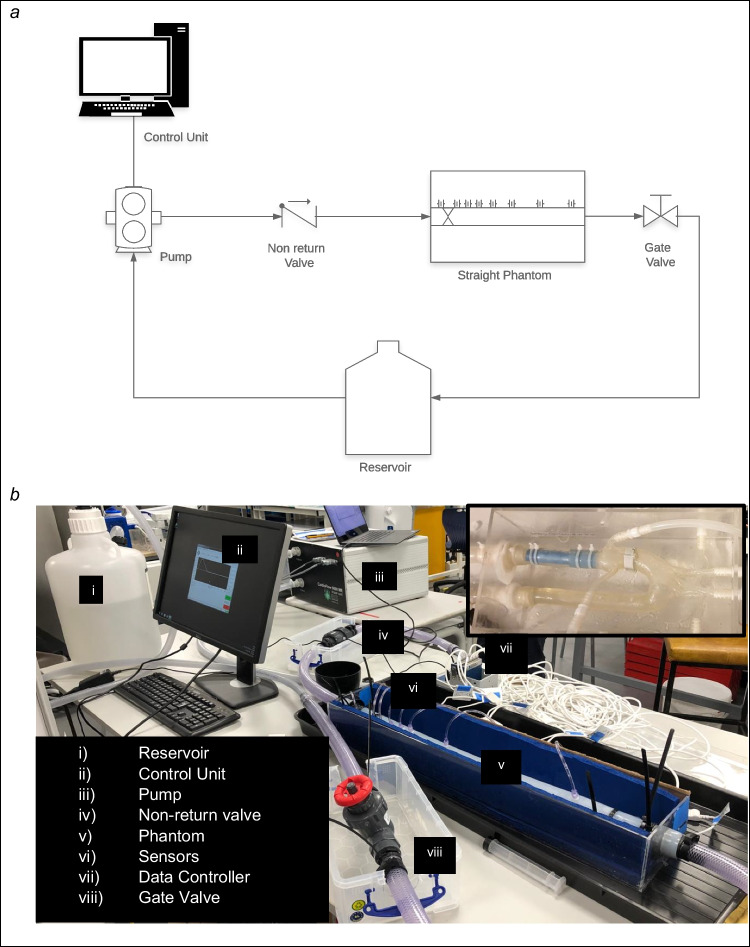
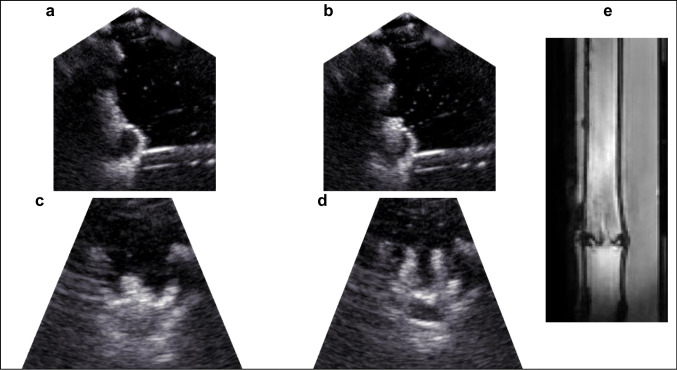
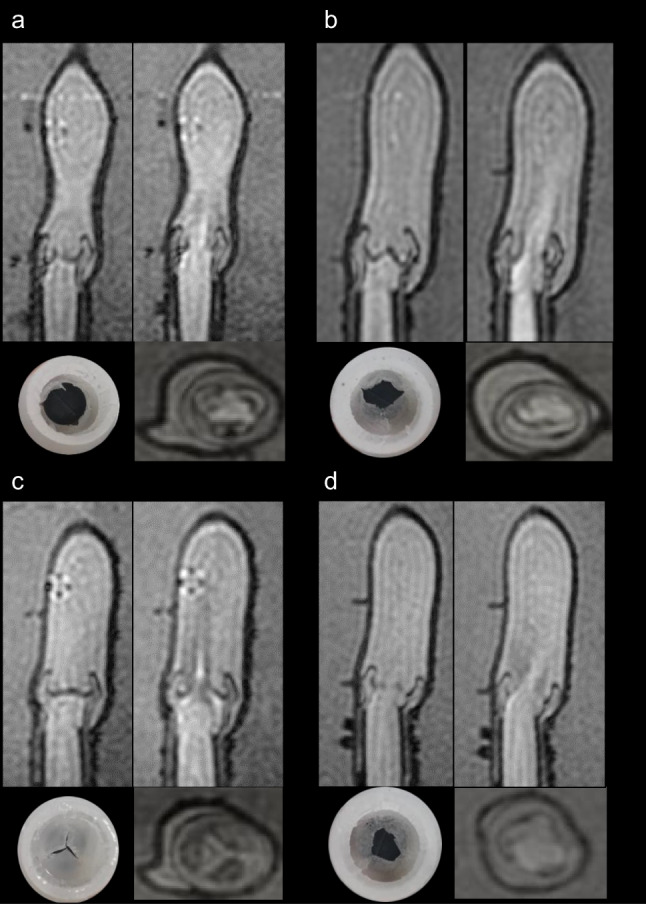
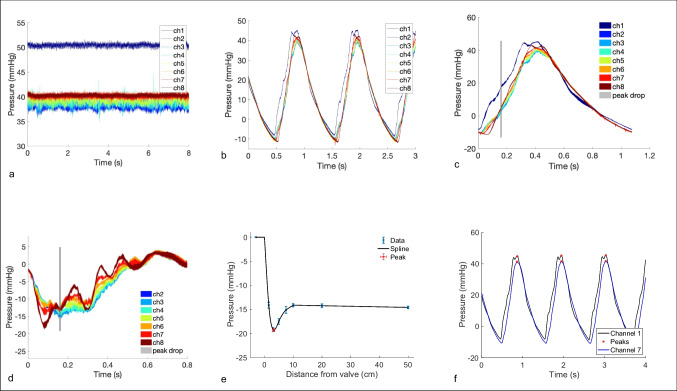
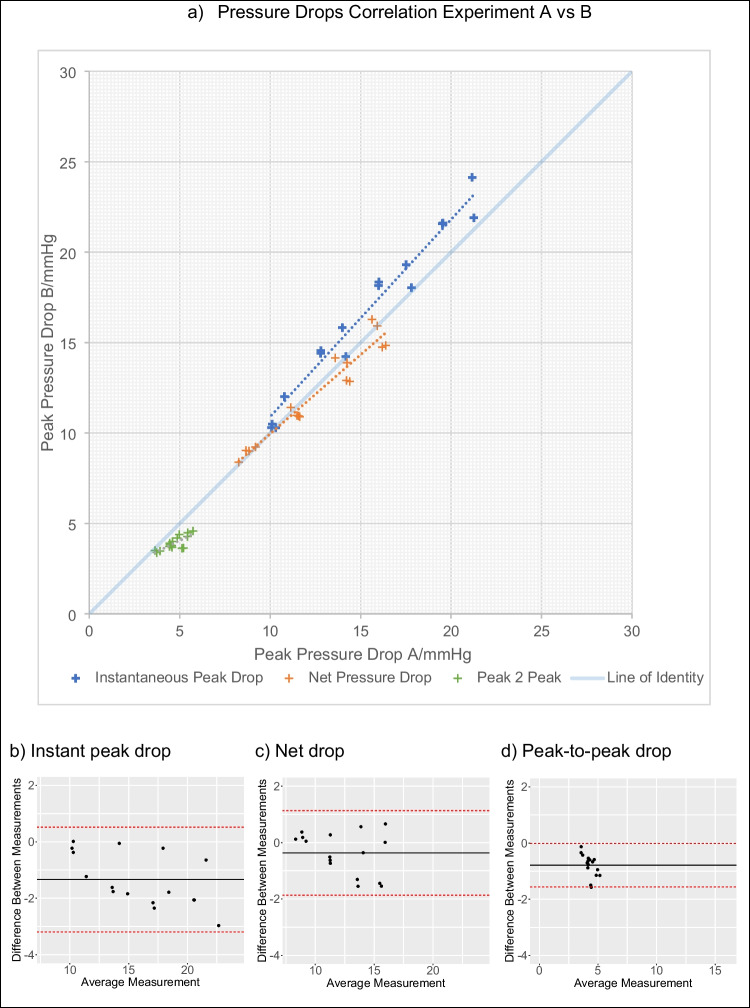
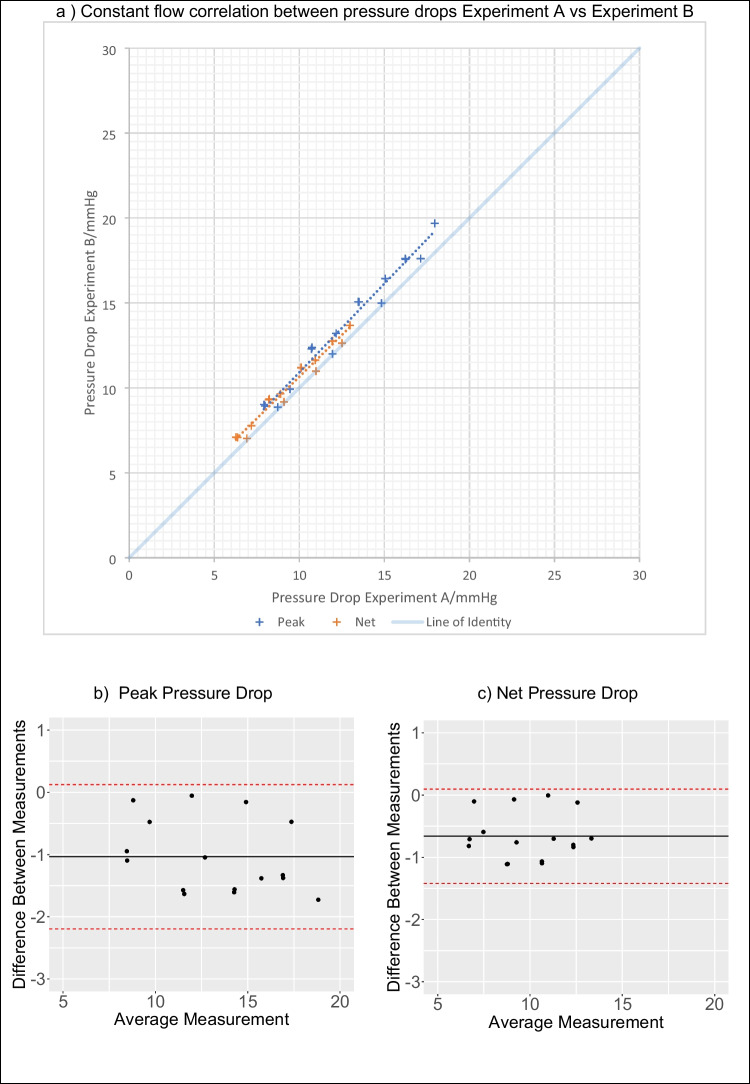
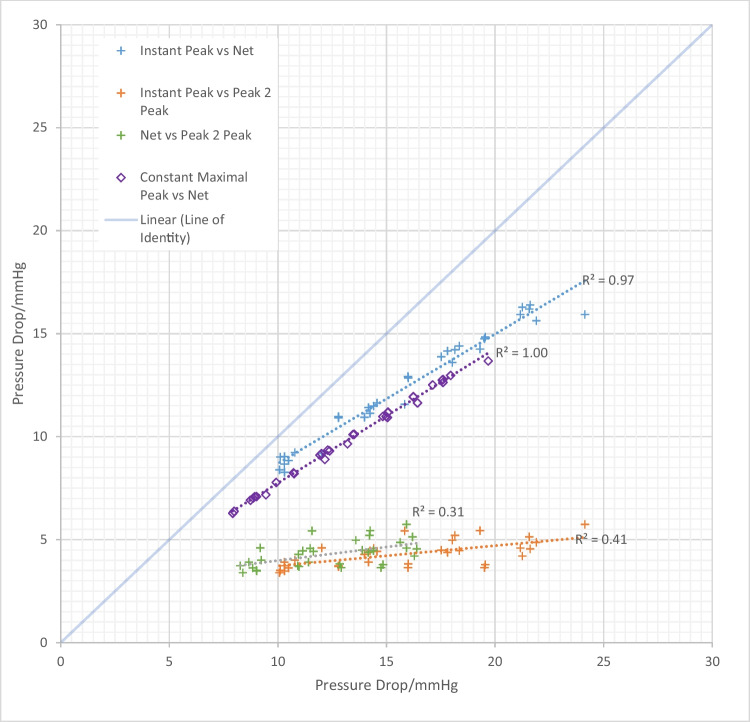
Aortic stenosis is a condition which is fatal if left untreated. Novel quantitative imaging techniques which better characterise transvalvular pressure drops are being developed but require refinement and validation. A customisable and cost-effective workbench valve phantom circuit capable of replicating valve mechanics and pathology was created. The reproducibility and relationship of differing haemodynamic metrics were assessed from ground truth pressure data alongside imaging compatibility. The phantom met the requirements to capture ground truth pressure data alongside ultrasound and magnetic resonance image compatibility. The reproducibility was successfully tested. The robustness of three different pressure drop metrics was assessed: whilst the peak and net pressure drops provide a robust assessment of the stenotic burden in our phantom, the peak-to-peak pressure drop is a metric that is confounded by non-valvular factors such as wave reflection. The peak-to-peak pressure drop is a metric that should be reconsidered in clinical practice. The left panel shows manufacture of low cost, functional valves. The central section demonstrates circuit layout, representative MRI and US images alongside gross valve morphologies. The right panel shows the different pressure drop metrics that were assessed for reproducibility.

Keywords: 3D printing; Aortic stenosis; Aortic valve; Haemodynamics.


Conflict of interest statement

The authors declare no competing interests.

Figures

Fig. 1
Fig. 1
Schematic diagram of the phantom circuits and set-up. Panel a: common set of circuit elements. Panel b: picture of the straight aorta with sensors submerged in agar (circuit 1) with component parts listed in legend, inset: the anatomically correct aorta phantom (circuit 2)
Fig. 2
Fig. 2
Images of a valve in closed (a and c) and open (b and d) conformation in US and in MRI (e)
Fig. 3
Fig. 3
Images of the valves in circuit 2. In each sub-panel, the respective valve can be observed imaged by MRI in closed (left upper) and then open formation (right upper), en face (right lower) and finally the physical valve model (left lower). Four different valves are observed normal (a), bicuspid (b), calcific (c), rheumatic (d)
Fig. 4
Fig. 4
Graphical representations of pressure signals obtained from the sensors. Panel a: A typical time transient pressure recording under a single constant flow condition. Panel b: A typical time transient pressure recording under a single pulsatile flow condition. Panel c: Averaged pressure recordings for each channel under a single pulsatile condition, with the timepoint of the instantaneous peak pressure drop demarcated by a grey line. Panel d: Mean pressure drop between each channel and channel 1, with an overlay of the instant of peak drop (channel 1–7). Panel e: Reconstruction of the longitudinal transient of pressure through interpolation from data of the 8 sensor locations at the instant of peak drop (identified as shown in panel d), with an overlay of the estimated spatial location of the peak drop. Panel f: identification of peak-to-peak pressure drop under pulsatile flow as indicated by pressure transients in channels 1 and 7
Fig. 5
Fig. 5
Reproducibility of pressure metrics in pulsatile conditions, comparing the measurements made in the two experimental sessions. Panel a: regression analysis. Panel b–d: the Bland-Altman analysis
Fig. 6
Fig. 6
Reproducibility of pressure metrics in constant flow conditions, comparing the measurements made in the two experimental sessions. Panel a: regression analysis. Panels b and c: the Bland-Altman analysis
Fig. 7
Fig. 7
Scatter graph demonstrating the relationship between the various pressure metrics for pulsatile and constant flow

Similar articles

References

    1. Vahanian A, Beyersdorf F, Praz F, Milojevic M, Baldus S, Bauersachs J, Wojakowski W. 2021 ESC/EACTS Guidelines for the management of valvular heart disease developed by the task force for the management of valvular heart disease of the European Society of Cardiology (ESC) and the European Association for Cardio-Thoracic Surgery (EACTS) European Heart Journal. 2021 doi: 10.1093/EURHEARTJ/EHAB395. - DOI - PubMed
    1. Horstkotte D, Loogen F. The natural history of aortic valve stenosis. European Heart Journal. 1988;9(suppl E):57–64. doi: 10.1093/eurheartj/9.suppl_e.57. - DOI - PubMed
    1. Carabello BA, Paulus WJ. Aortic stenosis. The Lancet. 2009;373(9667):956–966. doi: 10.1016/S0140-6736(09)60211-7. - DOI - PubMed
    1. Otto, C. M., Nishimura, R. A., Bonow, R. O., Carabello, B. A., Iii, J. P. E., Krieger, E. v, Toly, C. (2021). 2020 ACC/AHA guideline for the management of patients with valvular heart disease. 10.1161/CIR.0000000000000923 - PubMed
    1. Clavel MA, Dumesnil JG, Capoulade R, Mathieu P, Sénéchal M, Pibarot P. Outcome of patients with aortic stenosis, small valve area, and low-flow, low-gradient despite preserved left ventricular ejection fraction. J Am College of Cardiology. 2012 doi: 10.1016/j.jacc.2011.12.054. - DOI - PubMed

Publication types

LinkOut - more resources