. 2023 Aug;36(4):589-612.
doi: 10.1007/s10334-022-01058-8. Epub 2023 Feb 6.

Extra-axonal contribution to double diffusion encoding-based pore size estimates in the corticospinal tract

Affiliations

Extra-axonal contribution to double diffusion encoding-based pore size estimates in the corticospinal tract

Patricia Ulloa et al. MAGMA. 2023 Aug.

Abstract

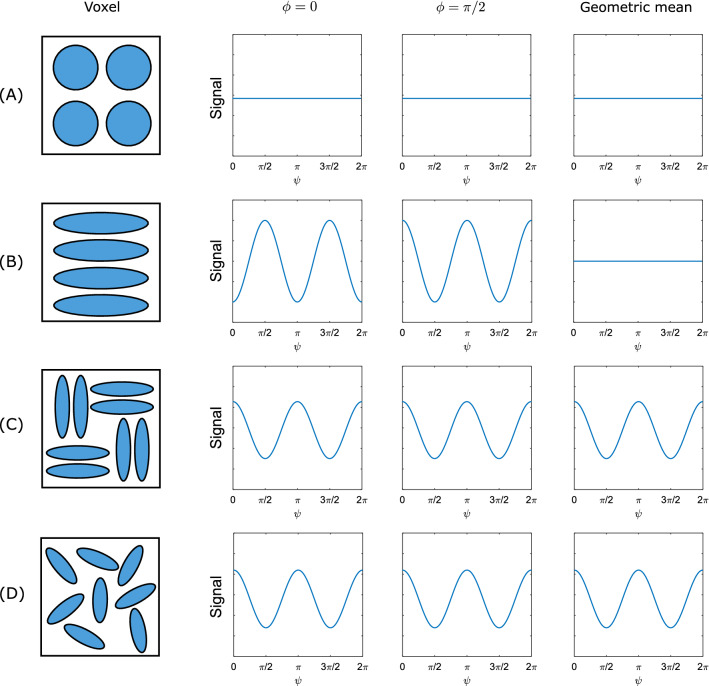
Objective: To study the origin of compartment size overestimation in double diffusion encoding MRI (DDE) in vivo experiments in the human corticospinal tract. Here, the extracellular space is hypothesized to be the origin of the DDE signal. By exploiting the DDE sensitivity to pore shape, it could be possible to identify the origin of the measured signal. The signal difference between parallel and perpendicular diffusion gradient orientation can indicate if a compartment is regular or eccentric in shape. As extracellular space can be considered an eccentric compartment, a positive difference would mean a high contribution to the compartment size estimates.

Materials and methods: Computer simulations using MISST and in vivo experiments in eight healthy volunteers were performed. DDE experiments using a double spin-echo preparation with eight perpendicular directions were measured in vivo. The difference between parallel and perpendicular gradient orientations was analyzed using a Wilcoxon signed-rank test and a Mann-Whitney U test.

Results: Simulations and MR experiments showed a statistically significant difference between parallel and perpendicular diffusion gradient orientation signals ([Formula: see text]).

Conclusion: The results suggest that the DDE-based size estimate may be considerably influenced by the extra-axonal compartment. However, the experimental results are also consistent with purely intra-axonal contributions in combination with a large fiber orientation dispersion.

Keywords: Diffusion anisotropy; Extracellular space; Microstructure; Multiple wave vector diffusion weighting; Size estimates; White matter.


Conflict of interest statement

The authors declare no conflict of interest.

Figures

Fig. 1
Fig. 1
Double diffusion encoding (DDE) imaging sequence with EPI readout (schematic) (sl: slice selection, re: readout, ph: phase encoding). Dotted lines in the RF timeline show the occurrence of echoes. Crusher gradients are shown in the slice selection timeline (in grey), located before and after the refocusing pulses to suppress unwanted coherence pathways. Diffusion gradients drawn with a solid line correspond to an experiment with ψ=0 (i.e., q(1)=q(2)). Dashed lines show the q(2) weighting in the ψ=π case. The pulses are not drawn to scale
Fig. 2
Fig. 2
A Packed circular cylinders, B cross-section of the situation in (A), C possible cross-section with looser packing, D tilted cylinders with circular base, and E cross-section of (D) (exaggerated), or of untilted cylinders with elliptical base. The signal may depend differently on experimental parameters if water is only present inside the cylinders or both inside and outside. Figure partially adapted from [41]
Fig. 3
Fig. 3
Schematic illustration of the expected angular signal dependence for a DDE sequence at long mixing time, τm, for a voxel containing water-filled pores of different shapes. ψ is the angle between the two diffusion gradient wave vectors, q(1) and q(2). ϕ is the angle between q(1) and the horizontal axis in the schematic of the voxel microstructure (left). A For spherical compartments, no angular dependence is expected. B For aligned ellipsoids, the DDE signal modulation depends on ϕ and ψ, exhibiting a cos(2ψ) angular dependence. However, for (C) and (D) (aligned ellipsoids perpendicular to each other and randomly oriented ellipsoids, respectively), the DDE signal will show a cos(2ψ) dependence, and it does not depend on ϕ. The column on the right shows the geometric mean of the ϕ=0 and ϕ=π/2 columns. The geometric mean cancels out the parallel–perpendicular difference in (B) but not in (C) and (D). The plots would show the same qualitative behaviour if the voxel contained cylindrical pores instead, with the schematic on the left showing the cross section of the pores
Fig. 4
Fig. 4
A Overview of the diffusion gradient directions in the x-y plane used in the in vivo experiments. Sixteen different combinations of diffusion gradient orientations were used, where for a given angle ϕ, q(1) (solid line) is fixed and q(2) (dashed line) is rotated about an angle ψ. B Schematic of the DTI-derived angles. α corresponds to the inclination angle of the CST axis with respect to the z-axis, and β specifies how the projection of the CST axis is oriented in the xy plane
Fig. 5
Fig. 5
Simulated diffusion signal of different volume fractions after taking the geometric mean over the ϕ=0 and ϕ=π/2 cases. The intracellular space (volume fraction fi) is represented by cylinders of three different diameters, and the extracellular space is described by a diffusion tensor (diffusivities obtained from the DTI analysis performed on volunteer no. 8). A fi=1 (no extracellular component), B fi=0.7, C fi=0.5, D fi=0.3, and E fi=0 (only extra-axonal component). The second row shows a zoomed view of the plots in the first row. For considerable intracellular volume fractions (columns B, C, D), the simulations show a slight W-shaped modulation, in particular for small cylinder diameters. The W-shaped modulation arises from the mixed signal of cylinder and tensor
Fig. 6
Fig. 6
In vivo results in a ROI comprising both CST, defined using an arbitrary threshold. Voxels that did not belong to that area were manually removed. A Attenuation of the DDE-weighted signal vs. angle ψ between the diffusion wave vectors, geometrically averaged over signals with all diffusion gradients rotated by π/2 and arithmetically averaged over the ROI. “Mean” is the arithmetic mean over all volunteers (*: TE=200 ms). The geometric mean should have removed any signal modulation due to a simple inclination with respect to the plane spanned by the diffusion gradients. The minima at ψ=π/2 and ψ=3π/2 suggest an eccentric shape of the signal-dominating compartment. B In vivo results for subject no. 8; parallel–perpendicular attenuation difference for the DDE-weighted signal, after taking the geometric mean over signals with all diffusion gradients rotated by π/2, in the bilateral CST ROI, overlaid with the T1-weighted image. The relatively large differences found in the CST suggest the protons to reside in a more eccentric compartment, as compared to the spinal cord sample. C Histogram of the parallel–perpendicular differences shown in (A) for the ROI covering the CST
Fig. 7
Fig. 7
In vivo results for the size estimate. A size estimate Rg2 [Eq. (10)] for subject no. 8, overlaid with the T1-weighted image. Negative values can occur due to noise. B and C Histograms of Rg2 shown in (A) and the calculated cylinder diameter [Eq. (11)] for the same volunteer. D Size estimate Rg2 (mean over ROI) for all volunteers. The dashed lines mark the mean over volunteers. The error bars represent the standard deviation within the ROI. The Rg2 mean over volunteers (± standard deviation) is (3.9±0.5)μm2, (3.8±0.5)μm2, and (4.0±0.7)μm2 for the ROIs covering the bilateral, left, and right CSTs, respectively. These values correspond to estimated cylinder diameters, 2rlim, of (4.6±0.3)μm, (4.5±0.3)μm, and (4.6±0.4)μm, respectively, according to Eq. (11)
Fig. 8
Fig. 8
Predicted DDE signal attenuation, E, vs. ψ (angle between the wave vectors, q(i), i=1,2) for circular cylinders that are inclined with respect to the z axis, as seen in (A). Diffusion gradients are in the x-y plane, as shown in (B) and (C). The plots are based on the analytic expressions from Özarslan and Basser [56] [Eq. (15)]. When varying ψ, one gradient is fixed while the other is rotated about the z axis. (The meaning of ψ is as proposed in Shemesh et al. [7].) D Single inclined cylinder (u1 in (C)): E(ψ) for three arbitrary orientations (ϕ=-π/4,+π/12,+π/4) of the non-rotating gradient, specified by the angle ϕ which is subtended by the fixed gradient and the direction (x,y,z)T=(1,1,0)T, (as seen in (B)). The dashed line shows E¯(g)=(E¯E¯)1/2, i.e. the arithmetic mean of E(0) and E(π), geometrically averaged over ϕ=±π/4. E Geometric mean of the E(ψ) curves for ϕ=-π/4 and ϕ=+π/4 shown in (D). (The geometric mean over ϕ=ϕ0 and ϕ=ϕ0+π/2 is independent of ϕ0.) Only effects of restriction are visible (i.e., a minimum at antiparallel orientation) while the modulation due to the cylinder inclination is removed by the geometric mean. Note the difference to Fig. 3 where the restriction effect is absent due to τm. F, G Signal from two cylinders with different directions (u1 and u2 in (C), see text), plotted as in (D) and (E), respectively. Subfigure (G) shows that in the two-fiber case the geometric means at ψ=±π/2 differ from E¯(g) (dashed line), in contrast to the single-fiber situation shown in (E). This was predicted on the grounds of Eq. (A5). For a single fiber orientation, this difference is always zero. (Note the different vertical scales. For more details, see text.)
Fig. 9
Fig. 9
Experiments with short (10.9 ms) and long (29.9 ms) τm performed in volunteer no. 7. A The diffusion signal shows a W-shaped modulation for both τm values. B The parallel–perpendicular signal difference after the geometric mean does not exhibit a significant difference between short and long τm (Wilcoxon signed-rank test). C However, the parallel–antiparallel signal difference showed a statistically significant difference between long and short τm, where attenuation differences for long τm were slightly smaller than for short mixing time (Mann Whitney U test). D shows the mean-squared radius of gyration histogram, with values of (3.22±0.44)μm2 and (2.6±0.31)μm2 for short and long τm, respectively, using Eq. (10). E Histogram of estimated diameters calculated as in Eq. (11), resulting in (4.39±0.23)μm and (3.84±0.28)μm for short and long τm, respectively
Fig. 10
Fig. 10
Simulated diffusion signal of different volume fractions after taking the geometric mean over ϕ=0 and ϕ=π/2 for a cylinder and an extracellular compartment as in Fig. 5, with diameter d=10μm. Here, different mixing times are shown (τm= 10, 20, and 100 ms). For each fi, a superposition of a cos(ψ) and a cos(2ψ) modulation is observed. Upon increasing τm, the cos(ψ) modulation gradually decreases. Left to right: without the tensor compartment (fi=1), the minima at ψ=±π/2 completely suppressed by the geometric mean mechanism. As the relative contribution of the tensor compartment increases, the minima at ψ=±π/2 reappear because the geometric mean mechanism is less and less efficient. At fi=0, the modulation is lost completely since there is no microscopic anisotropy arising from a cylinder compartment. (Note the different vertical scales.)
Fig. 11
Fig. 11
Simulations considering cylinders and a tensor describing the extracellular space, as in Fig. 5 (simulated diffusion signal of different volume fractions after the geometric mean). fi=1: only cylinder (intracellular space), fi=0: only tensor (extra-axonal component), and size estimate. (Note the different vertical scales.) Ideal sequence parameters were used. The w-shaped modulation is only present for small compartment sizes. The size estimate approximately corresponds to the true size for fi = 1. However, there is still a size underestimation when increasing the extra-axonal volume fraction. This is consistent with the simulations shown in Fig. 5. The tensor compartment in MISST only allows for reduced effective diffusivities but does not provide a real restriction. Therefore, under these conditions, a tensor model (in MISST) is not a good representation for the extra-axonal space. Also, one must consider that the quasi-free diffusion of the tensor reduces the modulation amplitude, resulting in size underestimation
Fig. 12
Fig. 12
Simulated diffusion signal of different volume fractions after the geometric mean using the in vivo sequence parameters. The extracellular space is represented by a cylinder with a larger diameter (d = 20 μm, arbitrarily chosen) parallel to the other cylinders. fi = 1 (only cylinder, in three different diameters, representing intra-axonal space), fi = 0 (only large cylinder). (Note the different vertical scales.) In this situation, a w-shaped modulation is not expected. The geometric mean removes the compartment eccentricity which is due to cylinder tilting. As our in vivo sequence parameters violate Mitra’s ideal conditions (δτD and ΔτD), the compartment size is underestimated. However, this underestimation is not as severe as when using a tensor for representing extra-axonal space
Fig. 13
Fig. 13
Simulated diffusion signal of different volume fractions after the geometric mean using ideal sequence parameters. The extracellular space is represented by a cylinder with a larger diameter (d = 20 μm) parallel to the other cylinders. fi = 1 (only cylinder, in three different diameters, representing intra-axonal space), fi = 0 (only large cylinder). (Note the different vertical scales.) Using ideal sequence parameters, a compartment size overestimation is present for all compartments with extra-axonal volume fraction. In this situation, a w-shaped modulation is not expected because the large tilted cylinder is parallel to the other (smaller) cylinder. The geometric mean removes the compartment eccentricity which is due to cylinder tilting

References

    1. Drake-Pérez M, Boto J, Fitsiori A, Lovblad K, Vargas MI. Clinical applications of diffusion weighted imaging in neuroradiology. Insights Imaging. 2018;9(4):535–547. doi: 10.1007/s13244-018-0624-3. - DOI - PMC - PubMed
    1. Mekkaoui C, Reese TG, Jackowski MP, Bhat H, Sosnovik DE. Diffusion MRI in the heart. NMR Biomed. 2017;30(3):3426. doi: 10.1002/nbm.3426. - DOI - PMC - PubMed
    1. Partridge SC, Nissan N, Rahbar H, Kitsch AE, Sigmund EE. Diffusion-weighted breast MRI: clinical applications and emerging techniques. J Magn Reson Imaging. 2017;45(2):337–355. doi: 10.1002/jmri.25479. - DOI - PMC - PubMed
    1. Ye J, Kumar BS, Li X-B, Li H-m, Zhou Y-w, Liu L-q. Clinical applications of diffusion-weighted magnetic resonance imaging in diagnosis of renal lesions – a systematic review. Clin Physiol Funct Imaging. 2017;37(5):459–473. doi: 10.1111/cpf.12313. - DOI - PubMed
    1. Alexander DC, Dyrby TB, Nilsson M, Zhang H. Imaging brain microstructure with diffusion MRI: practicality and applications. NMR Biomed. 2019;32(4):3841. doi: 10.1002/nbm.3841. - DOI - PubMed