. 2023 Feb 6;71(7):3403-3413.
doi: 10.1021/acs.jafc.2c07208. Online ahead of print.

Reducing Dietary Acrylamide Exposure from Wheat Products through Crop Management and Imaging

Affiliations

Reducing Dietary Acrylamide Exposure from Wheat Products through Crop Management and Imaging

Joseph Oddy et al. J Agric Food Chem. .

Abstract

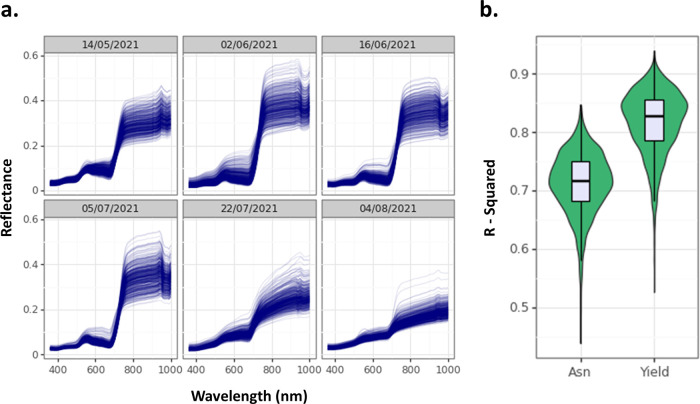
The nutritional safety of wheat-based food products is compromised by the presence of the processing contaminant acrylamide. Reduction of the key acrylamide precursor, free (soluble, non-protein) asparagine, in wheat grain can be achieved through crop management strategies, but such strategies have not been fully developed. We ran two field trials with 12 soft (biscuit) wheat varieties and different nitrogen, sulfur, potassium, and phosphorus fertilizer combinations. Our results indicated that a nitrogen-to-sulfur ratio of 10:1 kg/ha was sufficient to prevent large increases in free asparagine, whereas withholding potassium or phosphorus alone did not cause increases in free asparagine when sulfur was applied. Multispectral measurements of plants in the field were able to predict the free asparagine content of grain with an accuracy of 71%, while a combination of multispectral, fluorescence, and morphological measurements of seeds could distinguish high free asparagine grain from low free asparagine grain with an accuracy of 86%. The acrylamide content of biscuits correlated strongly with free asparagine content and with color measurements, indicating that agronomic strategies to decrease free asparagine would be effective and that quality control checks based on product color could eliminate high acrylamide biscuit products.

Keywords: acrylamide; asparagine; biscuits; food safety; multispectral imaging; nitrogen; phosphorus; potassium; sulfur; wheat.


Conflict of interest statement

The authors declare the following competing financial interest(s): JO is supported by a BBSRC Collaborative Training Partnership Studentship (BB/T50838X/1) with partners: University of Reading and Mondelez UK R&D Ltd. JO is also supported by a scholarship from the Society of Chemical Industry. SR is supported by a Biotechnology and Biological Sciences Research Council (BBSRC) Super Follow-on Fund grant (BB/T017007/1), with partners: University of Bristol, AHDB, KWS UK Ltd, Saaten Union UK Ltd, RAGT Seeds Ltd, Syngenta UK Ltd, and Limagrain UK Ltd.

Figures

Figure 1
Figure 1
Free asparagine measurements in grain from both field trials. (a) Free asparagine measurements separated by agronomic treatment. (b) Free asparagine measurements separated by variety. (c) Free asparagine measurements separated by the nitrogen to sulfur ratio. (d) Free asparagine measurements separated by phosphorus treatment. (e) Free asparagine measurements separated by potassium treatment. Boxes show first and third quartiles alongside the median. Whiskers extend to the largest data points within 1.5 times the interquartile range. H20 (2019/2020 trial) and H21 (2020/2021 trial). −P (0 kg/ha phosphorus), −K (0 kg/ha potassium), +P (35 kg/ha phosphorus), and +K (62 kg/ha potassium).
Figure 2
Figure 2
(a) Multispectral measurements taken from field plots for trial H21. (b) R2 values from partial least squares regression analysis of the data for free asparagine (Asn) and yield.
Figure 3
Figure 3
Measurements of selected seeds from trial H21. (a) Principal component analysis of all measured traits from Videometer SeedLab and grain asparagine content. (b) Linear discriminant analysis of seeds separated by agronomic treatment. (c) Balanced accuracy scores from Gaussian naïve Bayes classification for sample treatment and variety. −P (0 kg/ha phosphorus), −K (0 kg/ha potassium), +P (35 kg/ha phosphorus), and +K (62 kg/ha potassium).
Figure 4
Figure 4
Acrylamide measurements in biscuits and associations with other variables. (a) Representative images of biscuits baked in this study. (b) PCA of all measurements taken from biscuits. (c) Acrylamide concentration of biscuits produced from grain from different agronomic treatments. The EU benchmark value of 350 μg/kg is given by the dashed red line. Dark blue points and bars show mean and standard error of the means, respectively. This plot is split to better visualize the lowest acrylamide concentrations of the S10 treatment. (d) Association between the free asparagine content of grain from plots selected for baking and biscuit acrylamide content. Linear model line fitted. (e) Association between biscuit color (as measured by hue angle of the top surface) and acrylamide content. LOWESS smoothing curve fitted. Gray-shaded region indicates the standard error of the means. −P (0 kg/ha phosphorus), −K (0 kg/ha potassium), +P (35 kg/ha phosphorus), +K (62 kg/ha potassium), t (top side of biscuit), and b (bottom side of biscuit).

References

    1. Manley D.Setting the scene: A history and the position of biscuits. In Manley’s Technology of Biscuits, Crackers and Cookies ;Woodhead Publishing; 2011(pp. 1–9).
    1. https://www.gov.uk/government/statistics/ndns-diet-and-physical-activity-a-follow-up-study-during-covid-19

    1. https://www.readkong.com/page/winning-with-biscuits-annual-biscuit-review-2020-pladis-1454169

    1. https://ahdb.org.uk/cereals-oilseeds/uk-human-industrial-cereal-usage

    1. https://www.ers.usda.gov/data-products/wheat-data/