. 2023 Feb 14;120(7):e2217673120.
doi: 10.1073/pnas.2217673120. Epub 2023 Feb 6.

Gaucher disease protects against tuberculosis

Affiliations

Gaucher disease protects against tuberculosis

Jingwen Fan et al. Proc Natl Acad Sci U S A. .

Abstract

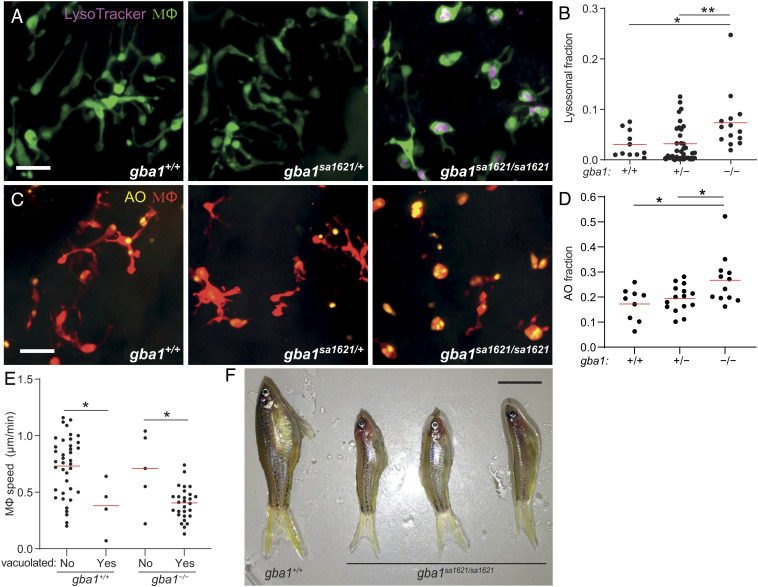
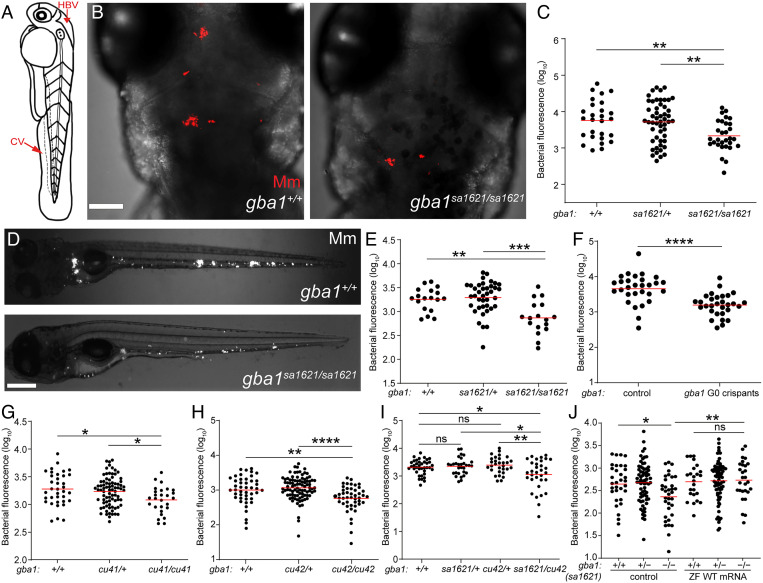
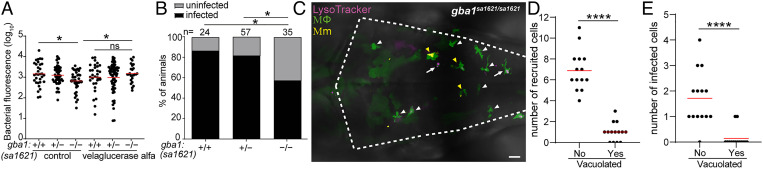
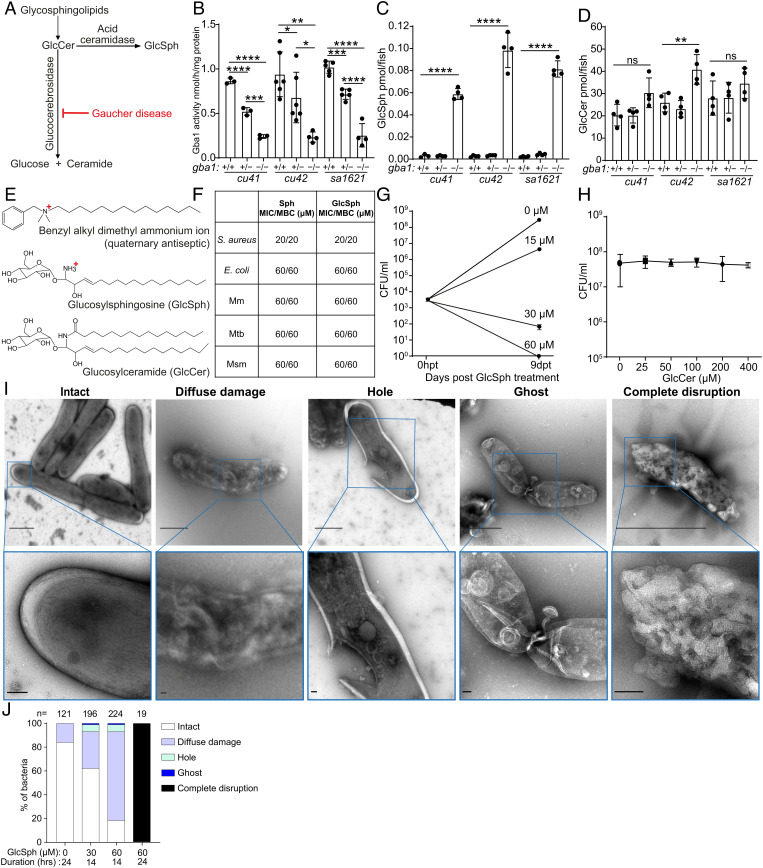
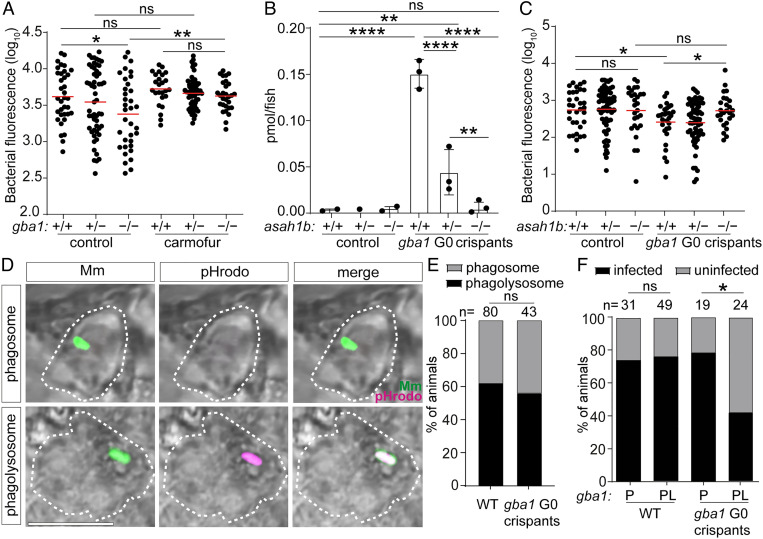
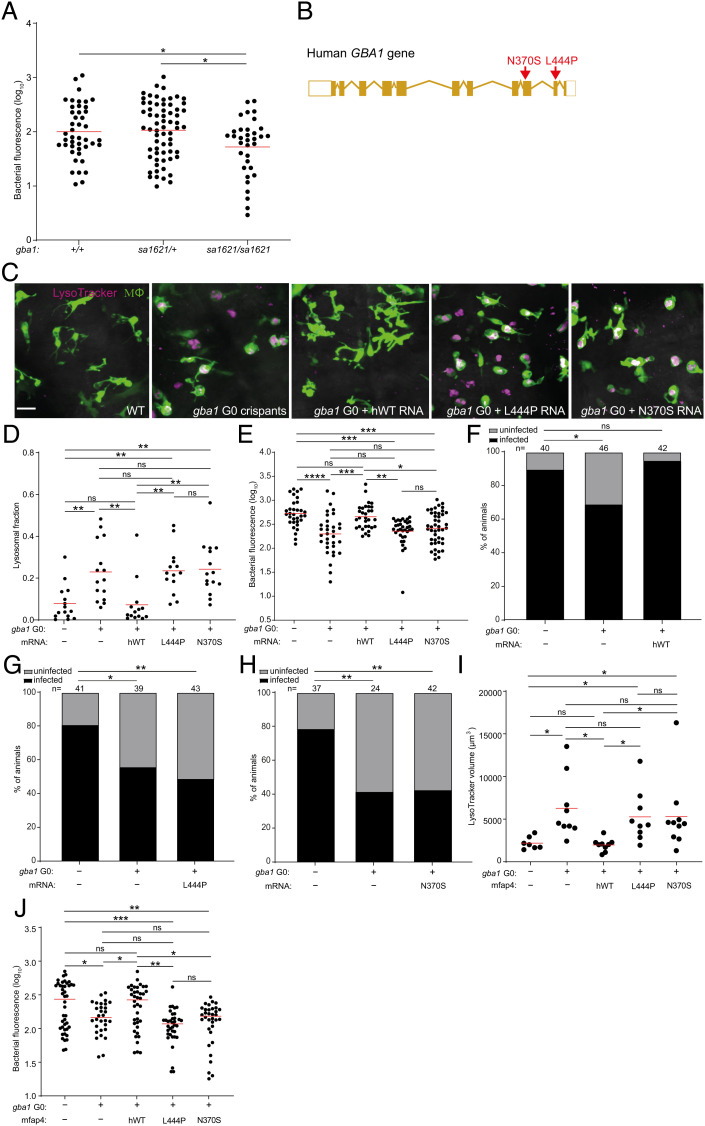
Biallelic mutations in the glucocerebrosidase (GBA1) gene cause Gaucher disease, characterized by lysosomal accumulation of glucosylceramide and glucosylsphingosine in macrophages. Gaucher and other lysosomal diseases occur with high frequency in Ashkenazi Jews. It has been proposed that the underlying mutations confer a selective advantage, in particular conferring protection against tuberculosis. Here, using a zebrafish Gaucher disease model, we find that the mutation GBA1 N370S, predominant among Ashkenazi Jews, increases resistance to tuberculosis through the microbicidal activity of glucosylsphingosine in macrophage lysosomes. Consistent with lysosomal accumulation occurring only in homozygotes, heterozygotes remain susceptible to tuberculosis. Thus, our findings reveal a mechanistic basis for protection against tuberculosis by GBA1 N370S and provide biological plausibility for its selection if the relatively mild deleterious effects in homozygotes were offset by significant protection against tuberculosis, a rampant killer of the young in Europe through the Middle Ages into the 19th century.

Keywords: Gaucher disease; lysosomal glucosylsphingosine; macrophages; tuberculosis resistance; zebrafish.


Conflict of interest statement

The authors declare no competing interest.

Figures

Fig. 1.
Fig. 1.
gba1 mutant zebrafish manifest Gaucher disease. (A) Maximum intensity projection of pseudocolored representative confocal images of YFP-expressing macrophages stained with LysoTracker Red in 3 dpf zebrafish brains. (Scale bar, 20 μm.) (B) LysoTracker Red volume per macrophage in 3 dpf brains. Each point represents the mean volume fraction per macrophage in each brain. Horizontal red bars, means; *P < 0.05; **P < 0.01 (one-way ANOVA with Tukey’s posttest). Representative of at least three independent experiments. (C) Maximum intensity projection of representative confocal images of tdTomato-expressing macrophages stained with AO in 3 dpf zebrafish brains. (Scale bar, 20 μm.) (D) AO volume per macrophage in the brains of 3 dpf zebrafish. Each point represents the average AO volume fraction per macrophage in each fish. Horizontal red bars, means; *P < 0.05 (one-way ANOVA with Tukey’s posttest). (E) Homeostatic migration speed of normal and vacuolated macrophages in the brains of 3 dpf zebrafish. Each point represents the mean speed of an individual macrophage from the same animal per indicated genotype during 2 h observation. Horizontal red bars, means. *P < 0.05 (one-way ANOVA with Tukey’s posttest). Representative of two to three animals for each genotype. (F) Representative images of three gba1sa1621/sa1621 fish and their wild-type sibling at 77 d after fertilization (dpf). (Scale bar, 1 cm.)
Fig. 2.
Fig. 2.
gba1 mutant zebrafish are resistant to Mm infection. (A) Illustration of a zebrafish larva showing the HBV and CV injection sites. (B) Maximum intensity projection of representative confocal images of zebrafish larval HBV at 3 dpi after HBV infection with 100 to 150 Mm. (Scale bar, 80 μm.) (C) Quantification of HBV bacterial burden measured by fluorescence per animal from (B). Horizontal red bars, means; **P < 0.01 (one-way ANOVA with Tukey’s posttest). Representative of more than three independent experiments. (D) Representative images of zebrafish larvae at 5 dpi after CV infection with 200 to 300 Mm. (Scale bar, 300 μm.) (E) Quantification of the bacterial burden measured by fluorescence per animal from (D). Horizontal bars, means; **P < 0.01; ***P < 0.001 (one-way ANOVA with Tukey’s posttest). Representative of more than three independent experiments. (F) Bacterial burden measured by fluorescence per animal in wild-type and gba1 G0 crispants at 5 dpi after CV infection with 200 to 300 Mm. Horizontal bars, means; ****P < 0.0001 (Student’s unpaired t test). Representative of more than three independent experiments. (G) Bacterial burden measured by fluorescence in 5 dpi gba1cu41/+ incross larvae after CV infection with 200 to 300 Mm. Horizontal bars, means; *P < 0.05 (one-way ANOVA with Tukey’s posttest). Representative of two independent experiments. (H) Bacterial burden measured by fluorescence in 5 dpi gba1cu42/+ incross larvae after CV infection with 200 to 300 Mm. Horizontal bars, means; **P < 0.01; ****P < 0.0001 (one-way ANOVA with Tukey’s posttest). Representative of more than three independent experiments. (I) Bacterial burden measured by fluorescence in wild-type, sa1621 and cu42 heterozygotes, and sa1621/cu42 compound mutant siblings at 5 dpi after CV infection with 200 to 300 Mm. Horizontal bars, means; ns, not significant; *P < 0.05; **P < 0.01 (one-way ANOVA with Tukey’s posttest). (J) Bacterial burden measured by fluorescence in gba1sa1621/+ incross larvae, injected with zebrafish WT gba1 mRNA (200 ng/μL) or vehicle control, 5 dpi after CV infection with 200 to 300 Mm. Horizontal bars, means; ns, not significant; *P < 0.05; **P < 0.01 (one-way ANOVA with Tukey’s posttest). Representative of two independent experiments.
Fig. 3.
Fig. 3.
gba1 mutant macrophages are bactericidal. (A) Bacterial burden measured by fluorescence in 3 dpi gba1sa1621/+ incross larvae treated with 100 units/mL velaglucerase alfa or vehicle control after HBV infection with 100 to 150 Mm. Horizontal bars, means; ns, not significant; *P < 0.05 (one-way ANOVA with Tukey’s posttest). Representative of two independent experiments. (B) Percentage of infected larvae at 5 dpi after infection of the HBV with a single Mm bacterium. *P < 0.05 (Fisher’s exact test). Representative of two independent experiments. (C) Maximum intensity projection of pseudocolored representative confocal image of YFP-expressing macrophages stained with LysoTracker Red in the brain of 2 dpf gba1 mutant larvae at 6 h after infection (hpi) in the HBV. Arrows mark vacuolated macrophages which have not phagocytosed Mm. White arrowheads mark nonvacuolated macrophages which have not phagocytosed Mm. Yellow arrowheads mark nonvacuolated macrophages which have phagocytosed Mm. (Scale bar, 20 μm.) (D) Quantification of nonvacuolated and vacuolated macrophages that are recruited to HBV in gba1 mutant larvae from (C). Each point represents the total number of recruited nonvacuolated or vacuolated macrophages in each fish. Horizontal red bars, means. ****P < 0.0001 (Student’s unpaired t test). (E) Quantification of nonvacuolated and vacuolated macrophages with phagocytosed Mm from (C). Each point represents the total number of infected nonvacuolated or vacuolated macrophages in each fish. Horizontal red bars, means. ****P < 0.0001 (Student’s unpaired t test).
Fig. 4.
Fig. 4.
Glucosylsphingosine is bactericidal in vitro. (A) Representation of the pathway leading to glucosylceramide and glucosylsphingosine accumulation in Gaucher disease. GlcCer, glucosylceramide. GlcSph, glucosylsphingosine. (B) Glucocerebrosidase enzyme activity (nmol/mg) in 5 dpf gba1 cu41, cu42, and sa1621 mutants and their wild-type siblings. Mean ± SD; *P < 0.05; **P < 0.01; ***P < 0.001; ****P < 0.0001 (one-way ANOVA with Tukey’s posttest). (C) GlcSph (pmol/fish) in 5 dpf gba1 cu41, cu42, and sa1621 mutants and their wild-type siblings. Mean ± S.D; ****P < 0.0001 (one-way ANOVA with Tukey’s posttest). Representative of two independent experiments. (D) GlcCer (pmol/fish) in 5 dpf gba1 cu41, cu42, and sa1621 mutants and their wild-type siblings. Mean ± SD; ns, not significant; **P < 0.01 (one-way ANOVA with Tukey’s posttest). Representative of two independent experiments. (E) Chemical structures of benzyl alkyl dimethyl ammonium ion, GlcSph, and GlcCer. (F) MIC/MBC table of Staphylococcus aureus, Escherichia coli, Mm, Mtb, and M. smegmatis treated with Sph and GlcSph. Representative of one to two independent experiments performed in duplicate. (G) Mm killing by GlcSph. Mean CFU/mL; vertical bars, upper and lower values of the two technical replicates. (H) Mean Mm (CFU/mL) after incubation with increasing GlcCer concentrations for 9 d. Vertical bars, upper and lower values of the two technical replicates (starting concentration, 2.8 × 103 CFU/mL). Representative of two independent experiments. (I) Negative stain TEM images of Msm treated with GlcSph, representative of the types of damage seen. [Scale bars, 1 μm (Top) and 100 nm (Bottom).] (J) Quantification of the types of damage seen in (H) for various GlcSph concentrations.
Fig. 5.
Fig. 5.
Glucosylsphingosine is bactericidal in vivo. (A) Bacterial burden measured by fluorescence in gba1sa1621/+ incross larvae treated with 0.5 μM carmofur or vehicle control 5 dpi after CV infection with 200 to 300 Mm. Horizontal bars, means; ns, not significant; *P < 0.05; **P < 0.01 (one-way ANOVA with Tukey’s posttest). Representative of two independent experiments. (B) GlcSph (pmol/fish) in asah1b incross larvae that are either wild type or G0 crispant for gba1. Mean ± SD; ns, not significant; **P < 0.01; ****P < 0.0001 (one-way ANOVA with Tukey’s posttest). Representative of two independent experiments. (C) Bacterial burden measured by fluorescence in asah1b incross larvae that are either wild type or G0 crispant for gba1 5 dpi after CV infection with 200 to 300 Mm. Horizontal bars, means; ns, not significant; *P < 0.05 (one-way ANOVA with Tukey’s posttest). (D) Representative confocal images showing phagosome-localized Mm (green) and phagolysosome-localized Mm (green plus magenta) inside zebrafish macrophages (bright field, dashed lines) at 12 hpi. (Scale bar, 10 μm.) (E) Percentage of animals in which the single infecting Mm bacterium was localized to a phagosome or a phagolysosome; ns, not significant (Fisher’s exact test). Representative of two to three independent experiments. (F) Percentage of infected wild-type and gba1 G0 crispants at 5 dpi after HBV infection with a single Mm bacterium. P, phagosome; PL, phagolysosome; ns, not significant; *P < 0.05 (Fisher’s exact test). Representative of two to three independent experiments.
Fig. 6.
Fig. 6.
Common human GBA1 mutants confer resistance to TB. (A) Bacterial burden measured by fluorescence in gba1sa1621/+ incross larvae 5 dpi after CV infection of 400 to 500 Mtb. Horizontal bars, means. *P < 0.05 (one-way ANOVA with Tukey’s posttest). (B) Schematic diagram showing the location of the two human GBA1 mutations studied. (C) Maximum intensity projection of representative pseudocolored confocal images of brain macrophages (yellow fluorescent) stained with LysoTracker Red in wild-type larvae, gba1 G0 crispants, and gba1 G0 crispants expressing human wild-type, L444P or N370S mutant GBA1 mRNA. (Scale bar, 20 μm.) (D) Mean LysoTracker Red volume per macrophage in 3 dpf animals from (C). Each point represents mean LysoTracker Red volume fraction per macrophage in each fish. Horizontal bars, means; ns, not significant; **P < 0.01 (one-way ANOVA with Tukey’s posttest). Representative of two to three independent experiments. (E) Bacterial burden measured by fluorescence in 5 dpi wild-type, gba1 G0 crispants and gba1 G0 crispants expressing human wild-type, L444P or N370S mutant GBA1 mRNA after CV infection with 600 to 700 Mtb. Horizontal bars, means; ns, not significant; *P < 0.05; **P < 0.01; ***P < 0.001; ****P < 0.0001 (one-way ANOVA with Tukey’s posttest). Representative of two independent experiments. (F) Percentage of infected wild-type animals, gba1 G0 crispants and gba1 G0 crispants expressing human wild-type GBA1 mRNA fish at 5 dpi after HBV infection with a single Mtb bacterium. ns, not significant; *P < 0.05 (Fisher’s exact test). Representative of two independent experiments. (G) Percentage of infected wild-type animals, gba1 G0 crispants and gba1 G0 crispants expressing human L444P mutant GBA1 mRNA at 5 dpi after HBV infection with a single Mtb bacterium. *P < 0.05 and **P < 0.01 (Fisher’s exact test). (H) Percentage of infected wild-type animals, gba1 G0 crispants and gba1 G0 crispants expressing human N370S mutant GBA1 mRNA at 5 dpi after HBV infection with a single Mtb bacterium. **P < 0.01 (Fisher’s exact test). Representative of two independent experiments. (I) Total LysoTracker Red volume in 3 dpf wild-type, gba1 G0 crispants and gba1 G0 crispants expressing macrophage-specific human wild-type, L444P or N370S mutant GBA1 gene. Each point represents total LysoTracker Red volume in each fish. Horizontal bars, means. ns, not significant and *P < 0.05 (one-way ANOVA with Tukey’s posttest). (J) Bacterial burden measured by fluorescence in 5 dpi wild-type, gba1 G0 crispants and gba1 G0 crispants expressing macrophage-specific human wild-type, L444P or N370S mutant GBA1 gene after CV infection with 600 to 700 Mtb. Horizontal bars, means; ns, not significant; *P < 0.05; **P < 0.01; ***P < 0.001 (one-way ANOVA with Tukey’s posttest).

References

    1. Cambier C. J., Falkow S., Ramakrishnan L., Host evasion and exploitation schemes of Mycobacterium tuberculosis. Cell 159, 1497–1509 (2014). - PubMed
    1. Donovan J., et al. , Adjunctive dexamethasone for the treatment of HIV-uninfected adults with tuberculous meningitis stratified by Leukotriene A4 hydrolase genotype (LAST ACT): Study protocol for a randomised double blind placebo controlled non-inferiority trial. Wellcome Open Res. 3, 32 (2018). - PMC - PubMed
    1. Ramakrishnan L., Mycobacterium tuberculosis pathogenicity viewed through the lens of molecular Koch’s postulates. Curr. Opin. Microbiol. 54, 103–110 (2020). - PubMed
    1. Tobin D. M., et al. , Host genotype-specific therapies can optimize the inflammatory response to mycobacterial infections. Cell 148, 434–446 (2012). - PMC - PubMed
    1. Whitworth L., et al. , A Bayesian analysis of the association between Leukotriene A4 Hydrolase genotype and survival in tuberculous meningitis. Elife 10, e61722 (2021). - PMC - PubMed

Publication types

Substances