. 2023 Feb 14;120(7):e2212256120.
doi: 10.1073/pnas.2212256120. Epub 2023 Feb 6.

Brain aerobic glycolysis and resilience in Alzheimer disease

Affiliations

Brain aerobic glycolysis and resilience in Alzheimer disease

Manu S Goyal et al. Proc Natl Acad Sci U S A. .

Abstract

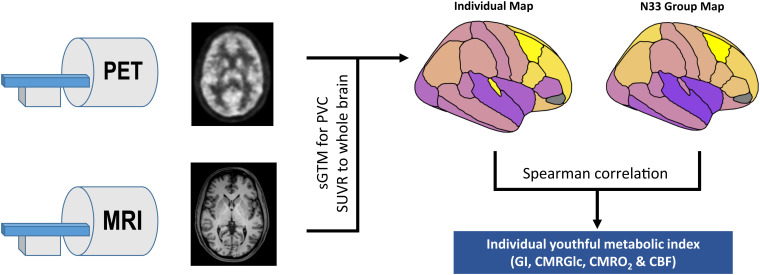
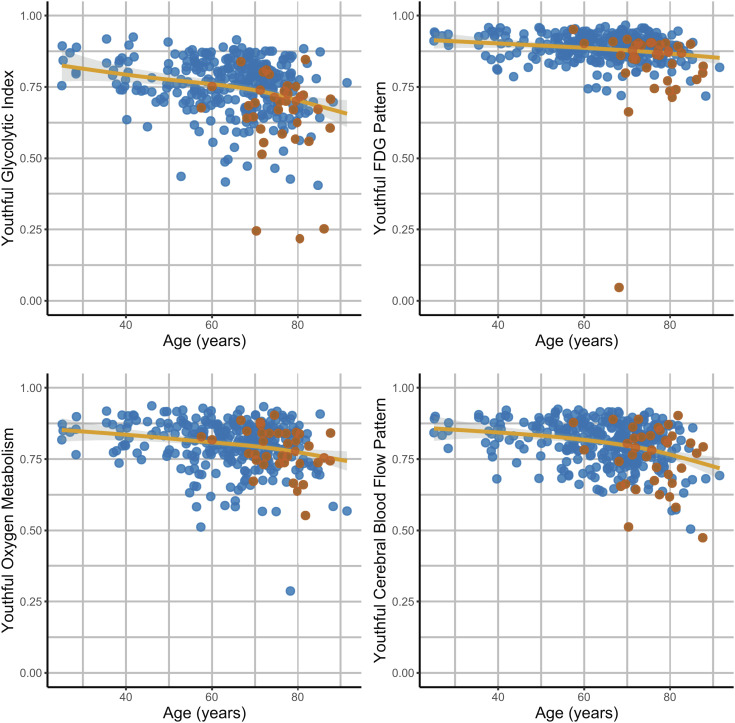
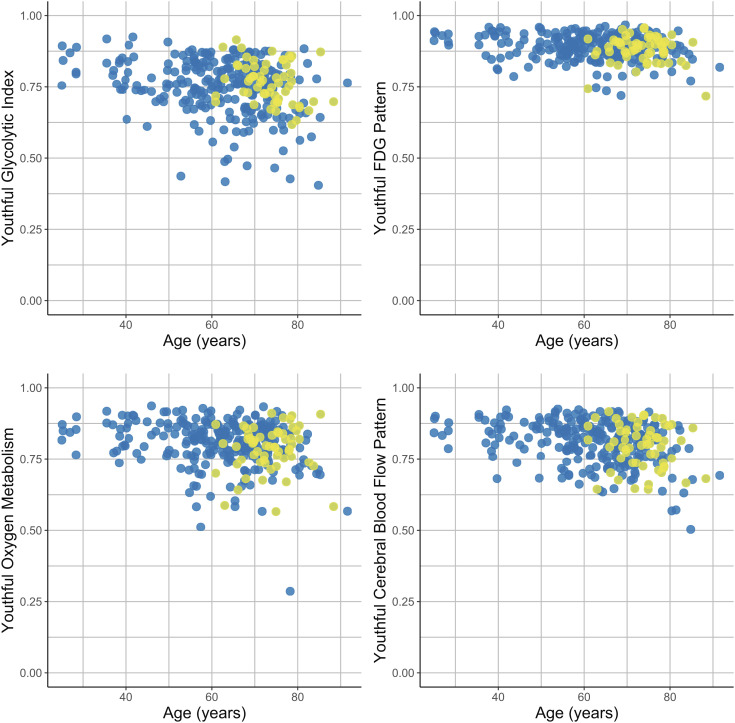
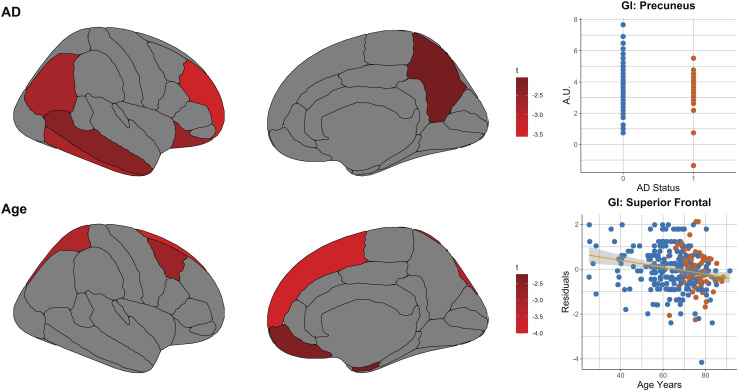
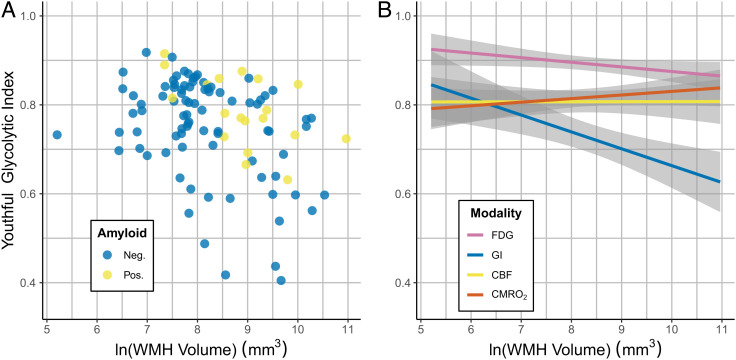
The distribution of brain aerobic glycolysis (AG) in normal young adults correlates spatially with amyloid-beta (Aβ) deposition in individuals with symptomatic and preclinical Alzheimer disease (AD). Brain AG decreases with age, but the functional significance of this decrease with regard to the development of AD symptomatology is poorly understood. Using PET measurements of regional blood flow, oxygen consumption, and glucose utilization-from which we derive AG-we find that cognitive impairment is strongly associated with loss of the typical youthful pattern of AG. In contrast, amyloid positivity without cognitive impairment was associated with preservation of youthful brain AG, which was even higher than that seen in cognitively unimpaired, amyloid negative adults. Similar findings were not seen for blood flow nor oxygen consumption. Finally, in cognitively unimpaired adults, white matter hyperintensity burden was found to be specifically associated with decreased youthful brain AG. Our results suggest that AG may have a role in the resilience and/or response to early stages of amyloid pathology and that age-related white matter disease may impair this process.

Keywords: Alzheimer's disease; aerobic glycolysis; aging; resilience; white matter hyperintensities.


Conflict of interest statement

The authors have organizational affiliations to disclose, J.C.M. obtains consulting fees from the Barcelona Brain Research Center and is on the T.S. Srinivasan Advisory Board in Chennai, India.

Figures

Fig. 1.
Fig. 1.
Schematic overview of youthful brain metabolism calculation. Separate resting PET and MRI scans were obtained in individuals. PET scans were preprocessed and then combined with MRI to calculate partial volume corrected regional standardized uptake value ratio (SUVR) values in the gray matter. Each individual map of brain metabolism and CBF was then compared to the corresponding group map obtained in the separate N33 young adult cohort using a Spearman correlation. The final rho value was used as the “youthful metabolic index” for that individual and specific metabolic parameter (GI, FDG, oxygen metabolism, and CBF). (Figures are intended for schematic purposes only.)
Fig. 2.
Fig. 2.
Differences in the youthful pattern of brain metabolism with age and cognitive impairment. A youthful metabolic index was calculated for AG (GI), CMRGlc (FDG), oxygen metabolism (CMRO2), and CBF (Fig. 1). This was calculated for each of the 353 PET sessions. All indices on average decreased with age (solid lines are generalized additive model (gam) fits with shaded bars reflecting 95% CI). However, this occurred variably across individuals, with some individuals showing a preserved youthful pattern, whereas others showing a decrease in the index. Cognitively impaired individuals (red dots) were more likely to have decreased youthful GI and CMRGlc indices. This was not true, however, for CMRO2 nor CBF.
Fig. 3.
Fig. 3.
Association of amyloid positivity with youthful brain metabolism. Correlations to the youthful pattern of GI, FDG, oxygen metabolism, and CBF were measured for each individual PET session (Fig. 1). In this analysis, only the 313 sessions in cognitively unimpaired individuals were included. Among these individuals, known amyloid positivity (yellow dots) was associated with relatively preserved youthful GI as compared to other adults, adjusting for age and sex. This was not true for CMRGlc, CMRO2 nor CBF. Blue dots reflect amyloid negativity or unknown status (presumed negative).
Fig. 4.
Fig. 4.
Associations of regional glycolysis (GI) with aging and AD. The associations of aging and symptomatic AD with GI were explored at a regional level. Regression models were constructed for each independent gray matter region relating GI to age, sex, and AD and subject as a random effect. As this was an exploratory non-quantitative analysis, only regions showing a significant decrease (defined as t-score < −1.96, uncorrected) in GI are shown here, noting that both age and AD are known to be associated with lower whole brain AG (17, 19, 20). AD was associated with decreases in the precuneus, prefrontal, lateral parietal, and temporal regions. Aging was associated with relative decreases primarily in medial frontal and dorsal frontal and parietal areas, consistent with that reported previously. (In the upper right graph, blue and red dots reflect individuals without and with symptomatic Alzheimer disease, respectively. In the lower right graph, blue and red dots reflect individuals without and with brain amyloid positivity, respectively.)
Fig. 5.
Fig. 5.
Association of WMH with youthful brain metabolism in cognitively normal individuals. (A) WMH volume (log transformed) was negatively associated with the youthful pattern of AG (GI) (P < 0.002). Amyloid positive participants are shown in yellow and negative individuals in blue. (B) Model predictions for the association between youthful metabolic indices and WMH volume are shown for males (similar findings are seen in females). Unlike brain AG (“GI,” blue), neither total glucose consumption (“FDG,” pink), blood flow (“CBF,” yellow), nor oxygen consumption (“CMRO2,” red) was significantly associated with WMH volume (P > 0.05). 95% CIs are shown in gray. All models in (A) and (B) are adjusted for age, sex, and amyloid status.

References

    1. Blazey T., Snyder A. Z., Goyal M. S., Vlassenko A. G., Raichle M. E., A systematic meta-analysis of oxygen-to-glucose and oxygen-to-carbohydrate ratios in the resting human brain. PLoS One 13, e0204242 (2018). - PMC - PubMed
    1. Segarra-Mondejar M., et al. , Synaptic activity-induced glycolysis facilitates membrane lipid provision and neurite outgrowth. EMBO J. 37, e97368 (2018). - PMC - PubMed
    1. Chen K., et al. , Lactate transport facilitates neurite outgrowth. Biosci. Rep. 38, BSR20180157 (2018). - PMC - PubMed
    1. Funfschilling U., et al. , Glycolytic oligodendrocytes maintain myelin and long-term axonal integrity. Nature 485, 517–521 (2012). - PMC - PubMed
    1. Steiner J., et al. , Clozapine promotes glycolysis and myelin lipid synthesis in cultured oligodendrocytes. Front. Cell Neurosci. 8, 384 (2014). - PMC - PubMed

Publication types