. 2023 Jun 1;141(22):2698-2712.
doi: 10.1182/blood.2022018924.

Novel extragenic genomic safe harbors for precise therapeutic T-cell engineering

Affiliations

Novel extragenic genomic safe harbors for precise therapeutic T-cell engineering

Ashlesha Odak et al. Blood. .

Abstract

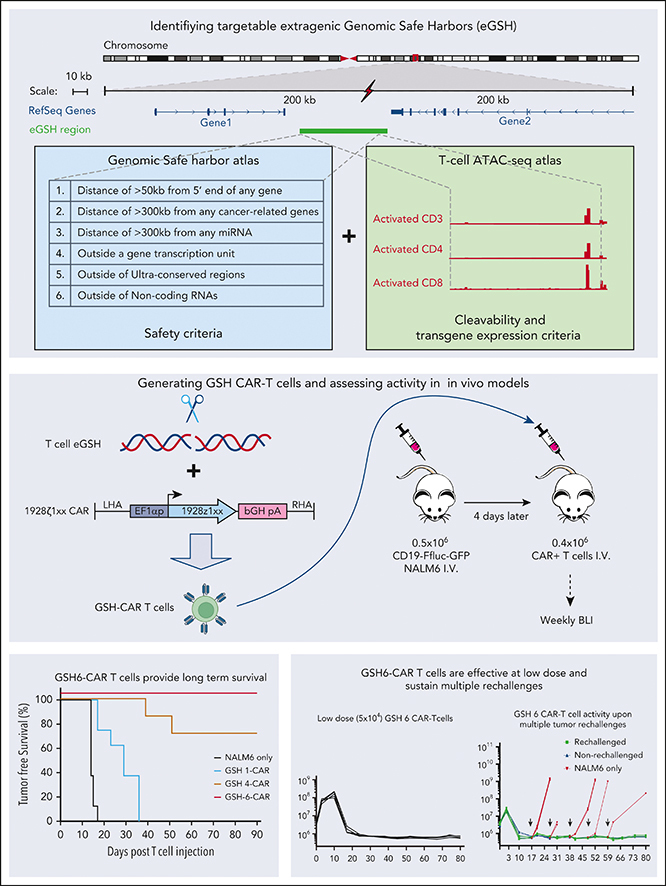
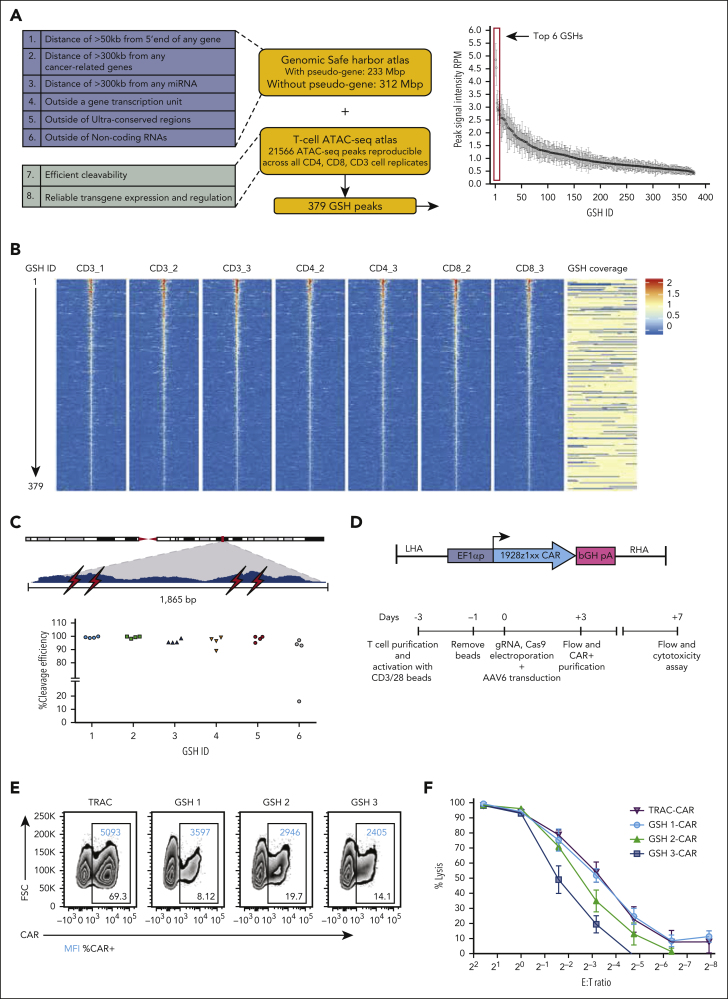
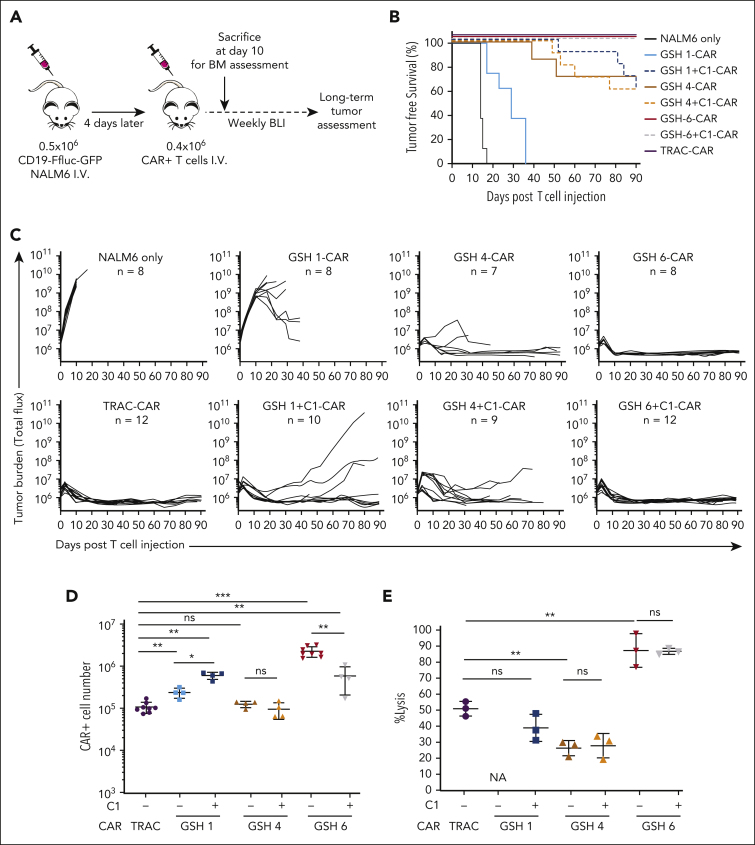
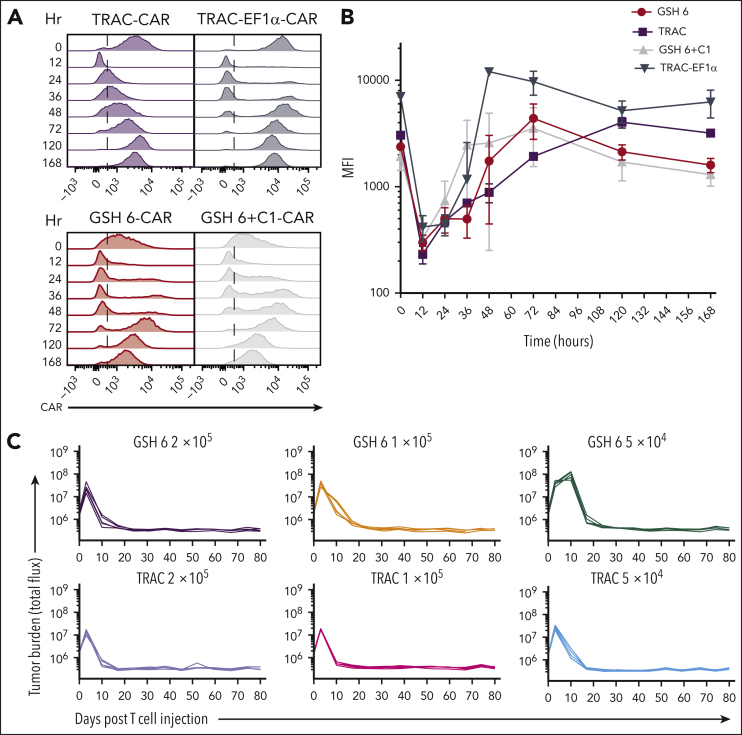
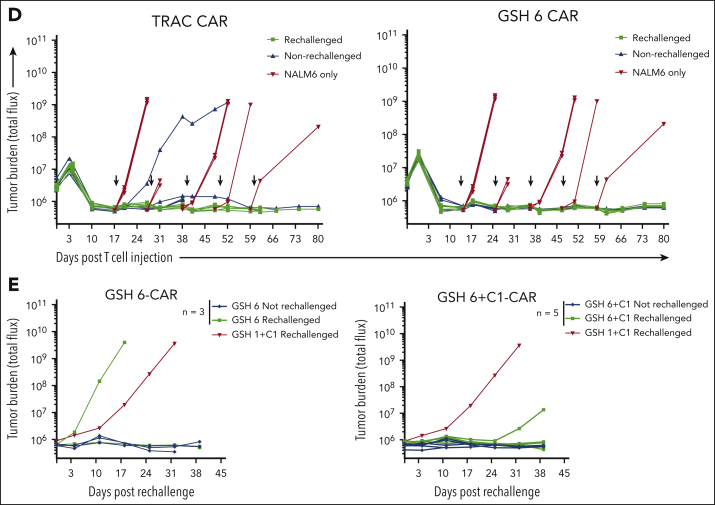
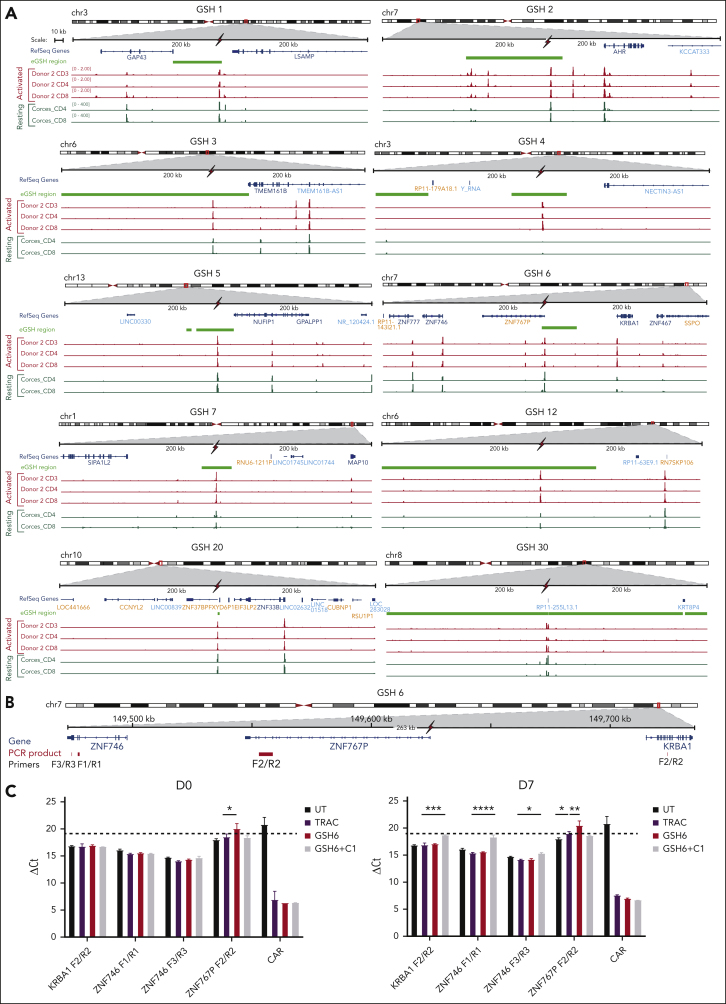
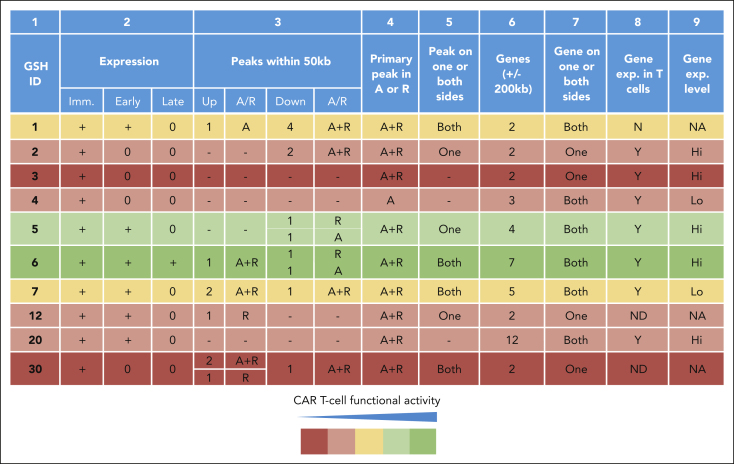
Cell therapies that rely on engineered immune cells can be enhanced by achieving uniform and controlled transgene expression in order to maximize T-cell function and achieve predictable patient responses. Although they are effective, current genetic engineering strategies that use γ-retroviral, lentiviral, and transposon-based vectors to integrate transgenes, unavoidably produce variegated transgene expression in addition to posing a risk of insertional mutagenesis. In the setting of chimeric antigen receptor (CAR) therapy, inconsistent and random CAR expression may result in tonic signaling, T-cell exhaustion, and variable T-cell persistence. Here, we report and validate an algorithm for the identification of extragenic genomic safe harbors (GSH) that can be efficiently targeted for DNA integration and can support sustained and predictable CAR expression in human peripheral blood T cells. The algorithm is based on 7 criteria established to minimize genotoxicity by directing transgene integration away from functionally important genomic elements, maximize efficient CRISPR/Cas9-mediated targeting, and avert transgene silencing over time. T cells engineered to express a CD19 CAR at GSH6, which meets all 7 criteria, are curative at low cell dose in a mouse model of acute lymphoblastic leukemia, matching the potency of CAR T cells engineered at the TRAC locus and effectively resisting tumor rechallenge 100 days after their infusion. The identification of functional extragenic GSHs thus expands the human genome available for therapeutic precision engineering.


Conflict of interest statement

Conflict-of-interest disclosure: A.O. and M.S. have submitted a patent application partially based on data reported in this manuscript. J.F., J. Eyquem, J.M.-S., and M.S. are named inventors on unrelated patent applications in the field of T-cell engineering. Patent applications are submitted by MSKCC. The remaining authors declare no competing financial interests.

The current affiliation for A.O. is Strand Therapeutics Inc, Boston, MA.

The current affiliation for H.Y. is Calico Life Sciences, San Francisco, CA.

The current affiliation for J.F. is Cluster of Excellence iFIT, University Children's Hospital Tübingen, Tübingen, Germany.

The current affiliation for J. Eyquem is University of Califormia San Francisco, Department of Medicine, Division of Hemato-Oncology, San Francisco, CA.

Figures

None
Graphical abstract
Figure 1.
Figure 1.
eGSHs that satisfy criteria 1 to 7 are efficiently targeted by CRISPR/Cas9 to express a functional CAR. (A) GSH atlas safety criteria (blue box) and ATAC-seq atlas criteria (green box). The plot represents ranked average maximum signal intensities of ATAC-seq peaks associated with 379 eGSHs (without pseudogenes atlas) across 7 cell replicates. The top 6 highest-intensity GSH peaks are highlighted. Bars show mean ± standard deviation (SD) of n = 7 cell replicates. (B) Volcano plot depicting the 379 eGSHs centered on the GSH peak with a 5-kb region on each side of the peak in 7 cell samples. Peaks are arranged in decreasing order of their maximum (peak summit) signal intensities. Color indicates the value of signal intensities. The eGSH coverage column depicts the region that falls under GSH criteria 1 to 6 in yellow and the region that falls outside the criteria in blue. (C) Cleavage efficiency at top 6 candidate eGSHs. Above, a zoomed-in view of an example candidate eGSH peak spanning 1865 bps and the 4 gRNAs (indicated in red flash symbols) tested for the eGSH at the summit of the peak. Below, CRISPR/Cas9 cleavage efficiencies of 4 independent gRNAs (each independent symbol) at the 6 top eGSHs. (D) (top) rAAV6 gene cassette for targeted integration with the 1928ζ-1xx CAR construct (EF1α promoter + intron, flanked by 300-bp homology arms). (bottom) Experimental schema for CAR integration and preparation of CAR T cells for in vitro cytotoxicity assays. (E) Flow plots of CAR expression from T cells transduced with GSH-CARs at day 3 after transduction before CAR purification. (F) Cytotoxicity assay for the CD19-CAR targeted at GSH 1, 2, and 3 and the TRAC locus (Firefly luciferase-expressing NALM6 as target cells). Data are shown as mean ± SD of 3 technical replicates from the same donor. RPM, reads per million.
Figure 2.
Figure 2.
eGSHs differentially regulate CAR expression and CAR T-cell function in vitro. (A) Experimental schema for weekly antigenic stimulation of purified CAR+ T cells starting 7 days after transduction. Flow cytometry for CAR expression on day 0, 7, and 14 was performed before plating onto CD19+ aAPCs. (B) CAR expression profile of CAR+ T cells over 2 weeks of antigenic stimulation. (C) Proliferation in response to weekly antigenic stimulation over 2 weeks for cells shown in Figure 2B. Data are shown as cumulative fold change in T-cell numbers, mean, and range of 2 technical replicates. (D) rAAV6 cassette design incorporating chromatin insulator element C1. (E) CAR expression profile of all CAR+ T cells over 2 weeks of antigenic stimulation. Data shown are a representative example of 2 technical replicates. See supplemental Figure 3A-B for quantification of data. (F) Cytotoxicity assay for all CARs shown in panel E, at day 0. Data are shown as mean ± SD of 3 technical replicates. (G) Proliferation of GSH-CAR+ cells shown in panel E over 2 weeks in culture. Data are shown as mean and range from 2 technical replicates. Data from E-G are a representative example from 1 T-cell donor. All experiments have been performed for each construct with at least 2 T-cell donors. aAPCs, artificial antigen presenting cells; UT, untransduced cells used as controls.
Figure 3.
Figure 3.
In vivo anti-tumor efficacy is dependent upon the ability of the targeted GSH to maintain CAR expression over time. (A) Experimental schema for in vivo assessment of tumor burden using CD19-CAR stress-test model for B-acute lymphoblastic leukemia in NSG mice. CAR+ cells were not purified but CAR+ cell numbers were calculated based on flow cytometry. (B) Kaplan Meier tumor-free survival curves for mice administered with GSH 1, 4, and 6 CARs ± insulator C1 and TRAC-CARs. Combined results from 2 experiments with 2 independent T-cell donors (n = 7-12). (C) Tumor burden curves over 90 days in the group of mice from panel B. Some mice with no tumor burden had to be euthanized owing to severe graft-versus-host disease. (D) Total CAR+ T-cell number in the BM of mice 10 days after infusion (results from one representative donor, n = 4-8 mice per group). Data are shown as mean ± SD. (E) Mouse cells were depleted from the BM cells of all mice illustrated in panel D, the remaining cells were pooled by group and an 18 hour cytotoxicity assay was performed with CD19-Ffluc-GFP NALM6 cells at a ratio of 3:1, T cells:NALM6 cells. Cell number calculation was done based on flow cytometry data after mouse cell depletion (supplemental Figures 6B and 8A). Data are not shown for GSH1 CARs because measurement of luciferase was skewed because of the presence of NALM6+ cells (not eliminated by mouse cell depletion) in BM at day 10. Data are shown as mean ± SD of 3 technical replicates from the pooled cells. ∗P < .05; ∗∗P < .01; ∗∗∗P < .001; Mann-Whitney U test. BM, bone marrow; BLI, bioluminescent imaging; Ffluc, firefly luciferase; ns, not significant.
Figure 4.
Figure 4.
GSH6 supports long-term tumor control at low T-cell doses and upon multiple rechallenges. (A) Representative flow plots depicting CAR expression on CAR+ T cells over a week after stimulation with CD19+ aAPCs in vitro. (B) Quantified median fluorescence intensity (MFI) of CAR expression on CAR+ T cells shown in panel A (2 technical replicates each of 2 independent T-cell donors). Data are shown as mean ± SD. (C) Tumor burden in tumor bearing mice administered with GSH6-CARs without insulator C1 and TRAC-CARs at doses 2 × 105, 1 × 105, and 5 × 104 monitored over a period of 80 days after T-cell injection, n = 5. (D) Tumor burden of mice comparing the in vivo efficacy of GSH6-CAR and TRAC-CAR upon 5 tumor rechallenges 10 days apart starting at day 17 after T-cell injection vs no further rechallenge, followed for 80 days after CAR T-cell administration, n = 5 per group. The NALM6 only group represents treatment naïve, age-matched mice injected with NALM6 cells at the rechallenge timepoints (n = 2 mice each for the first 3 time points; n = 1 for the last 2 time points). (E) Tumor burden over 40 days after rechallenge with 1 × 106 NALM6 cells in mice surviving at day 100 after CAR T-cell administration (from Figure 3C). Some mice had to be euthanized or died of graft-vs-host disease, but none of them had tumor at the time of rechallenge.
Figure 4.
Figure 4.
GSH6 supports long-term tumor control at low T-cell doses and upon multiple rechallenges. (A) Representative flow plots depicting CAR expression on CAR+ T cells over a week after stimulation with CD19+ aAPCs in vitro. (B) Quantified median fluorescence intensity (MFI) of CAR expression on CAR+ T cells shown in panel A (2 technical replicates each of 2 independent T-cell donors). Data are shown as mean ± SD. (C) Tumor burden in tumor bearing mice administered with GSH6-CARs without insulator C1 and TRAC-CARs at doses 2 × 105, 1 × 105, and 5 × 104 monitored over a period of 80 days after T-cell injection, n = 5. (D) Tumor burden of mice comparing the in vivo efficacy of GSH6-CAR and TRAC-CAR upon 5 tumor rechallenges 10 days apart starting at day 17 after T-cell injection vs no further rechallenge, followed for 80 days after CAR T-cell administration, n = 5 per group. The NALM6 only group represents treatment naïve, age-matched mice injected with NALM6 cells at the rechallenge timepoints (n = 2 mice each for the first 3 time points; n = 1 for the last 2 time points). (E) Tumor burden over 40 days after rechallenge with 1 × 106 NALM6 cells in mice surviving at day 100 after CAR T-cell administration (from Figure 3C). Some mice had to be euthanized or died of graft-vs-host disease, but none of them had tumor at the time of rechallenge.
Figure 5.
Figure 5.
Examination of surrounding genomic features of eGSHs and association with functional activity. (A) 400-kbp region centered on the GSH peak for GSHs 1 to 6 and GSHs 7, 12, 20, and 30 are shown. The red flash mark indicates the position of the gRNA targeted at each GSH. Indicated are Refseq coding genes in dark blue, noncoding genes in light blue, pseudogenes in orange, and eGSH region in light green, ATAC-seq peaks in activated cells obtained from our data (donor 2 is used as a representative) in red, and in resting cells, obtained from data in the study by Corces et al, in dark green. The signal intensity for both sets of data are scaled to the same range for all panels. (B) The 263 kb genomic region around GSH6 is shown encompassing the 2 closest genes on either side of GSH6. Genes are illustrated in blue and the corresponding polymerase chain reaction (PCR) amplicons used for quantitative reverse transcriptase polymerase chain reaction are shown in red along with their names below. The red flash symbol indicates the gRNA cut site. (C) RNA expression of genes around GSH6 represented as ΔCt in comparison to 18s rRNA. Two primer pairs were used for ZNF746 and 1 each for KRBA1 and ZNF767P. Data are shown as mean ± SD of n = 5 to 9 technical replicates from RNA of CAR T cells at day 0 and day 7 after stimulation on CD19+ aAPCs (CAR protein expression of the same cells is shown in Figure 2E). Dotted line indicates minimum nontemplate control ΔCt value, that is, no expression (taken from CAR expression values in untransduced cells); ∗P < .05; ∗∗P < .01; ∗∗∗P < .001; ∗∗∗∗P < .0001; 2-way ANOVA with Dunnett multiple comparison test.
Figure 6.
Figure 6.
CAR expression, function, and surrounding genomic features at 10 candidate eGSHs. Summary of CAR expression over multiple weekly stimulations, surrounding ATAC-seq peaks, gene presence (including pseudogenes), and expression at all 10 eGSHs. Column 2: Expression in the immediate (Imm.) or day 0, early or day 7, and late or day 14 time points of antigenic stimulation as per data in Figure 2E and supplemental Figure 10C; Column 3: Number of ATAC-seq peaks within 50 kb in activated (A), resting (R), or activated and resting (A+R) state excluding targeted peak upstream (5′) and downstream (3′) of eGSH; Column 4: Presence of targeted ATAC-seq peaks in A, R, or A+R state; Column 5: Presence of surrounding ATAC-seq peaks on one side (upstream/downstream) or both sides of the eGSH within 50 kb; Column 6: Number of genes (coding/noncoding/pseudogene) within 200 kb of eGSH; Column 7: Presence of surrounding genes on one side (upstream/downstream) or both sides of the eGSH; Column 8: Gene expression in T cells (either A or R); Column 9: Average gene expression level of surrounding genes, <100 = Lo and >100 = Hi, according to supplemental Table 2. The GSHs are highlighted with colors based on their CAR T-cell functional activity over time, considering expression and proliferation over 14 days as per the key. A, activated; A+R, activated and resting; exp, expression; Hi, high; Lo, low; Imm., immediate; N, no; ND, not detected; R, resting; Y, yes.

Comment in

  • Splendid isolation.
    Wagner DL, Mamonkin M. Wagner DL, et al. Blood. 2023 Jun 1;141(22):2665-2666. doi: 10.1182/blood.2023019864. Blood. 2023. PMID: 37261853 No abstract available.

References

    1. Dunbar CE, High KA, Joung JK, Kohn DB, Ozawa K, Sadelain M. Gene therapy comes of age. Science. 2018;359(6372) - PubMed
    1. Sadelain M, Rivière I, Riddell S. Therapeutic T cell engineering. Nature. 2017;545(7655):423–431. - PMC - PubMed
    1. June CH, Sadelain M. Chimeric antigen receptor therapy. N Engl J Med. 2018;379(1):64–73. - PMC - PubMed
    1. Dunbar CE. Stem cell gene transfer: Insights into integration and hematopoiesis from primate genetic marking studies. Ann N Y Acad Sci. 2005;1044:178–182. - PubMed
    1. Bushman F, Lewinski M, Ciuffi A, et al. Genome-wide analysis of retroviral DNA integration. Nat Rev Microbiol. 2005;3(11):848–858. - PubMed

Publication types