Center use of technical variant grafts varies widely and impacts pediatric liver transplant waitlist and recipient outcomes in the United States
- PMID: 36746117
- PMCID: PMC10270279
- DOI: 10.1097/LVT.0000000000000091
Center use of technical variant grafts varies widely and impacts pediatric liver transplant waitlist and recipient outcomes in the United States
Abstract
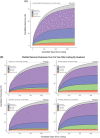
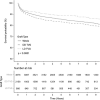
To assess the impact of technical variant grafts (TVGs) [including living donor (LD) and deceased donor split/partial grafts] on waitlist (WL) and transplant outcomes for pediatric liver transplant (LT) candidates, we performed a retrospective analysis of Organ Procurement and Transplantation Network (OPTN) data on first-time LT or liver-kidney pediatric candidates listed at centers that performed >10 LTs during the study period, 2004-2020. Center variance was plotted for LT volume, TVG usage, and survival. A composite center metric of TVG usage and WL mortality was developed to demonstrate the existing variation and potential for improvement. Sixty-four centers performed 7842 LTs; 657 children died on the WL. Proportions of WL mortality by center ranged from 0% to 31% and those of TVG usage from 0% to 76%. Higher TVG usage, from deceased donor or LD, independently or in combination, significantly correlated with lower WL mortality. In multivariable analyses, death from listing was significantly lower with increased center TVG usage (HR = 0.611, CI: 0.40-0.92) and LT volume (HR = 0.995, CI: 0.99-1.0). Recipients of LD transplants (HR = 0.637, CI: 0.51-0.79) had significantly increased survival from transplant compared with other graft types, and recipients of deceased donor TVGs (HR = 1.066, CI: 0.93-1.22) had statistically similar outcomes compared with whole graft recipients. Increased TVG utilization may decrease WL mortality in the US. Hence, policy and training to increase TVG usage, availability, and expertise are critical.
Copyright © 2023 The Author(s). Published by Wolters Kluwer Health, Inc.
Conflict of interest statement
Emily R. Perito consults with BridgeBio and received grants from Albireo and Mirum. The remaining authors have no conflicts to report.
Figures


Comment in
-
Insufficient use of technical variant grafts: An unfulfilled promise in pediatric liver transplantation.Liver Transpl. 2023 Jul 1;29(7):663-664. doi: 10.1097/LVT.0000000000000158. Epub 2023 Apr 18. Liver Transpl. 2023. PMID: 37067384 No abstract available.
References
-
- Kwong AJ, Kim WR, Lake JR, Smith JM, Schladt DP, Skeans MA, et al. . OPTN/SRTR 2019 Annual Data Report: Liver. Am J Transplant. 2021;21(suppl 2):208–315. - PubMed
Publication types
MeSH terms
Grants and funding
LinkOut - more resources
Full Text Sources
Medical
Research Materials

