. 2023 Feb 6;6(4):e202101186.
doi: 10.26508/lsa.202101186. Print 2023 Apr.

The organizer of chromatin topology RIF1 ensures cellular resilience to DNA replication stress

Affiliations

The organizer of chromatin topology RIF1 ensures cellular resilience to DNA replication stress

Rana Lebdy et al. Life Sci Alliance. .

Abstract

Eukaryotic genomes are duplicated from thousands of replication origins that fire sequentially forming a defined spatiotemporal pattern of replication clusters. The temporal order of DNA replication is determined by chromatin architecture and, more specifically, by chromatin contacts that are stabilized by RIF1. Here, we show that RIF1 localizes near newly synthesized DNA. In cells exposed to the DNA replication inhibitor aphidicolin, suppression of RIF1 markedly decreased the efficacy of isolation of proteins on nascent DNA, suggesting that the isolation of proteins on nascent DNA procedure is biased by chromatin topology. RIF1 was required to limit the accumulation of DNA lesions induced by aphidicolin treatment and promoted the recruitment of cohesins in the vicinity of nascent DNA. Collectively, the data suggest that the stabilization of chromatin topology by RIF1 limits replication-associated genomic instability.


Conflict of interest statement

The authors declare that they have no conflict of interest.

Figures
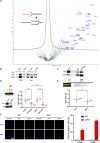
Figure 1.
Figure 1.. RIF1 is associated with nascent DNA and is required to limit DNA lesions in response to prolonged aphidicolin treatment.
(A) iPOND coupled with mass spectrometry. HeLa S3 cells were pulse-labeled with EdU or pulse-labeled with EdU followed by a 120-min thymidine chase, then subjected to iPOND, and analyzed by mass spectrometry. Label-free quantification was performed using MaxQuant (Cox & Mann, 2008) and statistical analysis using Perseus (Tyanova et al, 2016). Pulse experiments have been performed six times and chase experiments four times. Examples of replisome-specific proteins are indicated on the right side of the figure above the line. Full protein list is available in Table S1. (B) Indicated proteins were isolated by iPOND and detected by Western blotting. HeLa S3 cells were pulse-labeled with EdU for 15 min and chased with thymidine for 120 min. In no-click samples, biotin–TEG azide was replaced by DMSO. (C) Western blot analysis of indicated proteins after immunoprecipitation with an antibody directed against PCNA or against mouse IgG. (D) DNA fiber labeling and Western blot analysis of RIF1 depletion. HeLa S3 cells were labeled for 30 min with IdU and then for 30 min with CldU in the absence or presence of 0.05 μM aphidicolin (APH) in the cell culture medium. Graphic representation of the ratios of CldU versus IdU tract length. For statistical analysis, a Mann–Whitney test was used, ns, non-significant; ****P < 0.0001. The horizontal bar represents the median with the value indicated in red. 50 replication tracts were measured for each experimental condition. (E) Analysis of DNA resection using DNA fiber labeling. HeLa S3 cells were labeled for 30 min with IdU and then for 30 min with CldU. 1 μM aphidicolin (APH) was added in the cell culture medium for 6 h. Graphic representation of the ratios of CldU versus IdU tract length. For statistical analysis, a Mann–Whitney test was used, ****P < 0.0001. The horizontal bar represents the median with the value indicated in red. 50 replication tracts were measured for each experimental condition. (F) Immunofluorescence analysis of γH2A.X and RIF1 in HeLa S3 cells with siRNA against control or RIF1 in the presence or absence of aphidicolin (APH) for 24 h. Graphic representation of the percentage of γH2A.X–positive cells based on three independent experiments.
Figure S1.
Figure S1.. Impact of RIF1 depletion on replication stress.
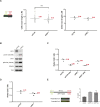
(A) DNA fiber labeling. HeLa S3 cells were labeled for 30 min with IdU and then for 30 min with CldU. Graphic representation of the ratios of CldU tract length. The horizontal bar represents the median with the value indicated in red. For statistical analysis, a Mann–Whitney test was used, ns, non-significant. At least 50 replication tracts were measured for each experimental condition. The second graphic representation is showing the average of four independent experiments. (B) Western blot analysis of the indicated proteins upon transfection with siRNA directed against RIF1 or a control target. (C) This graphic representation is showing the average of the three independent experiments from Fig 1D. (D) This graphic representation is showing the average of the three independent experiments from Fig 1E. (E) Analysis of replication restart upon APH treatment using DNA fiber labeling. HeLa S3 cells were labeled for 30 min with IdU, then treated 16 h with 10 μM APH and then for 30 min with CldU. Graphic representation of the percentage of restart based on three independent experiments.
Figure 2.
Figure 2.. RIF1 depletion alters S-phase organization and yields DNA lesions.
(A) Experimental setup to study the impact of synchronization procedure in HeLa S3 cells depleted or not for RIF1. The efficacy of RIF1 depletion using two different shRNAs is shown. For synchronization, cells were grown 18 h in the presence of 2 mM thymidine, then released into the S phase for 2 h. Cells were then subjected to immunofluorescence, Western blot, or DNA fiber analyses. (B) Immunofluorescence analysis of γH2A.X and EdU in asynchronous and synchronous HeLa S3 cells expressing shRNAs against luciferase or RIF1. (C) Graphic representation of the frequency of replication patterns (Late-S, Mid-S, and Early-S) based on at least three independent experiments for each condition. (D) Quantification of γH2A.X intensity within nucleus stained with Hoechst using CellProfiler based on at least three independent experiments for each condition. (E) Western blot analysis of Chk1 phosphorylation on serine 345 upon RIF1 depletion. (F) DNA fiber assay. HeLa S3 cells were labeled for 30 min with IdU and then for 30 min with CldU. Graphic representation of CldU tract lengths. For statistical analysis, a Mann–Whitney test was used, ns, non-significant; ****P < 0.0001. The horizontal bar represents the median with the value indicated in red. At least 50 replication tracts were measured for each experimental condition.
Figure S2.
Figure S2.. Impact of RIF1 depletion on replication forks dynamic upon synchronization in G1 and release into S-phase.
(A) Flow cytometry analysis of cells depleted or not for RIF1 in asynchronous or synchronous conditions (18-h thymidine block followed by 2-h release). DNA was stained using propidium iodide. (B) This graphic representation is showing the average of the three independent experiments from Fig 2F.
Figure 3.
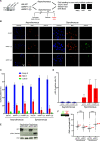
Figure 3.. RIF1 loss reduces the efficacy of protein isolation on nascent DNA.
(A) Experimental setup. (B) iPOND experiment. HeLa S3 cells (with shLUC or two different shRIF1) were labeled with EdU for 15 min or for 30 min with 0.1 μM aphidicolin (APH). Indicated proteins were analyzed by Western blotting. In no-click samples, biotin–TEG azide was replaced by DMSO. (C) iPOND-MS experiment. HeLa S3 cells (with shLUC or two different shRIF1) were labeled with EdU for 30 min EdU with 0.1 μM aphidicolin (APH). Quantification of peptide intensity for each protein was performed using MaxQuant; individual values are available in Table S2. The ratios of shRIF1 (1) or shRIF1 (2) versus shLUC are shown. The error bars represent the variation of two experiments for shRIF1 (1) and three experiments for shRIF1 (2). Because of normalization, there are no error bars for shLUC, but the experiment was performed three times. (D) Analysis of EdU incorporation using microscopy in HeLa S3 cells with shRNA against luciferase or RIF1. EdU was incorporated in cells during 15 min with or without 0.1 μM aphidicolin (APH). (E) Quantification of EdU intensity within nucleus stained with Hoechst was performed using CellProfiler and is represented on the histogram. Error bars correspond to the average values of three independent experiments. (F) DNA fiber labeling. HeLa S3 cells were labeled for 30 min with IdU and then for 30 min with CldU in the absence or presence of 0.05 μM aphidicolin (APH) in the cell culture medium. Graphic representation of the ratios of CldU versus IdU tract length. For statistical analysis, a Mann–Whitney test was used, ****P < 0.0001. The horizontal bar represents the median with the value indicated in red. At least 50 replication tracts were measured for each experimental condition.
Figure S3.
Figure S3.. Treatment of RIF1 depleted-cells with aphidicolin does not perturb DNA synthesis or replisome stability.
(A) Repetition of DNA fiber experiment from Fig 3F. HeLa S3 cells were labeled for 30 min with IdU and then for 30 min with CldU in the absence or presence of 0.05 μM aphidicolin (APH) in the cell culture medium. Graphic representation of the ratios of CldU versus IdU tract length. For statistical analysis, a Mann–Whitney test was used, ****P < 0.0001. The horizontal bar represents the median with the value indicated in red. At least 50 replication tracts were measured for each experimental condition. (B) Western blot analysis of indicated proteins after immunoprecipitation with an antibody directed against PCNA or against mouse IgG. When indicated, HeLa S3 cells (shLUC or shRIF1) were treated for 30 min with 0.1 μM aphidicolin (APH).
Figure 4.
Figure 4.. iPOND protein recovery is biased by replication organization.
(A) Experimental setup. HeLa S3 cells were submitted to the thymidine block for 18 h and released into the S phase. Cells were collected at T0 (G1), T2 (Early-S), T4 (Mid-S), and T8 (Late-S) after a 15-min EdU pulse for iPOND and flow cytometry. Replication patterns showing the different phases are represented. (B) The percentage of cells in each phase was analyzed using flow cytometry. The error bars represent the variations within three independent experiments. (C) iPOND experiment performed on unsynchronized and synchronized cells and analyzed by Western blot using antibodies directed against the indicated proteins. In no-click samples, biotin–TEG azide was replaced by DMSO. (D) Quantification of the indicated proteins in iPOND based on at least three independent experiments; T0 was used for normalization.
Figure S4.
Figure S4.. Putative impact of cell synchonization on replication factories.
(A) Flow cytometry analysis of asynchronous HeLa S3 cells blocked for 18 h with thymidine (T0), then released for 2 (T2), 4 (T4), and 8 (T8) hours. Total DNA was stained using propidium iodide and newly synthesized DNA by EdU labeled with Alexa Fluor 488 using click chemistry. (B) Scheme explaining how replication organization is impacting iPOND efficiency.
Figure 5.
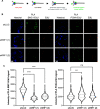
Figure 5.. RIF1 is required for full recruitment of cohesin subunits at stalled forks.
(A) Scheme explaining the principle of proximity ligation assay (PLA) between EdU and replisome components. (B) Immunofluorescence analysis of PLA signal between EdU and SMC1 and between EdU and PCNA upon 30-min treatment with 0.1 μM APH in HeLa S3 cells expressing shRNAs against luciferase or RIF1. EdU-positive cells were labeled with Alexa Fluor 555. (C) Level of PLA signal within the nucleus was quantified using CellProfiler. Graphic representation of the PLA signal; at least 100 cells were quantified in each condition. For statistical analysis, a Mann–Whitney test was used, ns, non-significant; ****P < 0.0001; and ***P < 0.001.
Figure S5.
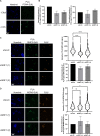
Figure S5.. RIF1 is required for full recruitment of SMC3 at replication forks.
(A) Immunofluorescence analysis of PLA signal between EdU and PCNA; in −click control, the biotin–TEG azide was replaced by DMSO. (B) Graphic representation of the average PLA signal (normalized to 100 in shLUC) from three independent experiments corresponding to Fig 5C. (C) Immunofluorescence analysis of PLA signal between EdU and SMC3 upon 30-min treatment with 0.1 μM APH in HeLa S3 cells expressing shRNAs against luciferase or RIF1. EdU-positive cells were labeled with Alexa Fluor 555. The level of PLA signal within the nucleus was quantified using CellProfiler. Graphic representation of the PLA signal; at least 100 cells were quantified in each condition. For statistical analysis, a Mann–Whitney test was used, ****P < 0.0001. Graphic representation of the average PLA signal (normalized to 100 in shLUC) from three independent experiments. (D) Immunofluorescence analysis of PLA signal between EdU and MCM5 upon 30-min treatment with 0.1 μM APH in HeLa S3 cells expressing shRNAs against luciferase or RIF1. EdU-positive cells were labeled with Alexa Fluor 555. The level of PLA signal within the nucleus was quantified using CellProfiler. Graphic representation of the PLA signal; at least 100 cells were quantified in each condition. For statistical analysis, a Mann–Whitney test was used, ****P < 0.0001. Graphic representation of the average PLA signal (normalized to 100 in shLUC) from three independent experiments.
Figure S6.
Figure S6.. RIF1 depletion does not impact the expression of SMC1 and SMC3.
Immunofluorescence analysis of SMC1 and SMC3. Graphic representation of the average SMC1 and SMC3 intensity within nucleus (normalized to 100 in shLUC) from three independent experiments.
Figure 6.
Figure 6.. Putative model to explain the role of RIF1 in the organization of replication factories.
RIF1 may stabilize chromatin topology during DNA replication, thus preventing DNA resection by nucleases or excessive origin activation. This could be direct, thanks to its capacity to interact with DNA, or/and via the recruitment of cohesin. In the absence of RIF1, the replication domains may be unprotected leading to DNA resection, DNA lesions, and activation of DNA damage response.

Similar articles

Cited by

References

    1. Alabert C, Bukowski-Wills JC, Lee SB, Kustatscher G, Nakamura K, de Lima Alves F, Menard P, Mejlvang J, Rappsilber J, Groth A (2014) Nascent chromatin capture proteomics determines chromatin dynamics during DNA replication and identifies unknown fork components. Nat Cell Biol 16: 281–291. 10.1038/ncb2918 - DOI - PMC - PubMed
    1. Aranda S, Rutishauser D, Ernfors P (2014) Identification of a large protein network involved in epigenetic transmission in replicating DNA of embryonic stem cells. Nucleic Acids Res 42: 6972–6986. 10.1093/nar/gku374 - DOI - PMC - PubMed
    1. Arnould C, Rocher V, Finoux AL, Clouaire T, Li K, Zhou F, Caron P, Mangeot PE, Ricci EP, Mourad R, et al. (2021) Loop extrusion as a mechanism for formation of DNA damage repair foci. Nature 590: 660–665. 10.1038/s41586-021-03193-z - DOI - PMC - PubMed
    1. Balasubramanian S, Andreani M, Andrade JG, Saha T, Sundaravinayagam D, Garzon J, Zhang W, Popp O, Hiraga SI, Rahjouei A, et al. (2022) Protection of nascent DNA at stalled replication forks is mediated by phosphorylation of RIF1 intrinsically disordered region. Elife 11: e75047. 10.7554/elife.75047 - DOI - PMC - PubMed
    1. Blow JJ, Ge XQ, Jackson DA (2011) How dormant origins promote complete genome replication. Trends Biochem Sci 36: 405–414. 10.1016/j.tibs.2011.05.002 - DOI - PMC - PubMed

Publication types

MeSH terms

LinkOut - more resources