. 2023 Feb 6;6(4):e202201494.
doi: 10.26508/lsa.202201494. Print 2023 Apr.

Inflammasome-independent NLRP3 function enforces ATM activity in response to genotoxic stress

Affiliations

Inflammasome-independent NLRP3 function enforces ATM activity in response to genotoxic stress

Mélanie Bodnar-Wachtel et al. Life Sci Alliance. .

Abstract

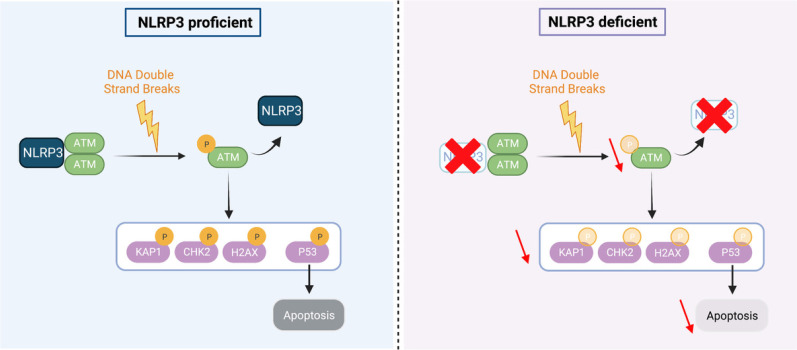
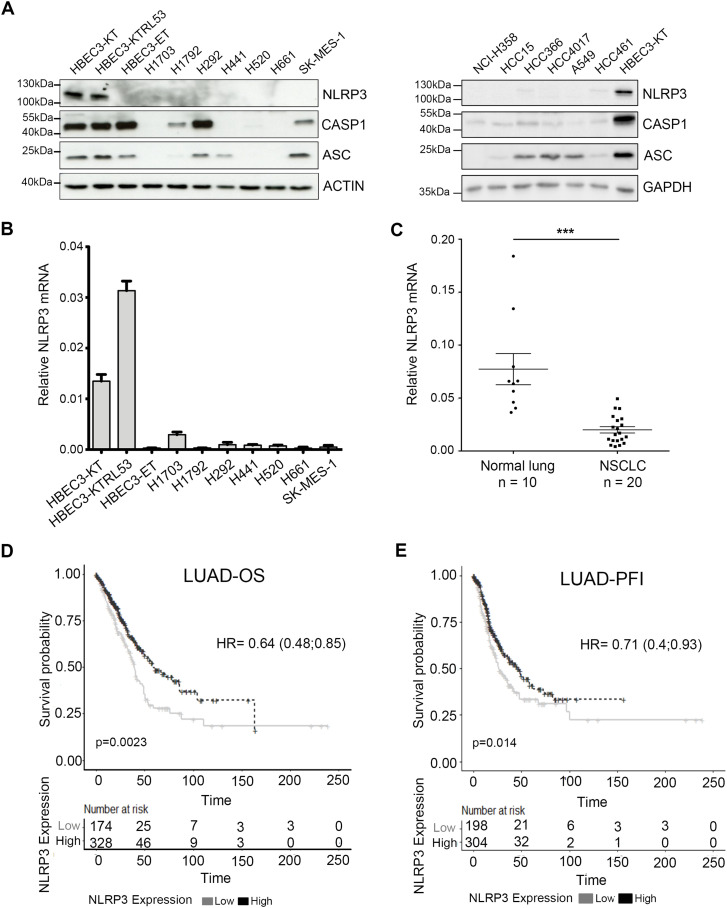
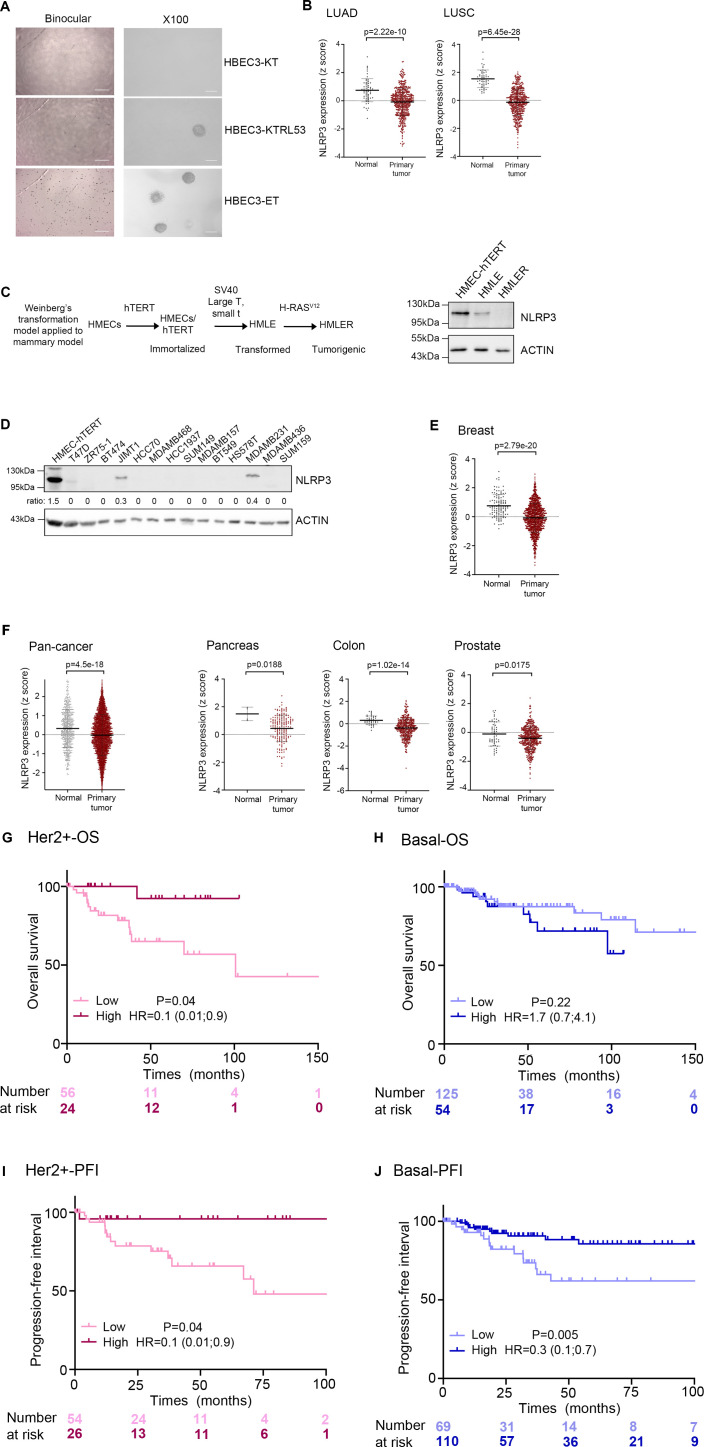
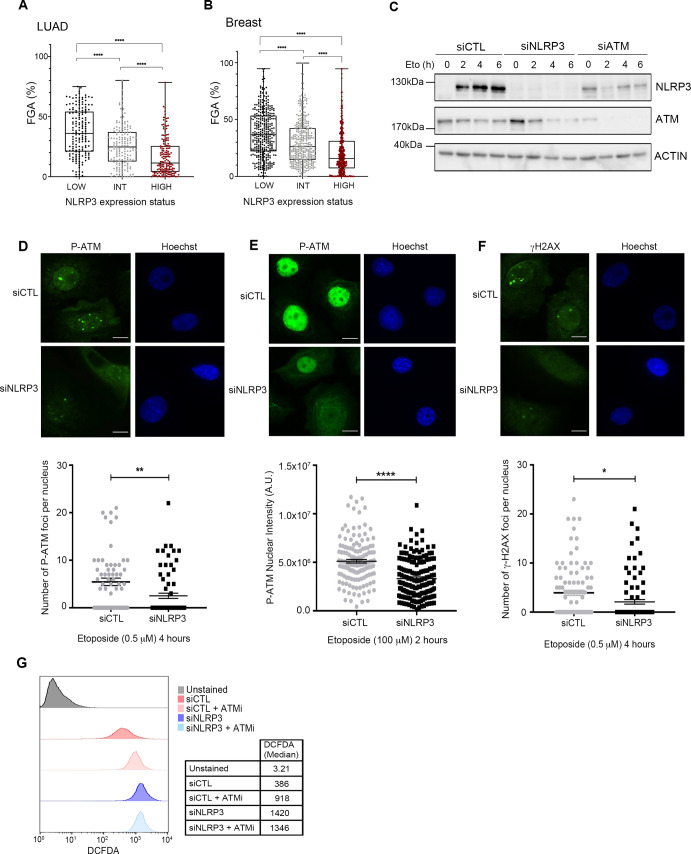
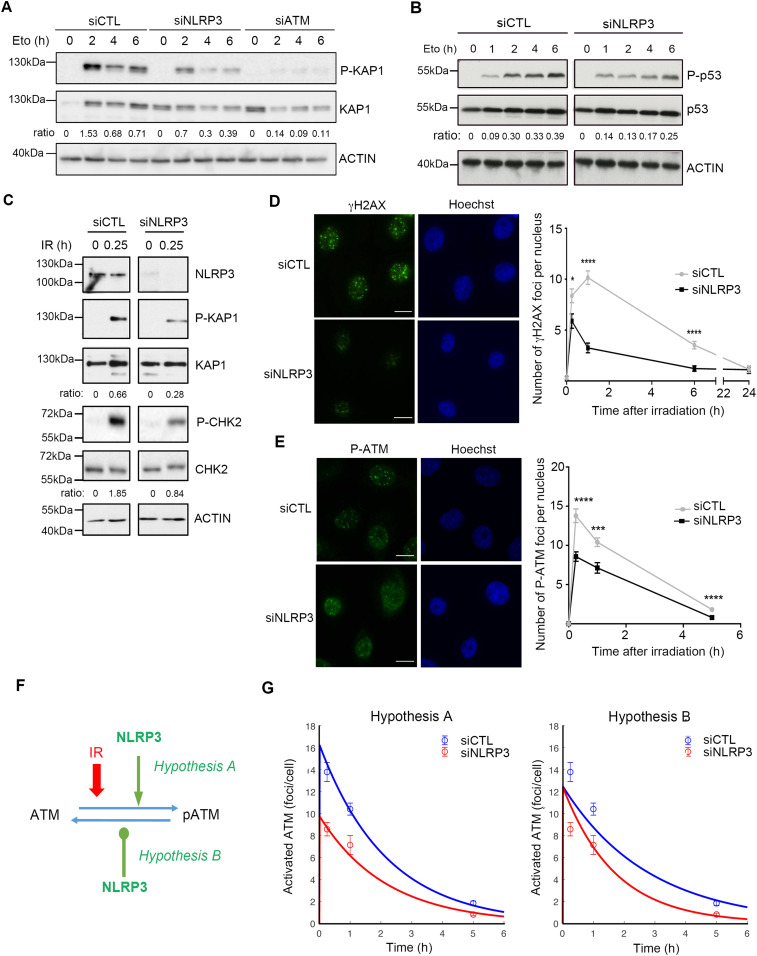
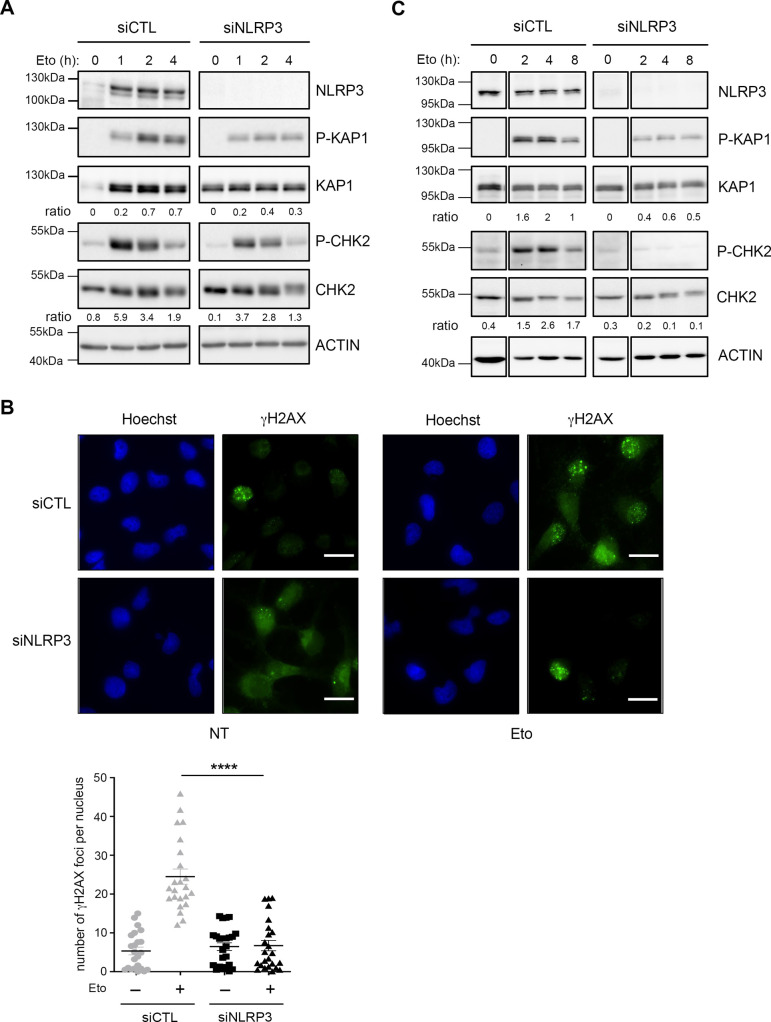
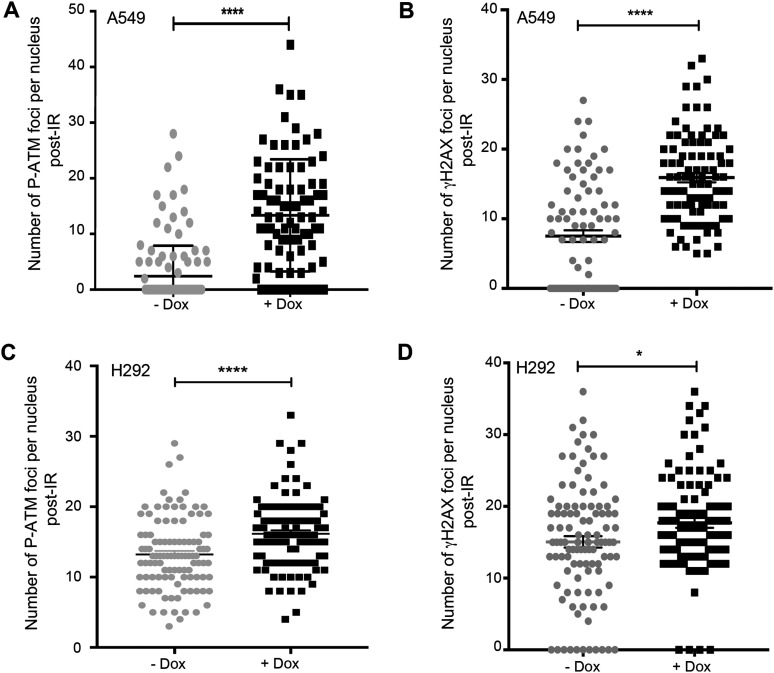
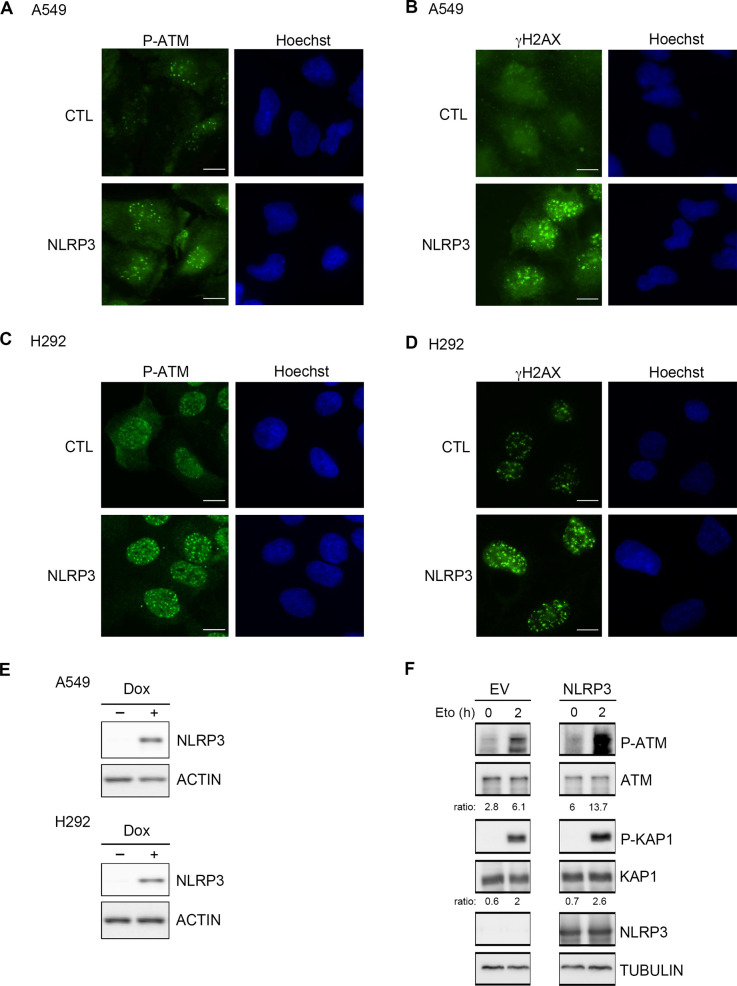
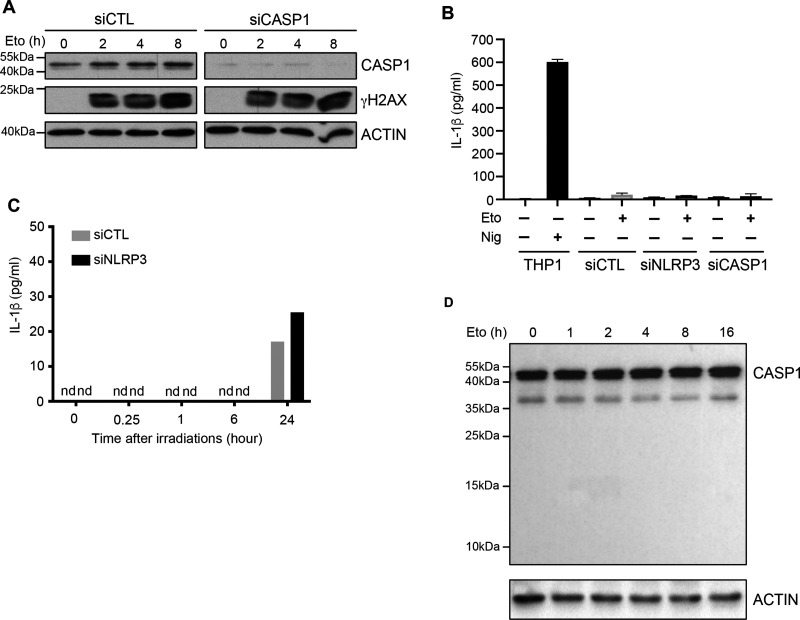
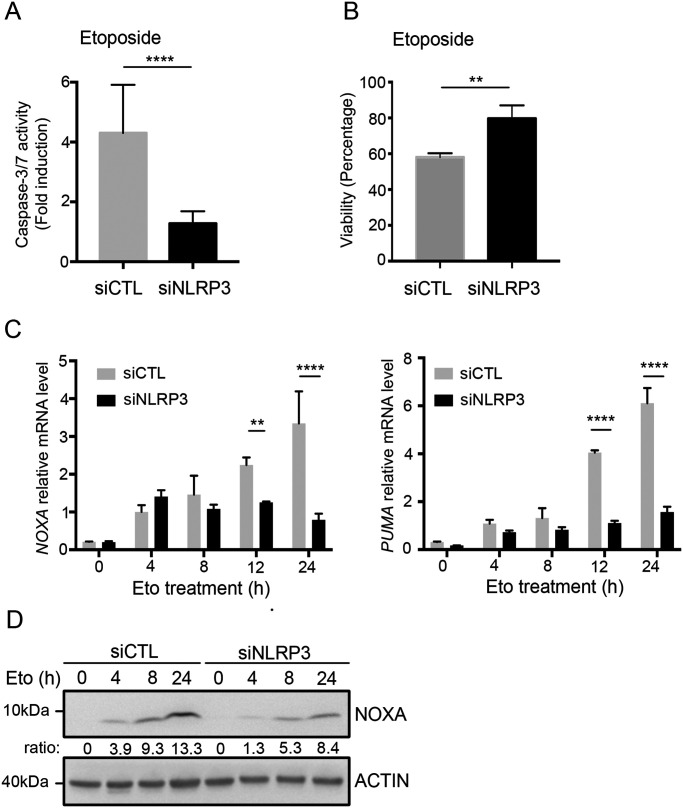
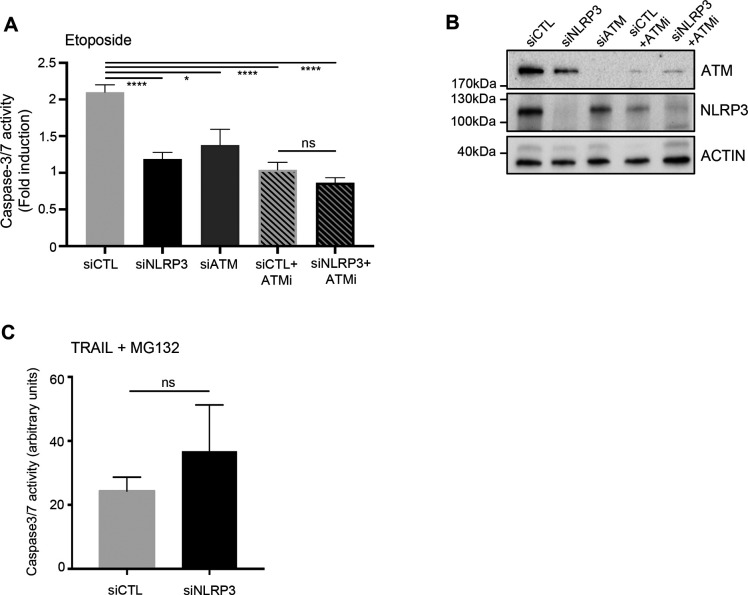
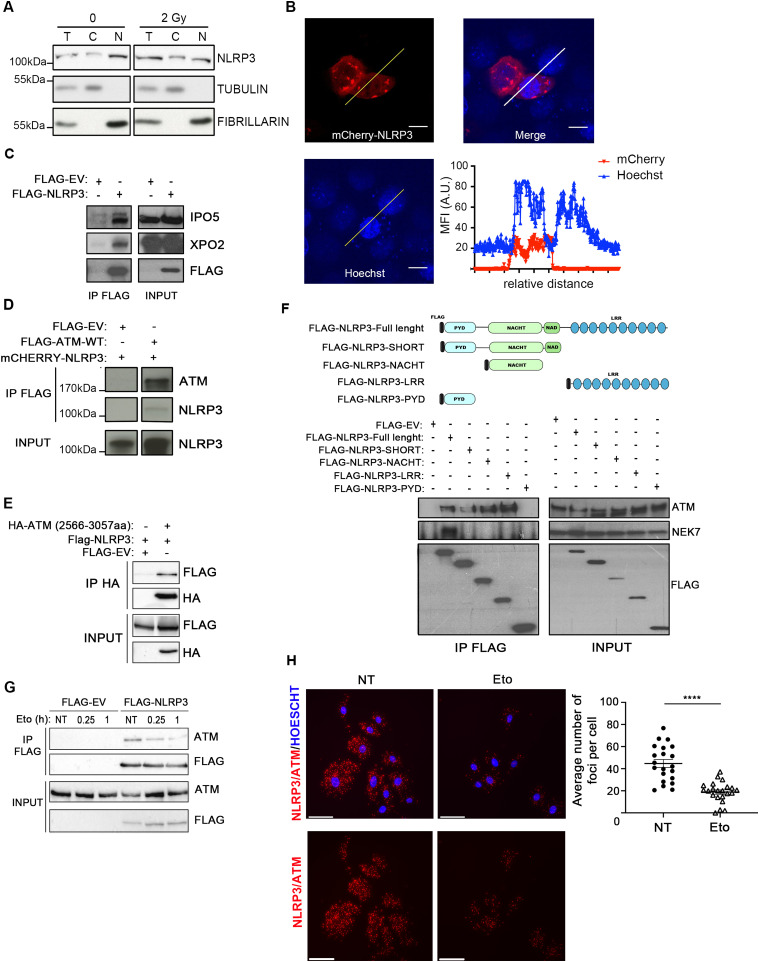
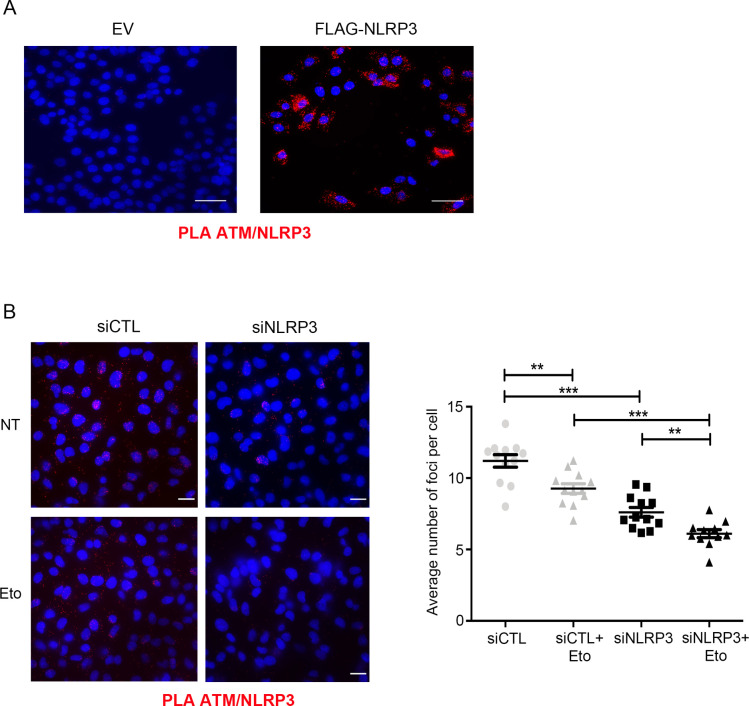
NLRP3 is a pattern recognition receptor with a well-documented role in inducing inflammasome assembly in response to cellular stress. Deregulation of its activity leads to many inflammatory disorders including gouty arthritis, Alzheimer disease, and cancer. Whereas its role in the context of cancer has been mostly explored in the immune compartment, whether NLRP3 exerts functions unrelated to immunity in cancer development remains unexplored. Here, we demonstrate that NLRP3 interacts with the ATM kinase to control the activation of the DNA damage response, independently of its inflammasome activity. NLRP3 down-regulation in both broncho- and mammary human epithelial cells significantly impairs ATM pathway activation, leading to lower p53 activation, and provides cells with the ability to resist apoptosis induced by acute genotoxic stress. Interestingly, NLRP3 expression is down-regulated in non-small cell lung cancers and breast cancers, and its expression positively correlates with patient overall survival. Our findings identify a novel non-immune function for NLRP3 in maintaining genome integrity and strengthen the concept of a functional link between innate immunity and DNA damage sensing pathways to maintain cell integrity.


Conflict of interest statement

The authors declare that they have no conflict of interest.

Figures

None
Graphical abstract
Figure 1.
Figure 1.. NLRP3 expression is reduced in human NSCLC compared with healthy tissue.
(A) Protein levels of NLRP3 and the inflammasome components, namely, caspase-1 (CASP1) and ASC, were assessed by immunoblotting in HBEC3 cells and a panel of NSCLC lines. Actin and GADPH served as loading controls. (B) Relative NLRP3 mRNA levels determined by Q-RT-PCR in HBEC3 cells and in a panel of NSCLC cell lines normalized against the ubiquitous esterase-D. Results are representative of more than three experiments. (C) Relative NLRP3 mRNA levels were determined by Q-RT-PCR in a cohort of non-treated primary tumors from NSCLC patients (n = 20) and the corresponding normal lung tissues (n = 10) normalized against esterase-D and HPRT1. Data represent mean ± SEM; ***P < 0.001 (t test). (D, E) Kaplan–Meier plots of patient overall survival (D) and progression free interval (E) in TCGA–LUAD dataset according to NLRP3 expression levels, time is shown in months; patients were stratified according to the cutoff obtained from maximally selected rank statistics.
Figure S1.
Figure S1.. NLRP3 expression is reduced during malignant cell transformation and in cancer tissues.
(A) Anchorage-independent growth ability was assessed in HBEC3 cell lines (×4, ×100). (B) Expression of NLRP3 in 515 LUAD or 501 LUSC primary tumors compared with 59 and 51 lung normal tissues, respectively, from pan-cancer TCGA dataset. The differences between the median values of each two groups were compared using the Welch’s t test on the UCSC Zena browser. (C) Upper panel, diagram recapitulating the different stages of immortalization and transformation of HMECs (Elenbaas et al, 2001), lower panel, immunoblot showing the expression of NLRP3 in the different HMEC cell lines. (D) Immunoblot showing NLRP3 expression in breast cancer cell lines. Actin was used as a loading control. The ratio between NLRP3/actin is shown. (E) Expression of NLRP3 in 1,097 breast primary tumors compared with 132 breast normal tissues from TCGA. The differences between the median values of the two groups were compared using the Welch’s t test on the UCSC Zena browser. (F) Expression of NLRP3 in 9,701, 178, 449, and 178 primary tumors from pan-cancer, pancreatic, colon, and prostate, respectively, compared with normal tissues from TCGA. (G, H, I, J) Kaplan–Meier plots of patient overall survival for HER2+ (G) and basal (H) breast cancers, and progression-free interval for HER2+ (I) and basal (J) in TCGA breast cancers dataset according to NLRP3 expression levels, time is shown in months; patients were stratified according to the cutoff obtained from maximally selected rank statistics.
Figure S2.
Figure S2.. ATM activity is reduced in the absence of NLRP3 in response to DSBs in lung epithelial cells.
(A, B) Fraction of the genome altered (FGA) in 165 LUAD (A) or in 355 breast tumors (B) according to the NLRP3 expression status. (C) Immunoblot showing the efficacy of transfected siRNA in HBEC3-KT. (D, E, F) HBEC3-KT cells transfected with control or NLRP3 siRNA were treated with 0.5 μM etoposide (D, F) or 100 μM etoposide (Eto) (E), and P-ATM (D) and γH2AX (F) nuclear foci were counted or (E) P-ATM nuclear was assessed using mean fluorescence intensity was quantified (×60); Hoechst (blue) was used to stain nuclei. Scale bar 10 μm. Data shown represent mean ± SEM; *0.05 < P, **0.01 < P, ****0.0001 < P (unpaired t test). One experiment representative of two independent experiments. (G) ROS measurement was performed on HBEC3-KT cells transfected with CTL or NLRP3 siRNA using the DCFDA probe in the presence or absence of 5 μM ATMi KU55933. Data from one representative experiment out of three is shown.
Figure 2.
Figure 2.. NLRP3 is instrumental to achieve maximal ATM activation in response to DSBs.
(A) HBEC3-KT transfected with indicated siRNA were treated with 100 µM etoposide (Eto) and collected at different time points, and P-KAP1 (Ser824) was analyzed by immunoblot, the ratio between P-KAP1/KAP1 is shown. One experiment representative of three experiments. (B) P-p53 (Ser15) was assessed by immunoblot in HBEC3-KT transfected with siCTL or siNLRP3 treated with 100 µM etoposide. The ratio between P-p53/p53 is shown. One experiment represents three. (C) HBEC3-KT transfected with siCTL or siNLRP3 was irradiated (10 Gy), and P-KAP1 and P-CHK2 (Thr68) were analyzed by immunoblot 15 min after IR. The ratio between P-KAP1/KAP1 and P-CHK2/CHK2 is shown. Representative of two experiments. Actin was used as a loading control for all immunoblots. (D, E) HBEC3-KT transfected with siCTL or siNLRP3 was irradiated (2 Gy), and γH2AX (D) and P-ATM (E) foci were assessed by IF at the indicated time. Hoechst was used as a nuclear stain. Representative of three independent experiments. Data represent mean ± SEM, ****P < 0.0001, ***P < 0.001, *P < 0.05, (unpaired t test). 64≤ n ≥148, n is the number of nuclei counted. Scale bars 10 µm. (A, B, F) Schematic diagram displaying the hypothesis used for mathematical modeling of ATM and NLRP3 interactions, showing the two hypotheses investigated (A) NLRP3 enhances ATM activation and (B) NLRP3 inhibits ATM deactivation. (G) Mathematical modeling of ATM and NLRP3 interactions. The curve represents the mathematical model, and the dots represent the experimental data.
Figure S3.
Figure S3.. NLRP3 is instrumental in achieving maximal ATM activation in response to DSBs in mammary epithelial cells.
(A) HMEC-hTERT transfected with indicated siRNA were treated with 10 μM etoposide (Eto) and collected at different time points, and P-KAP1(Ser824) and P-CHK2 (Thr68) were analyzed by immunoblot. The ratio between P-KAP1/KAP1 and P-CHK2/CHK2 are shown. Representative of two independent experiments. (B) MDA-MB-231 cells transfected with indicated siRNA were treated with 0.5 μM Eto, fixed, and γH2AX foci were quantified by IF. Hoechst (blue) was used to stain nuclei (×40). Representative of three independent experiments. Unpaired t test P < 0.0001, Scale bar 20 μm. (C) MDA-MB-231 cells transfected with indicated siRNA were treated with 10 μM Eto and collected at different time points, P-KAP1 (ser824) and P-CHK2 (Thr68) were analyzed by immunoblot. The ratio between P-KAP1/KAP1 and P-CHK2/CHK2 are shown. Representative of two independent experiments. Actin was used as a loading control (A, C).
Figure 3.
Figure 3.. Expression of NLRP3 in NSCLC cell lines results in increased ATM activation after the induction of DNA DSBs.
(A, B, C, D) A549 (A, B) or H292 (C, D) cells stably expressing a doxycycline-inducible NLRP3 lentiviral vector (pSLIK-NLRP3) induced (+Dox) or not (−Dox) with 0.5 µg/ml doxycycline for 24 h were irradiated with 2 Gy, and P-ATM (A, C) and γH2AX (B, D) foci were assessed 1 h post-treatment (n ≥ 103 cells). ****P < 0.0001, *P < 0.05 (unpaired t test).
Figure S4.
Figure S4.. NLRP3 re-expression in tumoral cell lines facilitates ATM-dependent DNA damage signaling.
(A, B, C, D) Immunofluorescence images corresponding to Fig 3 graphs. A549 (A, B) or H292 (C, D) stably expressing a doxycycline-inducible NLRP3 lentiviral vector treated or not with 0.5 μM of doxycycline were irradiated with 2 Gy and analyzed 1 h later. (A, B, C, D) Representative pictures of P-ATM (A, C) and γH2AX (B, D) IF staining, which were quantified in Fig 3 (A, B, C, D). (×60), Hoechst (blue) was used to stain nuclei. Scale bars 10 μm. (E) Immunoblot showing NLRP3 expression in A549 and H292 cells. Actin served as a loading control. (F) HEK293T cells transfected with empty (CTL) or NLRP3-expressing plasmid were treated with etoposide (Eto) 100 μM for 2 h. Cells were lysed, and protein extracts were analyzed for NLRP3, P-ATM, ATM, P-KAP1, and KAP1 by immunoblot. The ratio between P-ATM/ATM and P-KAP1/KAP1 is shown. Tubulin served as a protein loading control. Representative of two independent experiments.
Figure 4.
Figure 4.. NLRP3 controls the DDR in an inflammasome-independent manner.
(A) HBEC3-KT control (siCTL) or caspase-1 siRNA (siCASP1) were treated with 100 µM of etoposide (Eto), and γH2AX phosphorylation was monitored by immunoblotting. Actin served as a loading control. (B) HBEC3-KT transfected with either control, NLRP3, or caspase-1 (CASP1) siRNA were treated with Eto (100 µM) 8 h, and IL-1β was quantified in cell supernatants by ELISA. Differentiated THP1 treated with nigericin for 3 h were used as a positive control for IL-1β secretion. (C) IL-1β secretion measurement at different time points in irradiated (2 Gy) HBEC3-KT transfected with control or NLRP3 siRNA using the Luminex assay. (D) HBEC3-KT cells were treated with 100 µM Eto over time, and caspase-1 cleavage was analyzed by immunoblotting. Actin served as a loading control. These data are one representative experiment out of two independent experiments. n.d, not detected.
Figure 5.
Figure 5.. The absence of NLRP3 confers resistance to acute genotoxic stress.
(A, B) HBEC3-KT transfected with the indicated siRNA were treated with 50 µM etoposide (Eto) and (A) caspase-3/7 activity was measured by luminometry and (B) cell survival using the crystal violet cytotoxicity test. ****P < 0.0001, **P < 0.01 (unpaired t test). Results are representative of three independent experiments. (C) NOXA and PUMA expressions were assessed in HBEC3-KT treated with 50 µM Eto at the indicated time points by Q-RT-PCR relative to HPRT1 expression. (D) ****P < 0.0001, **P < 0.01 (multiple unpaired t test) (D) NOXA expression was assessed by immunoblot. Actin was used as a loading control. The ratio between NOXA and actin is shown. Representative of two independent experiments.
Figure S5.
Figure S5.. NLRP3 deficiency confers resistance to acute genotoxic stress but does not affect the extrinsic apoptosis pathway.
(A) HBEC3-KT cells transfected with indicated siRNA in the absence or presence of an ATM inhibitor KU55933 (ATMi) were treated with etoposide (Eto) (50 μM) for 12 h and caspase-3/7 activity was assessed by luminometry. (B) Immunoblots show the efficacy of siRNA transfections. Actin served as a control. (C) HBEC3-KT cells transfected with control or NLRP3 siRNA were treated with TRAIL 200 ng/ml and MG132 1 mM for 12 h to induce death receptor-mediated apoptosis. Data represent mean ± SEM; ns, not significant (unpaired t test). Representative of two independent experiments. ****P < 0.0001, *P < 0.05 (unpaired t test).
Figure 6.
Figure 6.. NLRP3 forms a complex with ATM.
(A, C) HBEC3-KT untreated (0) or irradiated (2 Gy) were fractionated, and NLRP3 expression was analyzed by immunoblot from the cytosolic (C) and nuclear (N) fractions. Tubulin was used as a marker of the cytosolic fraction and fibrillarin of the nuclear fraction. T is total lysate. Representative of three independent experiments. (B) NLRP3 was detected in the cytosolic and nuclear compartments in live confocal imaging of mCherry-NLRP3 transfected H292 cells. The graph displays mean fluorescence intensity (arbitrary unit) according to the relative distance. Vital Hoechst was used to stain nuclei. Scale bar 10 µm (×100). (C, D) Immunoblot of HeLa cells transfected with FLAGempty vector (EV) or FLAG-NLRP3 (INPUT) after FLAG immunoprecipitation (IP FLAG) (D) immunoblot of HeLa cells transfected with indicated vectors after IP FLAG. Representative of three independent experiments. (E) Immunoblot of HeLa cells transfected with a Flag-EV, FLAG-NLRP3, and HA-ATM kinase domains (2,566–3,057) after IP HA. Representative of two independent experiments. (F) Different FLAG-tagged NLRP3 domain constructs were transfected into HeLa cells, and FLAG-proteins were immunoprecipitated. Pulled-down proteins were analyzed by immunoblot. Representative of two independent experiments. (G). Immunoblots of HeLa cells transfected with Flag-EV or FLAG-NLRP3 after FLAG IP in the presence or absence of etoposide (Eto) (50 µM) for the indicated time points. The presence of endogenous ATM was analyzed in the INPUT panel and in the IP FLAG. (H) Representative of three independent experiments (H) proximity ligation assay was performed in HBEC3-KT cells treated or not with Eto 50 µM for 2 h (number of nuclei analyzed 286≤ n ≥302) using anti-ATM and anti-NLRP3 (×40). Representative of two independent experiments. DAPI (blue) was used to stain nuclei. Scale bars 50 µm. Signal quantification is shown on the graph on the right panel. NT, not treated. ****P < 0.0001 (unpaired t test).
Figure S6.
Figure S6.. NLRP3 and ATM form a complex.
(A) Proximity ligation assay to detect the interaction between ATM/NLRP3 in HeLa cells transfected with an empty vector (EV) or FLAG-NLRP3. Scale bar 100 μm (×40). (B) Proximity ligation assay to detect the interaction between endogenous ATM/NLRP3 in MDA-MB-231 transfected with indicated siRNA and treated or not with 100 μM Eto for 1 h. ***P < 0.001, **P < 0.01 (unpaired t test). Scale bar 30 μm. Representative of two independent experiments.

References

    1. Abbas T, Keaton MA, Dutta A (2013) Genomic instability in cancer. Cold Spring Harb Perspect Biol 5: a012914. 10.1101/cshperspect.a012914 - DOI - PMC - PubMed
    1. Angèle S, Treilleux I, Brémond A, Tanière P, Hall J (2003) Altered expression of DNA double-strand break detection and repair proteins in breast carcinomas. Histopathology 43: 347–353. 10.1046/j.1365-2559.2003.01713.x - DOI - PubMed
    1. Bakkenist CJ, Kastan MB (2003) DNA damage activates ATM through intermolecular autophosphorylation and dimer dissociation. Nature 421: 499–506. 10.1038/nature01368 - DOI - PubMed
    1. Bartkova J, Horejsí Z, Koed K, Krämer A, Tort F, Zieger K, Guldberg P, Sehested M, Nesland JM, Lukas C, et al. (2005) DNA damage response as a candidate anti-cancer barrier in early human tumorigenesis. Nature 434: 864–870. 10.1038/nature03482 - DOI - PubMed
    1. Broz P, Dixit VM (2016) Inflammasomes: Mechanism of assembly, regulation and signalling. Nat Rev Immunol 16: 407–420. 10.1038/nri.2016.58 - DOI - PubMed

Publication types

MeSH terms

Substances