. 2023 Mar 8;43(10):1797-1813.
doi: 10.1523/JNEUROSCI.1333-22.2023. Epub 2023 Feb 6.

Targeting Astrocyte Signaling Alleviates Cerebrovascular and Synaptic Function Deficits in a Diet-Based Mouse Model of Small Cerebral Vessel Disease

Affiliations

Targeting Astrocyte Signaling Alleviates Cerebrovascular and Synaptic Function Deficits in a Diet-Based Mouse Model of Small Cerebral Vessel Disease

Pradoldej Sompol et al. J Neurosci. .

Abstract

Despite the indispensable role that astrocytes play in the neurovascular unit, few studies have investigated the functional impact of astrocyte signaling in cognitive decline and dementia related to vascular pathology. Diet-mediated induction of hyperhomocysteinemia (HHcy) recapitulates numerous features of vascular contributions to cognitive impairment and dementia (VCID). Here, we used astrocyte targeting approaches to evaluate astrocyte Ca2+ dysregulation and the impact of aberrant astrocyte signaling on cerebrovascular dysfunction and synapse impairment in male and female HHcy diet mice. Two-photon imaging conducted in fully awake mice revealed activity-dependent Ca2+ dysregulation in barrel cortex astrocytes under HHcy. Stimulation of contralateral whiskers elicited larger Ca2+ transients in individual astrocytes of HHcy diet mice compared with control diet mice. However, evoked Ca2+ signaling across astrocyte networks was impaired in HHcy mice. HHcy also was associated with increased activation of the Ca2+/calcineurin-dependent transcription factor NFAT4, which has been linked previously to the reactive astrocyte phenotype and synapse dysfunction in amyloid and brain injury models. Targeting the NFAT inhibitor VIVIT to astrocytes, using adeno-associated virus vectors, led to reduced GFAP promoter activity in HHcy diet mice and improved functional hyperemia in arterioles and capillaries. VIVIT expression in astrocytes also preserved CA1 synaptic function and improved spontaneous alternation performance on the Y maze. Together, the results demonstrate that aberrant astrocyte signaling can impair the major functional properties of the neurovascular unit (i.e., cerebral vessel regulation and synaptic regulation) and may therefore represent a promising drug target for treating VCID and possibly Alzheimer's disease and other related dementias.SIGNIFICANCE STATEMENT The impact of reactive astrocytes in Alzheimer's disease and related dementias is poorly understood. Here, we evaluated Ca2+ responses and signaling in barrel cortex astrocytes of mice fed with a B-vitamin deficient diet that induces hyperhomocysteinemia (HHcy), cerebral vessel disease, and cognitive decline. Multiphoton imaging in awake mice with HHcy revealed augmented Ca2+ responses in individual astrocytes, but impaired signaling across astrocyte networks. Stimulation-evoked arteriole dilation and elevated red blood cell velocity in capillaries were also impaired in cortex of awake HHcy mice. Astrocyte-specific inhibition of the Ca2+-dependent transcription factor, NFAT, normalized cerebrovascular function in HHcy mice, improved synaptic properties in brain slices, and stabilized cognition. Results suggest that astrocytes are a mechanism and possible therapeutic target for vascular-related dementia.

Keywords: Alzheimer's disease; Ca2+; neurovascular coupling; reactive astrocytes; synapses; vascular dementia.


Figures

Figure 1.
Figure 1.
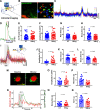
Effects of HHcy diet on spontaneous and evoked Ca2+ transients in barrel cortex astrocytes. A, Two-photon imaging was performed through a glass cranial window over barrel cortex in fully awake mice treated for 12 weeks with CT (n = 4) or HHcy diet (n = 4). B, With the use of AAV-Gfa104-lckGCaMP6f vectors, raw Ca2+ fluctuations (changes in green fluorescence) were assessed in astrocytes near rhodamine-labeled cerebrovessels (left) and extracted as pseudo-colored ROIs via software-based detection (right). Scale bar, 40 µm. C, representative spontaneous Ca2+ transients (ΔF/F) recorded in multiple ROIs in the representative FOV shown in B. D, Representative trace illustrating spontaneous Ca2+ transient amplitude and rise/decay time measures. E–H, Effects of HHcy on spontaneous Ca2+ transient parameters (averaged across ROI in each FOV) including transient frequency (E), transient amplitude (F), rise time (G), and decay time (H); n = 39 FOVs in CT diet mice; n = 37 FOVs in HHcy mice. I, representative Ca2+ transients evoked in multiple ROIs of the barrel cortex by air-puff stimulation of the contralateral vibrissae (10 Hz for 10 s). J–L, Effects of diet on amplitude, rise, and decay parameters of evoked Ca2+ transients (averaged across ROIs in each FOV). HHcy was associated with greater transient amplitudes (J) with faster rise (K) and decay (L) kinetics; n = 18 FOVs in CT diet mice; n = 20 FOVs in HHcy mice. M, Before (left) and after (right) images of GCaMP fluorescence (green) in an astrocyte end foot immediately adjacent to a dilating arteriole (red). Scale bar, 40 µm. N, Real-time vasodilatory response and adjacent end foot Ca2+ transient. Note that the end foot Ca2+ transient begins and peaks after the onset and peak of the dilatory response in the adjacent vessel. O–Q, Effects of diet on amplitude (O), rise (P), and decay (Q) parameters of evoked Ca2+ transients in astrocyte end feet. Transients exhibited a faster rise time in HHcy diet mice (P). R, The time interval between the peak vessel dilatory response (T1) and the end foot Ca2+ transient peak (T2; N). End foot Ca2+ responses occurred more rapidly in response to nearby vasodilation; n = 12 FOVs in CT diet mice; n = 14 FOVs in HHcy mice. Data points represent averaged values per FOV. Statistical comparisons made with unpaired t tests.
Figure 2.
Figure 2.
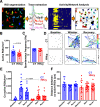
Signal processing and effects of HHcy diet on Ca2+ signaling in astrocyte networks. A, ROIs and FOVs from Figure 1 were handled using a customized MATLAB pipeline including the management of ROI segmentation, trace extraction, and activity analysis. B, The number of active ROIs/mm2 was significantly reduced in HHcy diet mice, suggesting a reduction in the number of actively signaling astrocytes. C, Average oscillation frequency per ROI (during air-puff stimulation) was not affected by diet treatment. Differences in B and C determined with unpaired t tests. D, Correlograms from representative FOVs in a CT and a HHcy diet mouse showing coactive astrocyte connections before (baseline), during (whisker), and after (recovery) air-puff stimulation. Each dot represents an ROI/astrocyte in the FOV. The size of each dot represents the sum of weighted correlation coefficients (i.e., correlated activity) with all other astrocytes. The color of the line between astrocytes indicates the unweighted activity correlation. E, Number of coactive ROIs/mm2 in mice treated with CT or HHcy diet. The correlated activity in the astrocyte network is low during the baseline but increases significantly during whisker stimulation. Relative to CT diet mice, mice treated with HHcy diet exhibit a smaller increase in the number of coactive ROIs during stimulation. F, The average distance, or length, between coactive ROI pairs during whisker stimulation trials was not affected by diet treatment. Data points in B, C, E, F represent averaged values per FOV (i.e., n = FOVs, 16–18 in CT diet mice, n = 18–20 in HHcy mice). Significance determined in E with Sidak's multiple-comparisons test.
Figure 3.
Figure 3.
Effects of HHcy diet on CN/NFAT4 properties. A, Confocal micrographs of the hippocampal CA1 region showing strong colocalization of NFAT4 (green) with GFAP-positive (red) astrocytes. Right, Note in the merged image that NFAT4 colocalizes to the nucleus of many GFAP-positive astrocytes, indicating increased NFAT4 activation. Scale, 50 µm. B, Strong nuclear localization of NFAT4 is highlighted in an astrocyte magnified and 3D rendered from the merged image in A (right, hatched box). Bottom, The same astrocyte at higher magnification. Calibration, 2 µm) and rotated to emphasize the nuclear colocalization of NFAT4 (in teal). C, Representative EMSA from brain tissue harvested from CT diet and HHcy diet mice illustrate NFAT/DNA binding activity. The arrowhead points to bands that are sensitive (i.e., exhibit a block shift) to the addition of a mononclonal NFAT4 antibody (Extended Data Fig. 3-1). D, NFAT4/DNA binding activity was significantly increased in HHcy diet mice. E, Representative WB for the CN Aα subunit in cytosolic and nuclear fractions harvested from brains of CT diet and HHcy diet mice. Note that using an N-terminal antibody, we observed a single band ∼60 kDa in both diet groups, which represents the FL form of CN A. No signs of proteolysis (i.e., bands in the 45–57 kDa range) related to constitutively high CN activity were observed. F, In both diet groups, CN levels were highest in cytosolic fractions, and the nuclear/cytosolic ratio was not affected by diet; n = 4–5 mice/group in D and F. Significance determined with unpaired t tests. G, Representative two-photon images showing Gfa2-dependent EGFP expression in barrel cortex astrocytes of individual mice injected with AAV-Gfa2-EGFP or AAV-Gfa2-VIVIT-EGFP vectors. Extended Data Figure 3-2 shows that EGFP volume increases progressively with time on HHcy diet. Images in G were taken at 3 months postdiet. Scale bar, 30 µm. H, EGFP volume in AAV-Gfa2-EGFP or AAV-Gfa2-VIVIT-EGFP-treated mice at the prediet time point (pre) and after 3 months (m) of CT or HHcy diet (3 months). GFAP promoter-driven EGFP expression in HHcy mice is significantly increased over prediet baseline levels. No significant changes in EGFP levels were observed across time points in CT diet mice or in HHcy mice treated with VIVIT. In D, F, H each individual data point represents an individual mouse (n = 12–13 mice/group). Significance determined with rmANOVA followed by paired t tests (pre vs 3m), within diet group.
Figure 4.
Figure 4.
Effects of diet on cerebrovessel leakiness and impact of astrocytic NFAT inhibition. Immunohistochemical (IHC) analyses of cerebrovessels showed little difference in terms of density or average size (Extended Data Fig. 4-1), so we next functionally assessed cerebrovessels for leakiness. A, Z stacks (side and top views) of two-photon images of rhodamine dextran filled cerebrovessels in mouse barrel cortex. Left, The hatched box shows where measures of cerebral vessel leakiness were acquired. B, Two-photon micrographs of z-stack images acquired over a 1 h imaging session. Arrowheads point to select cerebrovessels where rhodamine fluorescence intensity was clearly lost from the 0 to the 60 min time point. C, D, Time plots showing the mean ± SEM vessel rhodamine fluorescence intensity across 60 min imaging sessions for CT diet (C) and HHcy diet mice (D) treated with AAV-Gfa2-EGFP (blue) or AAV-Gfa2-VIVIT (red). Values are expressed as percentage of the 0 min time point. E, Scatter plots showing vessel rhodamine fluorescence intensity at the 60 min time point (percentage of 0 min time point) in diet and AAV treatment groups. Greater loss of rhodamine fluorescence was associated with HHcy versus CT diet. Interestingly, VIVIT also led to greater loss of rhodamine fluorescence in the CT diet group but not the HHcy diet group. Each data point represents an individual mouse (n = 6–7 mice/group). Significance determined with rmANOVA followed by paired t tests (pre vs 3 months), within diet group.
Figure 5.
Figure 5.
Effects of diet on neurovascular coupling and impact of astrocytic NFAT inhibition. A, B, Representative two-photon images of penetrating arterioles (red) in a fully awake mouse fed with CT diet and pretreated with AAV-Gfa2-EGFP control vectors (EGFP-expressing astrocytes are green). Images were taken before A (baseline) and during B (whisker stimulation) air-puff stimulation of the contralateral vibrissae (10 Hz, 10 s). The hatched lines in the baseline image (A) mark the perimeter of the dilated vessel shown during stimulation (B). Scale bar, 40 µm. C, D, Time plots showing maximum arteriole volume (mean ± SEM) measured before, during, and after whisker stimulation (pink rectangle) in CT diet (C) and HHcy diet (D) mice treated with AAV-Gfa2-EGFP (blue) or AAV-Gfa2-VIVIT (red). Values are expressed as a percentage of the prestimulation baseline. E–G, Scatter plots showing maximal arteriole dilation (E), dilation onset (F), and dilation offset (G) during whisker stimulation as a function of diet and AAV treatment; n = 8–11 mice/group. Relative to CT diet mice, dilatory responses were reduced in amplitude/magnitude (E) in HHcy mice treated with control AAV-Gfa2-EGFP. Conversely, treatment of HHCy mice with AAV-Gfa2-VIVIT prevented these deficits. VIVIT also accelerated the onset/offset kinetics of arteriole dilation in HHcy mice (F, G). Each data point represents an individual mouse (n = number of mice/group). H, Two-photon micrograph of a barrel cortex capillary. Line scans along the horizontal axis (yellow) line were used to track the movement of RBCs (dark spots along the capillary, white arrowheads) through the capillary lumen. I, Representative time plot showing the change in maximum RBC velocity during air-puff whisker stimulation (pink rectangle). J, Scatter plot showing maximum capillary RBC velocity (normalized to baseline) across diet and AAV treatment groups; n = 13–31 capillaries/group. Air-puff-mediated elevations in RBC velocity were reduced in HHcy EGFP mice relative to the CT diet-EGFP and HHcy-VIVIT groups. K, Representative pseudo-colored images showing CBF in HHcy mice treated with AAV-Gfa2-EGFP (n = 4) or AAV-Gfa2-VIVIT (n = 5) as measured with pCASL MRI. The CBF level is colorized in a linear scale (far right). L, Scatter plot showing quantified CBF levels in EGFP- and VIVIT-treated HHcy diet mice. CBF was elevated in the VIVIT group. Significance for A–J determined with two-way ANOVA and Sidak's multiple-comparisons tests. Significance for L and K determined with unpaired t test.
Figure 6.
Figure 6.
Effects of diet on basal synaptic strength and impact of astrocytic NFAT inhibition. A, Mice treated with CT or HHcy diet each received an intrahippocampal injection of AAV-Gfa2-EGFP (control AAV) into one hemisphere (blue) and AAV-Gfa2-VIVIT into the other hemisphere (red). B, At the end of diet treatment, coronal sections were prepared, and EPSPs were recorded from CA1 stratum radiatum after stimulation of CA3 Schaffer collaterals. C, Representative EPSP waveforms at increasing stimulus intensities along with the primary parameters investigated, that is, FV, EPSP slope, and PS threshold (shown in pink). D, E, Mean ± SEM EPSP slopes plotted against corresponding FV amplitudes (mean ± SEM) across 12 increasing stimulus levels in CT diet and HHcy diet mice (blue, AAV-Gfa2-EGFP hemisphere; red, AAV-Gfa2-VIVIT hemisphere). FK, Field potential parameters extracted from the synaptic strength curves shown in D, E, maximum FV amplitude (F), half-maximum FV (G), curve slope (H), maximum EPSP slope (I), EPSP/FV ratio (J), and PS threshold (K). L–N, Interhemispheric comparisons within each mouse illustrating AAV-treatment effects on the maximal EPSP slope (L), the EPSP/FV ratio (M), and the PS threshold in mice fed with CT or HHcy diet. Field potential parameters in HHcy mice were consistently improved by treatment with AAV-Gfa2-VIVIT. Each data point represents field potential values averaged within each hemisphere per mouse (n = 8–9 mice per diet group). Diet effects were detected with two-way ANOVA. Within-animal AAV effects were determined with paired t tests. n.s. non-significant.
Figure 7.
Figure 7.
Effects of diet on hippocampal-dependent synaptic plasticity and behavior and the impact of astrocytic NFAT inhibition. A–D, CT diet and HHcy diet mice that received intrahippocampal injections of AAV-Gfa2-EGFP (control AAAV) into one hemisphere and AAV-Gfa2-VIVIT into the other hemisphere (same mice from Fig. 5). Time plots showing mean ± SEM EPSP slopes (normalized to baseline) in CT diet mice (A) or in HHcy diet mice (B) collected before and after the delivery of two 100 Hz stimulus trains (1 s duration/separated by 10 s). Blue plot symbols are from recordings collected in the AAV-Gfa2-EGFP hemisphere, and red plot symbols show recordings collected from the AAV-Gfa2-VIVIT hemisphere. Insets, Representative averaged EPSP waveforms from each AAV-treated hemisphere before (1) and after (2) 100 Hz stimulation. Calibration: 1 mV, 5 ms. C, Scatter plots showing average LTP amplitude in each AAV/diet treatment group. D, Interhemispheric comparisons of LTP levels within each mouse treated with CT or HHcy diet. LTP was generally reduced in the EGFP-treated (control AAV) hemisphere of HHcy diet mice. This HHcy-mediated deficit was prevented by astrocytic NFAT inhibition with VIVIT. Each data point represents field potential values averaged within each hemisphere per mouse (n = 8–9 mice per diet group). Diet effects were detected with two-way ANOVA. Within-animal AAV effects were determined with paired t tests. E, For behavioral assessments, CT diet and HHcy diet mice received bilateral hippocampal injections of either AAV-Gfa2-EGFP or AAV-Gfa2-VIVIT. F, Mean time spent near the perimeter of an open field maze. G, Mean alternations (%) on a Y maze. HHcy-related deficits on the Y maze were prevented by treatment with AAV-Gfa2-VIVIT. Each data point in F and G represent an individual mouse; n = 17–20 mice per group. Significance determined for behavioral assays using two-way ANOVA followed by Sidak's multiple-comparisons tests. n.s. non-significant.

Comment in

References

    1. Abdul HM, Sama MA, Furman JL, Mathis DM, Beckett TL, Weidner AM, Patel ES, Baig I, Murphy MP, LeVine H 3rd, Kraner SD, Norris CM (2009) Cognitive decline in Alzheimer's disease is associated with selective changes in calcineurin/NFAT signaling. J Neurosci 29:12957–12969. 10.1523/JNEUROSCI.1064-09.2009 - DOI - PMC - PubMed
    1. Ali M, Falkenhain K, Njiru BN, Murtaza-Ali M, Ruiz-Uribe NE, Haft-Javaherian M, Catchers S, Nishimura N, Schaffer CB, Bracko O (2022) VEGF signalling causes stalls in brain capillaries and reduces cerebral blood flow in Alzheimer's mice. Brain 145:1449–1463. 10.1093/brain/awab387 - DOI - PMC - PubMed
    1. Aramburu J, Yaffe MB, López-Rodríguez C, Cantley LC, Hogan PG, Rao A (1999) Affinity-driven peptide selection of an NFAT inhibitor more selective than cyclosporin A. Science 285:2129–2133. 10.1126/science.285.5436.2129 - DOI - PubMed
    1. Arora RB, Kumar K, Deshmukh RR (2013) FK506 attenuates intracerebroventricular streptozotocin-induced neurotoxicity in rats. Behav Pharmacol 24:580–589. 10.1097/FBP.0b013e32836546db - DOI - PubMed
    1. Biancardi VC, Son SJ, Ahmadi S, Filosa JA, Stern JE (2014) Circulating angiotensin II gains access to the hypothalamus and brain stem during hypertension via breakdown of the blood-brain barrier. Hypertension 63:572–579. 10.1161/HYPERTENSIONAHA.113.01743 - DOI - PMC - PubMed

Publication types

Substances