

Multi-omics analysis reveals spatiotemporal regulation and function of heteromorphic leaves in Populus
- PMID: 36746772
- PMCID: PMC10152652
- DOI: 10.1093/plphys/kiad063
Multi-omics analysis reveals spatiotemporal regulation and function of heteromorphic leaves in Populus
Abstract
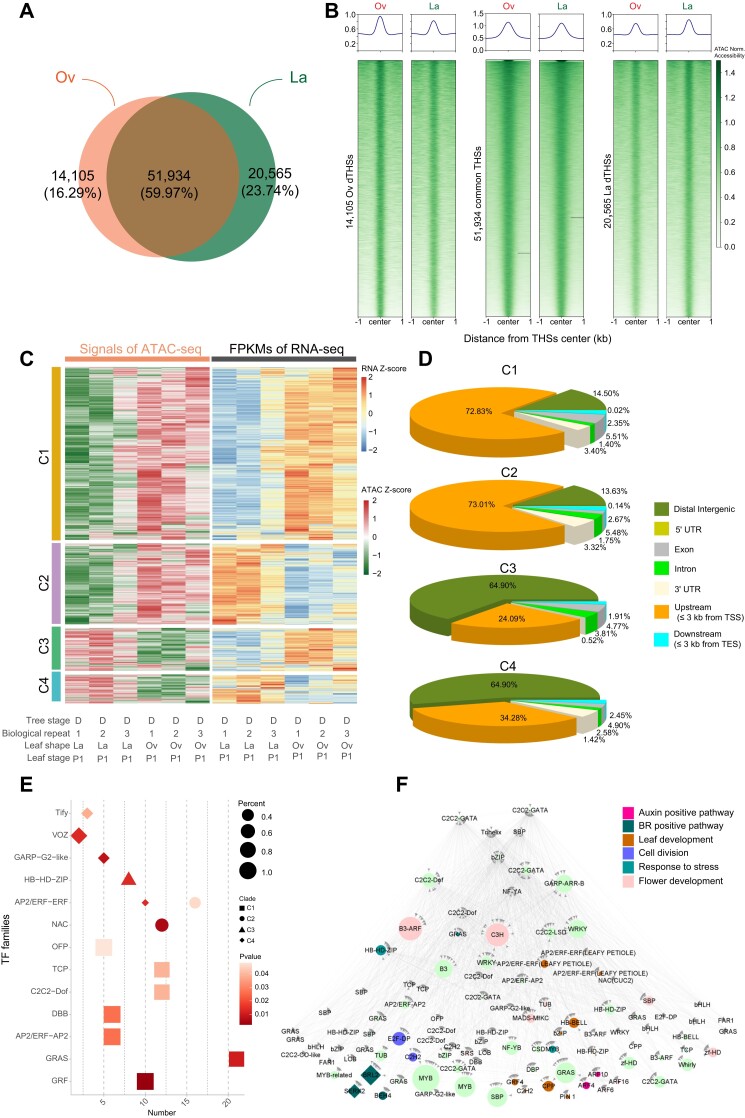
Despite the high economic and ecological importance of forests, our knowledge of the adaptive evolution of leaf traits remains very limited. Euphrates poplar (Populus euphratica), which has high tolerance to arid environment, has evolved four heteromorphic leaf forms, including narrow (linear and lanceolate) and broad (ovate and broad-ovate) leaves on different crowns. Here, we revealed the significant functional divergence of four P. euphratica heteromorphic leaves at physiological and cytological levels. Through global analysis of transcriptome and DNA methylation across tree and leaf developmental stages, we revealed that gene expression and DNA epigenetics differentially regulated key processes involving development and functional adaptation of heteromorphic leaves, such as hormone signaling pathways, cell division, and photosynthesis. Combined analysis of gene expression, methylation, ATAC-seq, and Hi-C-seq revealed longer interaction of 3D genome, hypomethylation, and open chromatin state upregulates IAA-related genes (such as PIN-FORMED1 and ANGUSTIFOLIA3) and promotes the occurrence of broad leaves while narrow leaves were associated with highly concentrated heterochromatin, hypermethylation, and upregulated abscisic acid pathway genes (such as Pyrabactin Resistance1-like10). Therefore, development of P. euphratica heteromorphic leaves along with functional divergence was regulated by differentially expressed genes, DNA methylation, chromatin accessibility, and 3D genome remodeling to adapt to the arid desert. This study advances our understanding of differential regulation on development and functional divergence of heteromorphic leaves in P. euphratica at the multi-omics level and provides a valuable resource for investigating the adaptive evolution of heteromorphic leaves in Populus.
© American Society of Plant Biologists 2023. All rights reserved. For permissions, please e-mail: journals.permissions@oup.com.
Conflict of interest statement
Conflict of interest statement. The authors declare no conflictsof interest.
Figures


Similar articles
-
Drought stress-induced the formation of heteromorphic leaves of Populus euphratica Oliv: evidence from gene transcriptome.Front Plant Sci. 2023 Jun 7;14:1194169. doi: 10.3389/fpls.2023.1194169. eCollection 2023. Front Plant Sci. 2023. PMID: 37351211 Free PMC article.
-
The Identification and Characterization of the PeGRF Gene Family in Populus euphratica Oliv. Heteromorphic Leaves Provide a Theoretical Basis for the Functional Study of PeGRF9.Int J Mol Sci. 2024 Dec 25;26(1):66. doi: 10.3390/ijms26010066. Int J Mol Sci. 2024. PMID: 39795925 Free PMC article.
-
Conjoint Analysis of Genome-Wide lncRNA and mRNA Expression of Heteromorphic Leavesin Response to Environmental Heterogeneityin Populus euphratica.Int J Mol Sci. 2019 Oct 17;20(20):5148. doi: 10.3390/ijms20205148. Int J Mol Sci. 2019. PMID: 31627402 Free PMC article.
-
Progress in studying heteromorphic leaves in Populus euphratica: leaf morphology, anatomical structure, development regulation and their ecological adaptation to arid environments.Plant Signal Behav. 2021 Apr 3;16(4):1870842. doi: 10.1080/15592324.2020.1870842. Epub 2021 Jan 11. Plant Signal Behav. 2021. PMID: 33427562 Free PMC article. Review.
-
Genome-wide Identification of WRKY Genes in the Desert Poplar Populus euphratica and Adaptive Evolution of the Genes in Response to Salt Stress.Evol Bioinform Online. 2015 Aug 5;11(Suppl 1):47-55. doi: 10.4137/EBO.S22067. eCollection 2015. Evol Bioinform Online. 2015. PMID: 26309388 Free PMC article. Review.
Cited by
-
Drought stress-induced the formation of heteromorphic leaves of Populus euphratica Oliv: evidence from gene transcriptome.Front Plant Sci. 2023 Jun 7;14:1194169. doi: 10.3389/fpls.2023.1194169. eCollection 2023. Front Plant Sci. 2023. PMID: 37351211 Free PMC article.
-
Multi Characteristic Analysis of Vascular Cambium Cells in Populus euphratica Reveals Its Anti-Aging Strategy.Plants (Basel). 2024 Dec 19;13(24):3549. doi: 10.3390/plants13243549. Plants (Basel). 2024. PMID: 39771247 Free PMC article.
-
The Identification and Characterization of the PeGRF Gene Family in Populus euphratica Oliv. Heteromorphic Leaves Provide a Theoretical Basis for the Functional Study of PeGRF9.Int J Mol Sci. 2024 Dec 25;26(1):66. doi: 10.3390/ijms26010066. Int J Mol Sci. 2024. PMID: 39795925 Free PMC article.
-
Genome-Wide Identification of DNA Methyltransferase and Demethylase in Populus sect. Turanga and Their Potential Roles in Heteromorphic Leaf Development in Populus euphratica.Plants (Basel). 2025 Aug 1;14(15):2370. doi: 10.3390/plants14152370. Plants (Basel). 2025. PMID: 40805719 Free PMC article.
-
2,2',4,4'-Tetrabromodiphenyl Ether (BDE-47) at Environmental Levels Influenced Photosynthesis in the Mangrove Species Kandelia obovata.Toxics. 2024 Jun 25;12(7):456. doi: 10.3390/toxics12070456. Toxics. 2024. PMID: 39058108 Free PMC article.
References
-
- Alpert P, Simms EL. The relative advantages of plasticity and fixity in different environments: when is it good for a plant to adjust? Evol Ecol. 2002:16(3):285–297. 10.1023/A:1019684612767 - DOI
Publication types
MeSH terms
Substances
LinkOut - more resources
Full Text Sources
