. 2023 Feb 6;14(2):84.
doi: 10.1038/s41419-023-05567-9.

Regulation of immunological tolerance by the p53-inhibitor iASPP

Affiliations

Regulation of immunological tolerance by the p53-inhibitor iASPP

Elliot H Akama-Garren et al. Cell Death Dis. .

Abstract

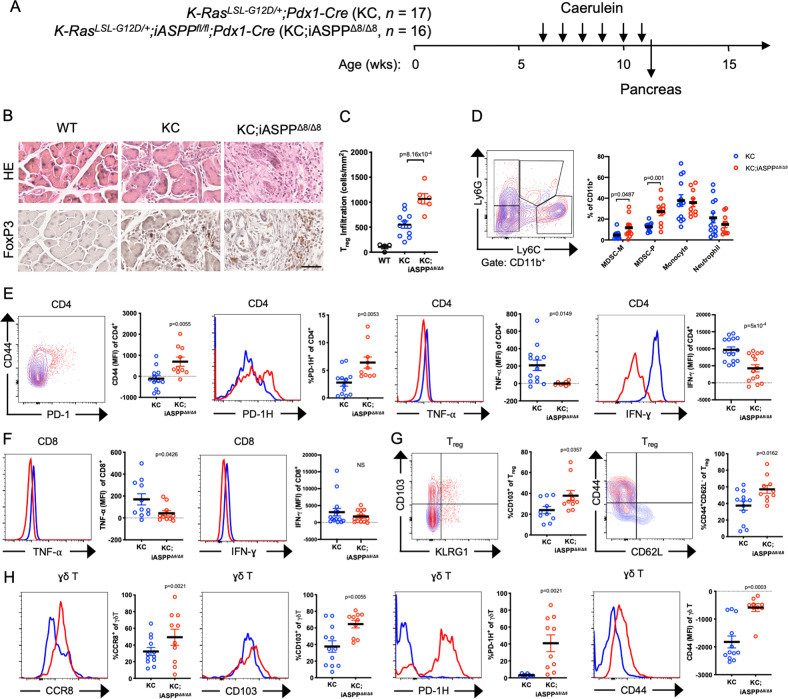
Maintenance of immunological homeostasis between tolerance and autoimmunity is essential for the prevention of human diseases ranging from autoimmune disease to cancer. Accumulating evidence suggests that p53 can mitigate phagocytosis-induced adjuvanticity thereby promoting immunological tolerance following programmed cell death. Here we identify Inhibitor of Apoptosis Stimulating p53 Protein (iASPP), a negative regulator of p53 transcriptional activity, as a regulator of immunological tolerance. iASPP-deficiency promoted lung adenocarcinoma and pancreatic cancer tumorigenesis, while iASPP-deficient mice were less susceptible to autoimmune disease. Immune responses to iASPP-deficient tumors exhibited hallmarks of immunosuppression, including activated regulatory T cells and exhausted CD8+ T cells. Interestingly, iASPP-deficient tumor cells and tumor-infiltrating myeloid cells, CD4+, and γδ T cells expressed elevated levels of PD-1H, a recently identified transcriptional target of p53 that promotes tolerogenic phagocytosis. Identification of an iASPP/p53 axis of immune homeostasis provides a therapeutic opportunity for both autoimmune disease and cancer.


Conflict of interest statement

The authors declare no competing interests.

Figures

Fig. 1
Fig. 1. iASPP Deficiency Attenuates CD4+ T Cell Activation and Potentiates Treg Function.
A Flow cytometry dot plots (left) and quantification (right) of CD4+ T cell division 72 h after anti-CD3 stimulation analyzed by CFSE dilution. B Flow cytometric quantification of PD-1 expression in CD4+ T cells in (A). MFI median fluorescent intensity. C Flow cytometry contour plots of live-dead stain of CD4+ T cells 72 h after anti-CD3 stimulation. D Flow cytometric quantification of suppressive activity of Treg cells examined by cellular division of responder Tconv cells as measured by CFSE dilution 72 h after co-culture.
Fig. 2
Fig. 2. iASPP-Deficient Mice are Less Susceptible to Experimental Autoimmune Encephalitis.
A Schematic of experimental autoimmune encephalomyelitis (EAE) model and experimental design. Mice were monitored until 30 days after immunization with MOG/CFA or until reaching primary endpoint of bilateral hind limb paralysis (clinical severity score = 3). MOG, 200 μg MOG35-55 peptide (MEVGWYRSPFSRVVHLYRNGK); CFA, Complete Freund’s Adjuvant supplemented with 400 μg H37Ra mycobacterium tuberculosis; PTx, 300 ng pertussis toxin. B Clinical course of MOG-induced EAE in WT (n = 7) or iASPP−/− (n = 10) mice. AUC, area under the curve. C Luxol fast blue (LFB), HE, and CD3 immunohistochemistry stains of corpus callosum, cerebellum, and spinal cord isolated from WT (n = 4) or iASPP−/− (n = 6) mice 30 days after immunization with MOG/CFA. Arrows indicate areas of demyelination. Scale, 1 mm (top) and 100 μm (bottom).
Fig. 3
Fig. 3. Pancreatic Tumors Lacking iASPP Have Increased Treg Infiltration.
A Representative HE stains of pancreas isolated from 25-week-old KrasLSL−G12D/+;Pdx1-Cre (KC, n = 5), and KrasLSL−G12D/+;iASPPfl/fl;Pdx1-Cre (KC;iASPPΔ8/Δ8, n = 6), and KrasLSL−G12D/+;Trp53LSL−R172H/+;Pdx1-Cre (KPC, n = 5) mice. Higher magnification shown below. Scale, 200 μm (top) and 50 μm (bottom). B Proportion of reactive neoplasia, metaplasia, PanIN, versus PDAC of all pancreatic lesions in KC (n = 8, blue), KC;iASPPΔ8/Δ8 (n = 5, red), or KPC (n = 4, brown) mice. Data are sample proportion ± standard error of the sample proportion; Fisher’s exact test, p < 0.05 indicated on graph. C FoxP3 stains of pancreata isolated from KC (n = 5), KC;iASPPΔ8/Δ8 (n = 5), or KPC (n = 5) mice. Arrows indicate FoxP3+ cells. Scale, 100 μm. ADM acinar to ductal metaplasia, PanIN pancreatic intraepithelial neoplasia, PDAC pancreatic ductal adenocarcinoma. D Column scatter plot shows quantification of pancreatic neoplasia-infiltrating FoxP3+ Treg cells per area.
Fig. 4
Fig. 4. Regulatory and γδ T cells in iASPP Deficient Pancreatic Tumors Have an Activated Phenotype.
A Schematic of chronic pancreatitis model and experimental design. Six-week-old WT (n = 5), KrasLSL−G12D/+;Pdx1-Cre (KC, n = 17), or KrasLSL−G12D/+;iASPPfl/fl;Pdx1-Cre (KC;iASPPΔ8/Δ8 n = 16) mice received six weekly doses of caerulein. Mice were sacrificed 48 h after the final dose and pancreata were collected for analysis. B HE, CD3, and FoxP3 immunohistochemistry stains of pancreata following six weekly doses of caerulein. Scale, 250 μm. C Column scatter plot shows quantification of FoxP3+ Treg cells per neoplasia area. D Flow cytometry contour plot (left) and quantification (right) of gating strategy to identify MDSC-M, MDSC-P, monocytes, and neutrophils from KC (blue) or KC;iASPPΔ8/Δ8 (red) pancreata. E Flow cytometry plots (left) and quantification (right) of CD44, PD-1H, TNF-α, and IFN-γ expression in pancreata-infiltrating CD4+ cells from KC (blue) or KC;iASPPΔ8/Δ8 (red) pancreata. MFI median fluorescent intensity. F Flow cytometry histograms (left) and quantification (right) of TNF-α and IFN-γ expression in pancreata-infiltrating CD8+ cells from KC (blue) or KC;iASPPΔ8/Δ8 (red) pancreata. MFI median fluorescent intensity. G Flow cytometry contour plots (left) and quantification (right) of CD103, KLRG1, CD44 and CD62L expression in pancreata-infiltrating Treg cells from KC (blue) or KC;iASPPΔ8/Δ8 (red) pancreata. MFI median fluorescent intensity. H Flow cytometry histograms of CCR8, CD103, PD-1H, and CD44 expression in pancreata-infiltrating γδ T cells from KC (blue) or KC;iASPPΔ8/Δ8 (red) pancreata.
Fig. 5
Fig. 5. Oncogenic Kras Driven Lung Adenocarcinoma is Accelerated in Tumors Lacking iASPP.
A Schematic of initiation of lung adenocarcinoma in iASPPfl/fl (i, n = 2), KrasLSL−G12D/+ (K, n = 3), or KrasLSL−G12D/+;iASPPfl/fl (Ki, n = 3) mice with intranasal inhalation of adenoviral Cre (Ad-Cre). Lungs and mediastinal lymph node (mLN) were collected 15 weeks post-infection (pi). B Proportion of lung tumors classified by histological grade. P value computed by Exact Contingency test. C HE stains of lung lobes 15 weeks after tumor initiation. Scale, 5 mm (top) and 250 μm (bottom). D Quantification of tumor burden of lung tumors in (C). Tumor burden was calculated as total tumor area divided by total area of each lung lobe. E HE stains of lung lobes 15 weeks after tumor initiation. Arrows indicate tertiary lymphoid structures (TLS). Scale, 250 μm. F Quantification of numbers of tertiary lymphoid structures (TLS) present per tumor from mice 15 weeks after tumor initiation.
Fig. 6
Fig. 6. iASPP Deficiency Increases Cell-Autonomous Expression of Tolerogenic Mediators and DAMPs.
A Flow cytometry histograms (left) and quantification (right) of PD-L1 and PD-1H expression by transformed KC (blue) or KC;iASPPΔ8/Δ8 (red) pancreatic tumor cells. MFI, median fluorescent intensity. B Differentially regulated genes in A549 cells following iASPP (PPP1R13L) knockdown. A gene is considered as differentially regulated when the mNET-seq and two ChIP-seq pol II signals in the gene body (TSS + 500 bp to poly(A) site) were >2-fold increased (upregulated, blue) or decreased (downregulated, red) in the knockdown cell line versus wild type cell line. The number of differentially expressed genes is indicated for each category. The genes indicated on the left and right sides are the 15 most downregulated or upregulated genes. C Ranked analysis of transcription factor binding sites in down (blue) or up (red)-regulated genes from the total pol II mNET-seq analysis in A549 cells following iASPP (PPP1R13L) knockdown. Transcription factor enrichment in up or down regulated genes was calculated using DAVID. D Motif analysis of indicated transcription factor binding sites in A549 cells following iASPP (PPP1R13L) knockdown. E Heatmap of log2FC in gene expression of indicated immune-related genes following iASPP (PPP1R13L) knockdown in A549 cells quantified by total pol II mNET-seq. The presence of a TP53 ChIP peak or TP53, AP-1, or NFκB 1/2 binding motif is indicated to the right for each gene. AP-1 and NFκB -1 motif presence was determined by GSEA and p53 motif presence was determined by MEME. F Network plot of gene ontology analysis of differentially expressed genes following iASPP (PPP1R13L) knockdown in A549 cells measured by total pol II mNET-seq. Tan circles represent gene sets and colored dots represent genes colored by log2FC.

References

    1. Galluzzi L, Buqué A, Kepp O, Zitvogel L, Kroemer G. Immunogenic cell death in cancer and infectious disease. Nat Rev Immunol. 2017;17:97–111. - PubMed
    1. Fuchs Y, Steller H. Programmed cell death in animal development and disease. Cell. 2011;147:742–58. - PMC - PubMed
    1. van Kempen TS, Wenink MH, Leijten EFA, Radstake TRDJ, Boes M. Perception of self: distinguishing autoimmunity from autoinflammation. Nat Rev Rheumatol. 2015;11:483–92. - PubMed
    1. Medzhitov R, Janeway CA. Decoding the patterns of self and nonself by the innate immune system. Science. 2002;296:298–300. - PubMed
    1. Thompson CB. Apoptosis in the pathogenesis and treatment of disease. Science. 1995;267:1456–62. - PubMed

Publication types

MeSH terms

Substances